1. Introduction
The forced induction of internal combustion engines by turbochargers is playing an important role. This imposes high requirements on the centrifugal compressor design, which can be achieved with the help of automatic CFD based design optimizations. In centrifugal compressor optimization, many objectives and constraints depending on the requirements and specifications need to be considered. For many optimizations, the efficiency for one or several operating points and the surge margin are crucial values, which shall be increased. While the efficiency is straightforward to evaluate, an adequate expression for the surge margin, which can be used for an optimization, is hard to define.
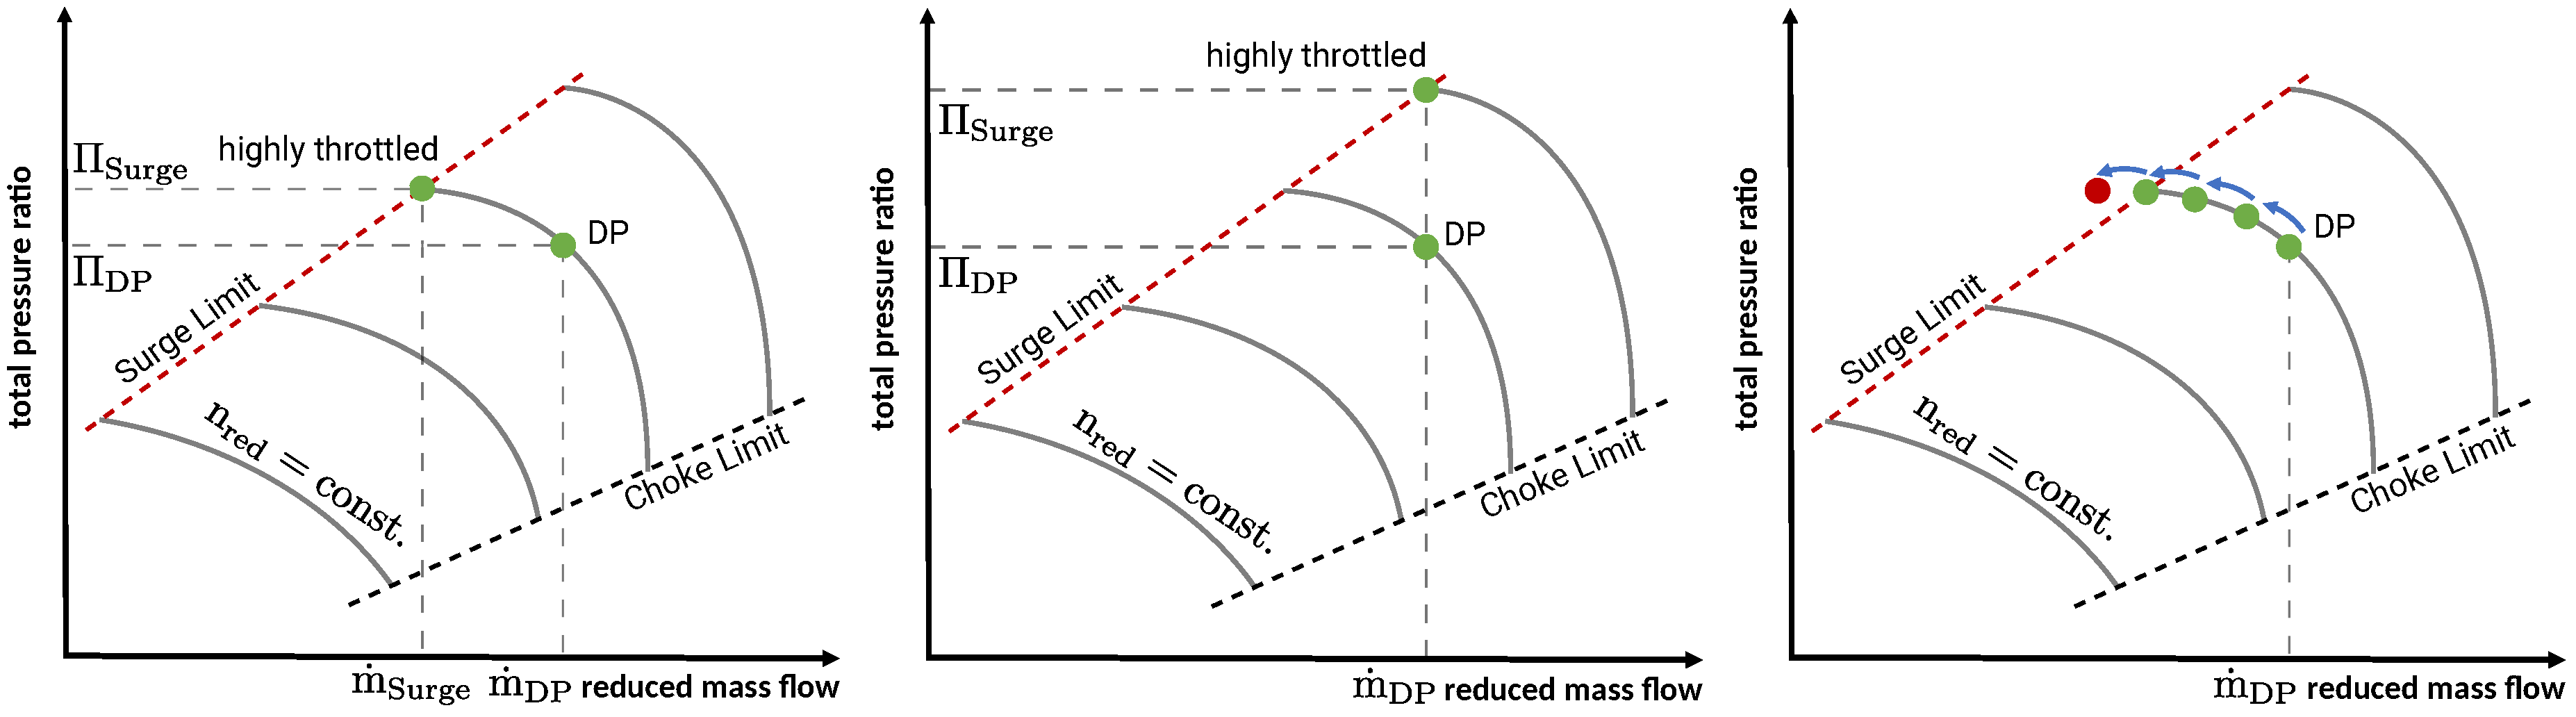
The most common expressions for the surge margin (e.g., see Moore and Reid [
1] or Cumpsty [
2]) are illustrated in
Figure 1 (left side and center). Herein, the surge margin is expressed either at constant rotational speed (
Figure 1 (left side)) or at constant mass flow (
Figure 1 (center)). At constant rotational speed, the surge margin (
) is expressed by both total pressure ratios and mass flows (Equation (
1)), whereas at constant mass flow, only the total pressure ratios are considered (Equation (
2)).
The crucial part with CFD calculations is to determine
and
. The most appropriate method might be a detailed flow analysis through a compressible large eddy simulation, as was shown by Sundström et al. [
3]. However, for an optimization or the analyses of a large number of different impeller designs, such calculations are computationally far too expensive. Considering Equation (
1), another method is the iterative evaluation along a speed line (
Figure 1, right side), in which the numerical surge limit is defined by the last converged CFD calculation (see
Section 5). However, also this method is very time consuming and therefore is inappropriate for an optimization. Hence, the most common approach is to fix the mass flow of a highly throttled operating point for the whole optimization (e.g., see Goinis [
4] or Kim et al. [
5]). Thus, Equation (
1) simplifies to:
and can be used now as the objective function in an optimization.
Although those methods are widely used, they have some critical drawbacks. First, the highly throttled operating point might deviate significantly from the actual surge limit, which reduces the validity of this expression. Second, the method presumes that the slope of the compressor characteristic correlates with the surge margin, which is not true in all cases. In addition, a highly throttled operating point close to surge is rather unsteady, and conventional steady-state CFD models and boundary conditions used for optimization often fail to predict those precisely.
To avoid these issues, Van den Braembussche [
6] and Hiradate et al. [
7] proposed using local flow parameters present at the design point for surge margin estimation. This approach is considered and demonstrated in this paper. A variety of local flow parameters is correlated with the iteratively determined numerical surge limit for 73 designs, and the deceleration of the isentropic Mach number between the leading edge and throat has proven to be the most promising parameter. Based on this knowledge, a new objective function is formulated and used for an optimization with the aim of achieving an increased surge margin by at least constant efficiency.
2. General Procedure
For the definition of this new kind of objective function, a high efficiency full blade centrifugal compressor with a vaned diffuser is considered.
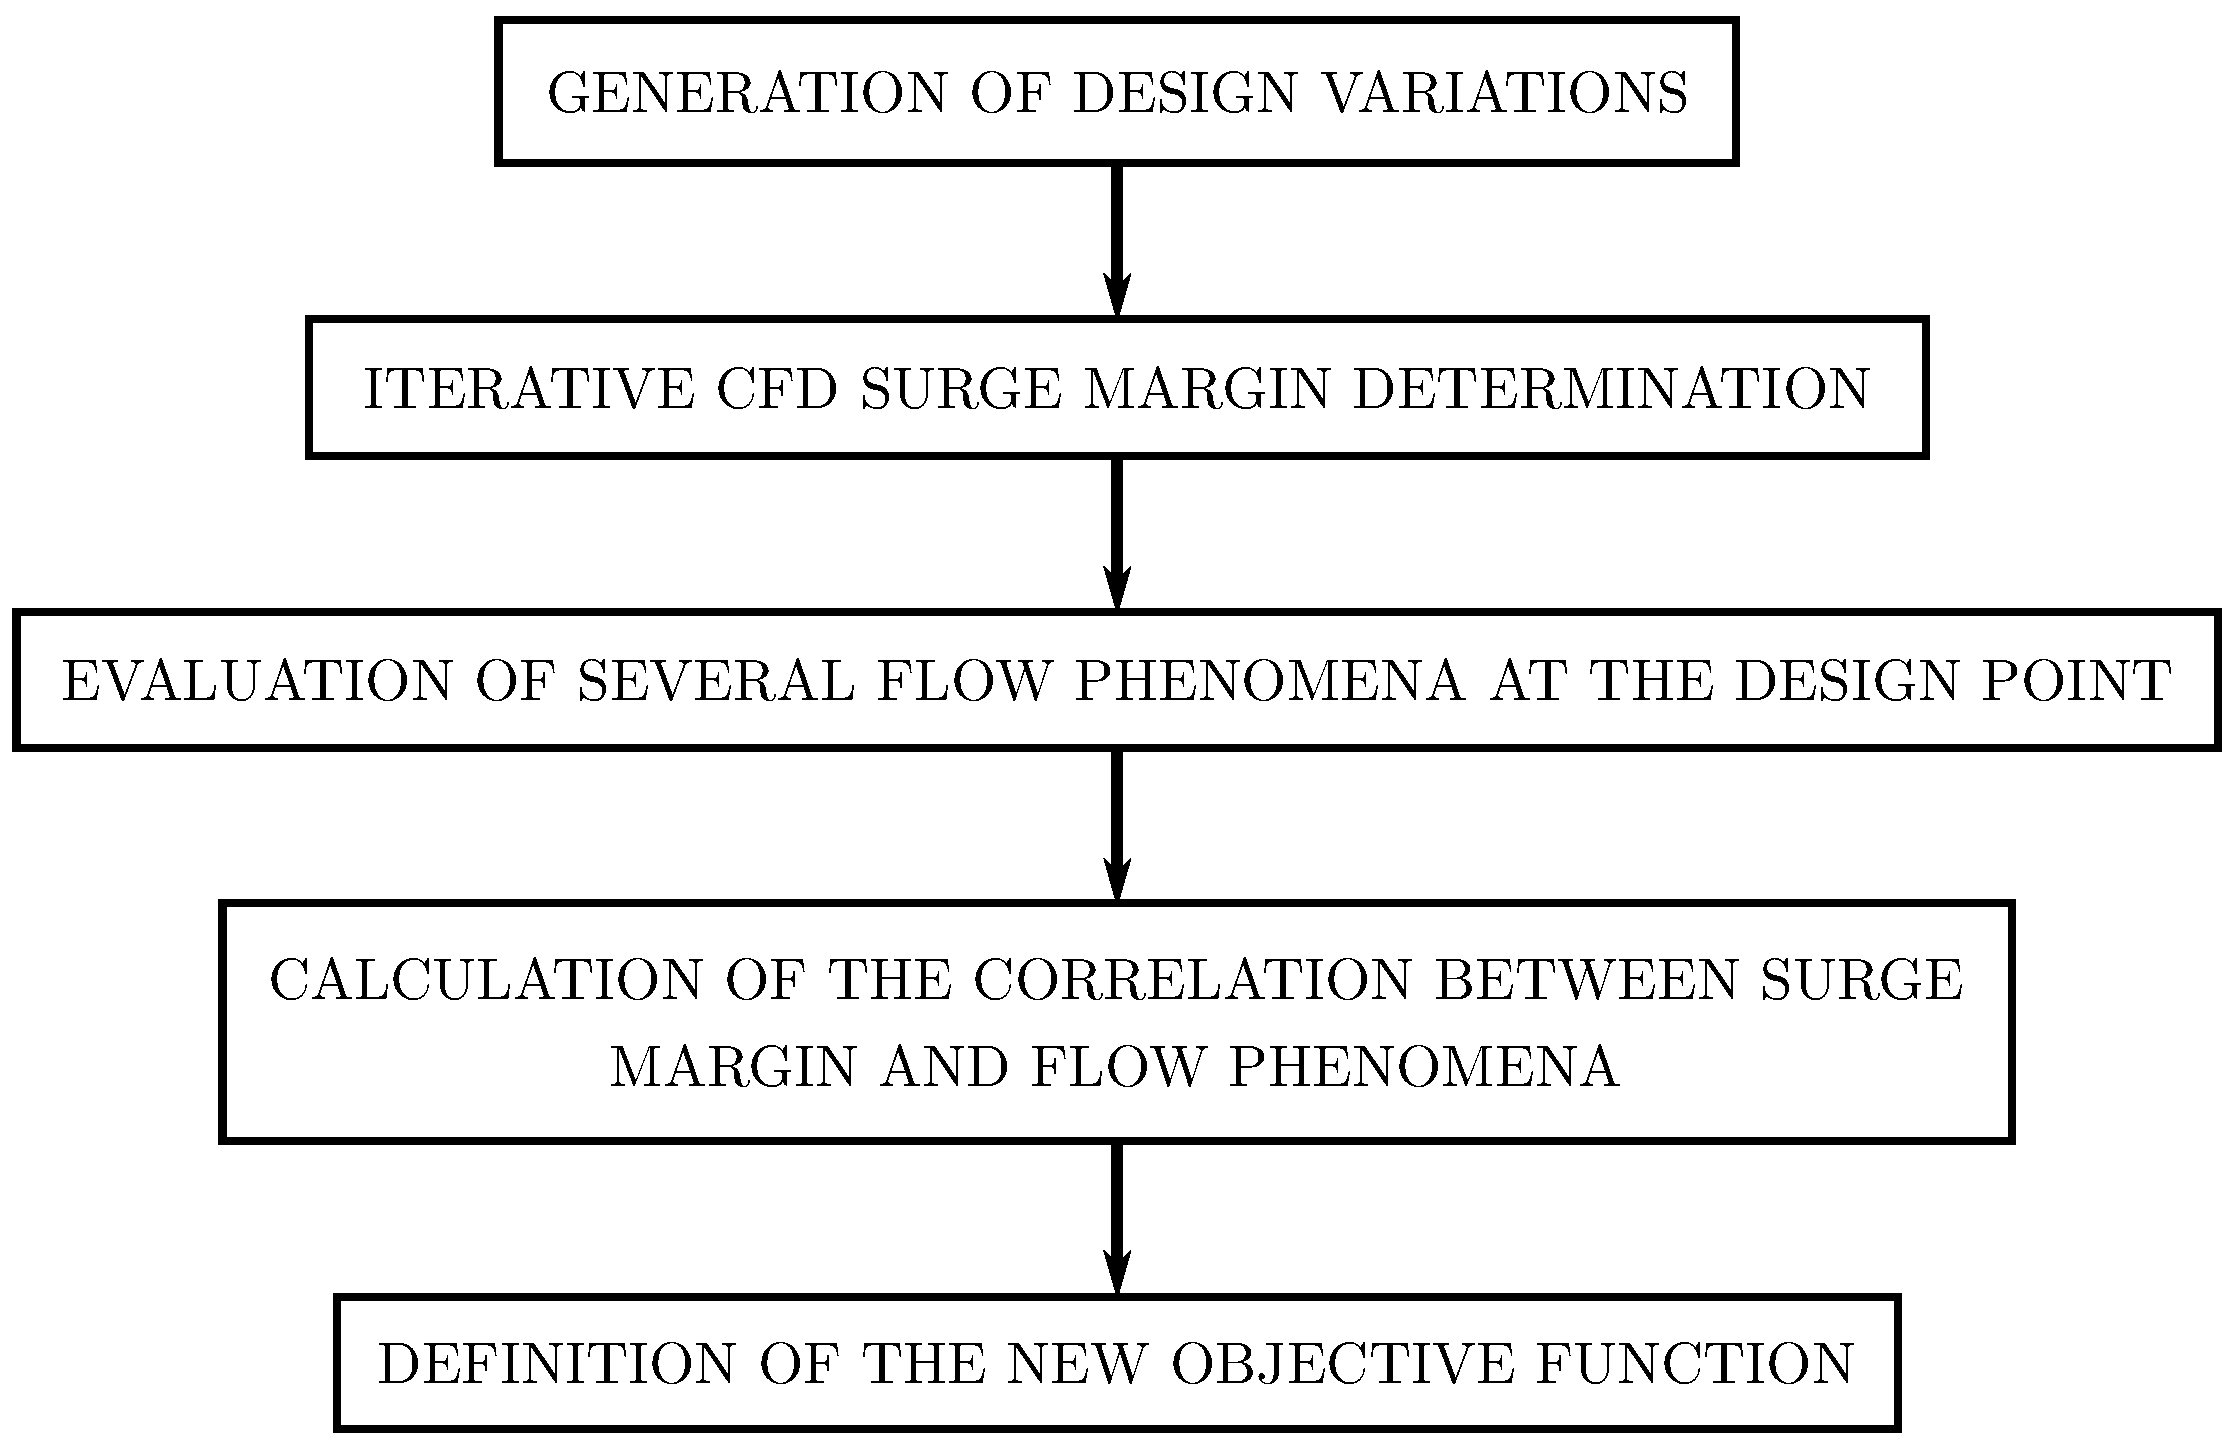
Figure 2 shows the general procedure to formulate the objective function. First, 73 arbitrary design variations are generated through a ULH algorithm by means of a variation of the diffuser width and of the beta angle distribution of the impeller and diffuser blade. Secondly, the surge margin of those designs is iteratively determined. In a third step, several local flow parameters present at the design point are evaluated and correlated with the iteratively determined surge margin. In the last step, the flow parameter with the highest correlation to the surge margin is chosen for surge margin estimation and therefore to formulate the objective function.
3. Parametric Model
The centrifugal compressor geometry is parametrized within the Software CAESES. Besides the diffuser width
, the blade angle distribution for both the impeller and diffuser is varied at the hub and shroud. The transformation from a defined blade angle distribution to a 3D camber surface is based on Miller et al. [
8].
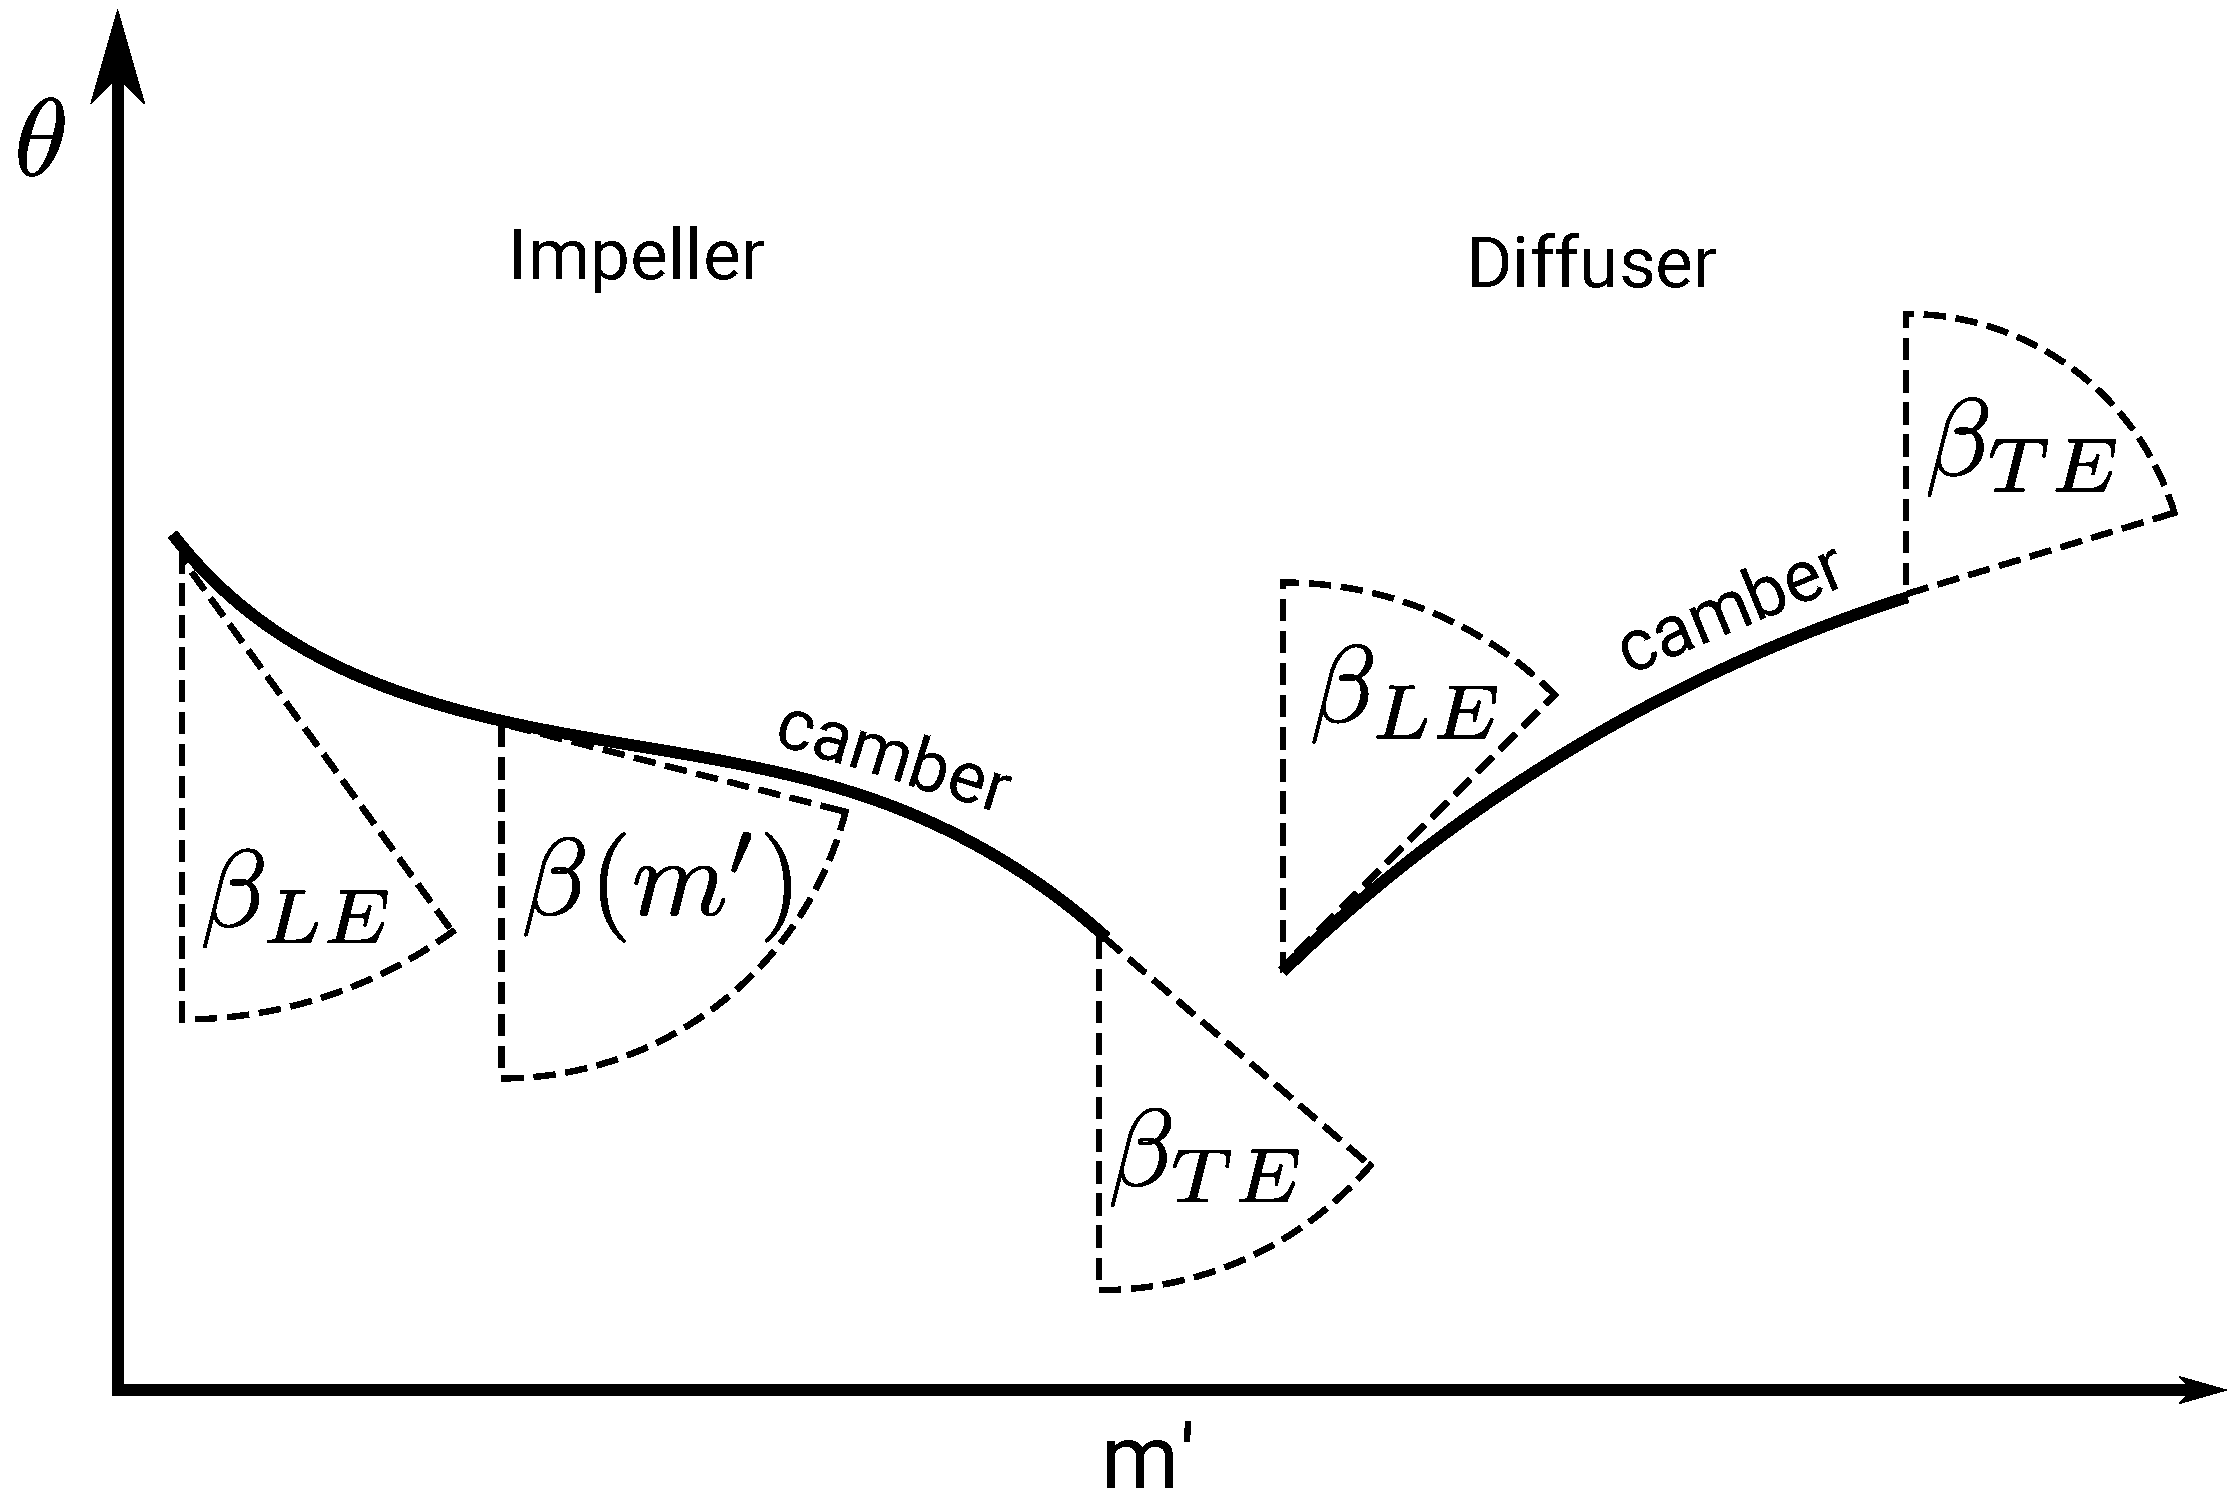
Figure 3 shows the blade-to-blade view of the camber lines of the impeller and diffuser with the respective blade angles
. The camber lines are defined through the blade angle distribution
.
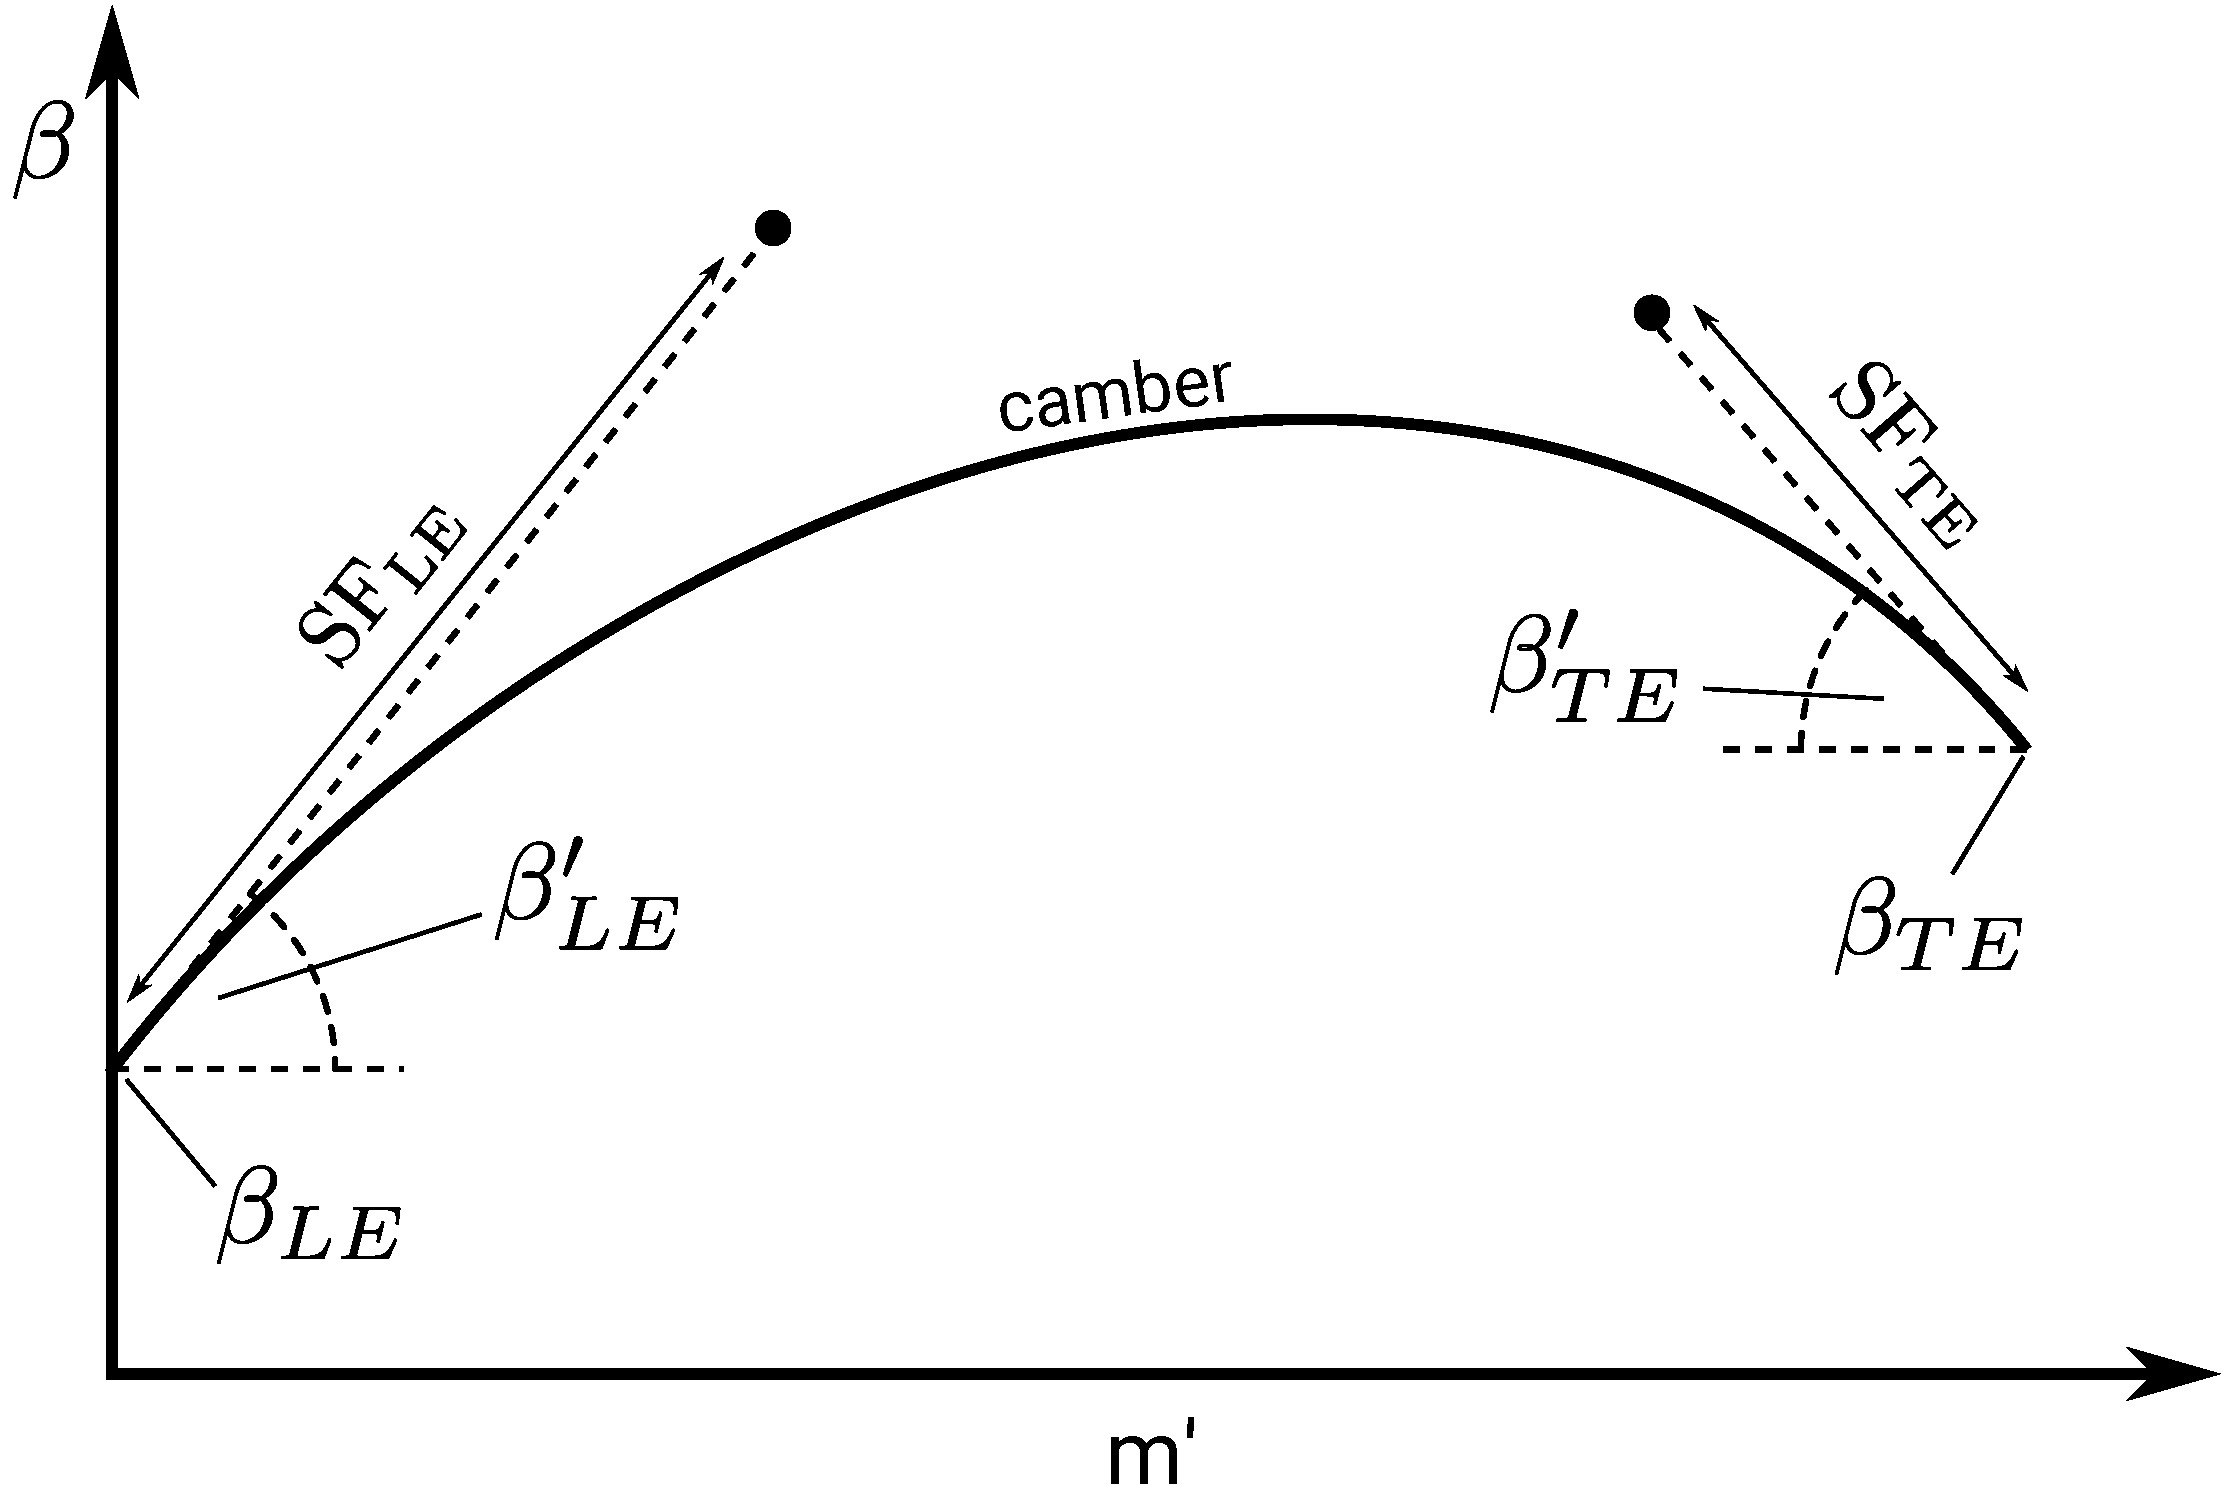
Figure 4 shows the parametrization of
through six design parameters.
and
define the blade angles at LE and TE.
and
define the slope of the blade angle distribution at LE and TE. In other words,
describes the blade curvature at LE and TE. Finally, the impact of the slopes on the whole blade angle distribution is expressed through the slope factors
and
.
Table 1 shows the range of the design parameters for the underlying study. This set of parameters has been chosen to express a wide variety of designs by a minimum amount of parameters.
4. Numerical Setup
For all CFD calculations, the commercial CFD code FINE/Turbo provided by Numeca was used. Within FINE/Turbo, the three-dimensional, density based, structured, steady flow solver was used to solve the Reynolds averaged compressible Navier–Stokes equations. FINE/Turbo is based on the finite volume method and uses the central difference space discretization for spatial discretization. Multigrid methods and local time stepping were used for fast convergence. The closure problem of the Reynolds averaged Navier–Stokes equations was treated by the low Reynolds EARSM (Explicit Algebraic Reynolds Stress Model) model, which also included an additional anisotropy tensor for anisotropic turbulence.
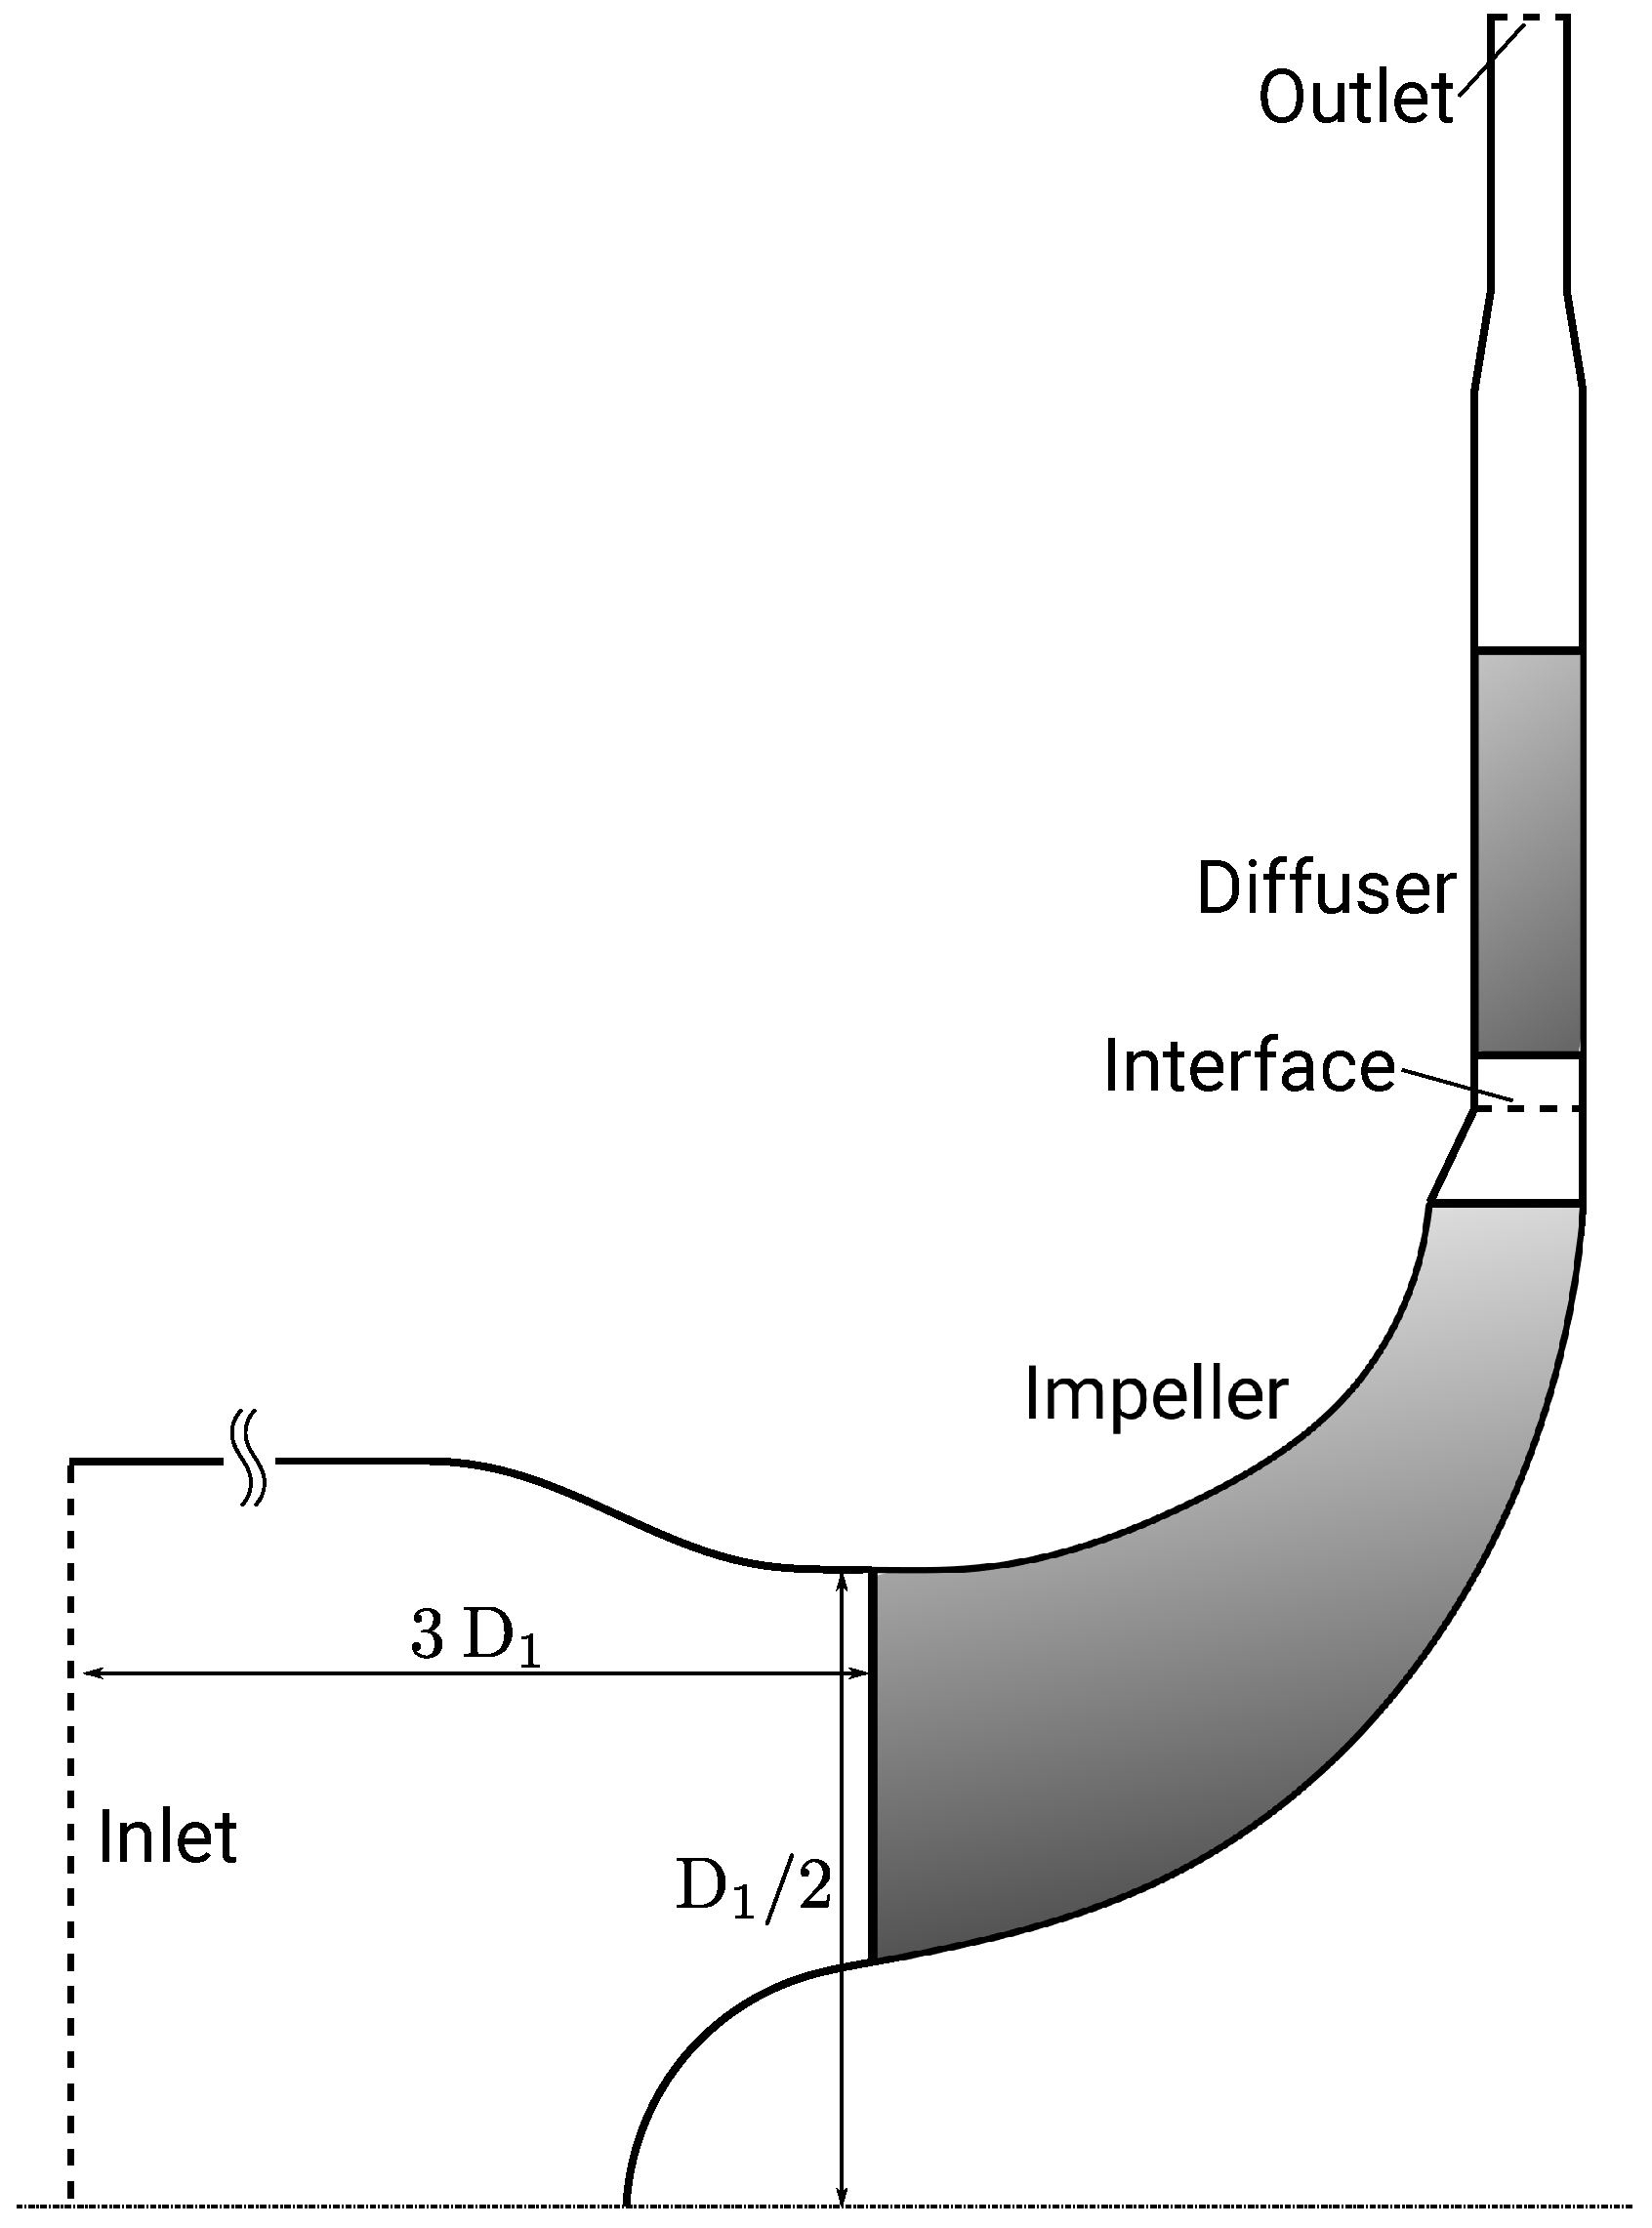
Figure 5 illustrates the CFD domain used in this investigation. The interface between rotating and stationary components was treated by the mixing plane approach. 1D non-reflecting boundary conditions were applied at the interface since a strong interaction between the rotor and stator was expected. Axial inflow, total pressure, and total temperature were used as the inlet boundary condition. The mass flow was used as the outlet boundary condition.
The impeller and diffuser were meshed as single passage, and periodic boundaries were applied. The impeller contained approximately 1.3 million and the diffuser approximately 0.6 million cells. The impeller and diffuser were meshed with 69 cells in the spanwise direction, whereof 17 cells were used for the tip gap region in the case of the impeller. Since a low Reynolds turbulence model was used, the first cell width in the impeller and diffuser was set to m, which resulted in a 5 for all domains.
The sensitivity to the grid resolution was evaluated via the grid convergence index according to Celik et al. [
9]. The grid refinement factor between the different grids was chosen to be 1.3 in each spatial direction. The resulting grid convergence index for the used grid was around 1% for the efficiency. One has to keep in mind that the error based on the grid resolution was similar for all evaluated designs. Therefore, the relative comparison between different designs had a higher accuracy than the comparison to a theoretic grid independent solution, which was considered for the grid convergence index.
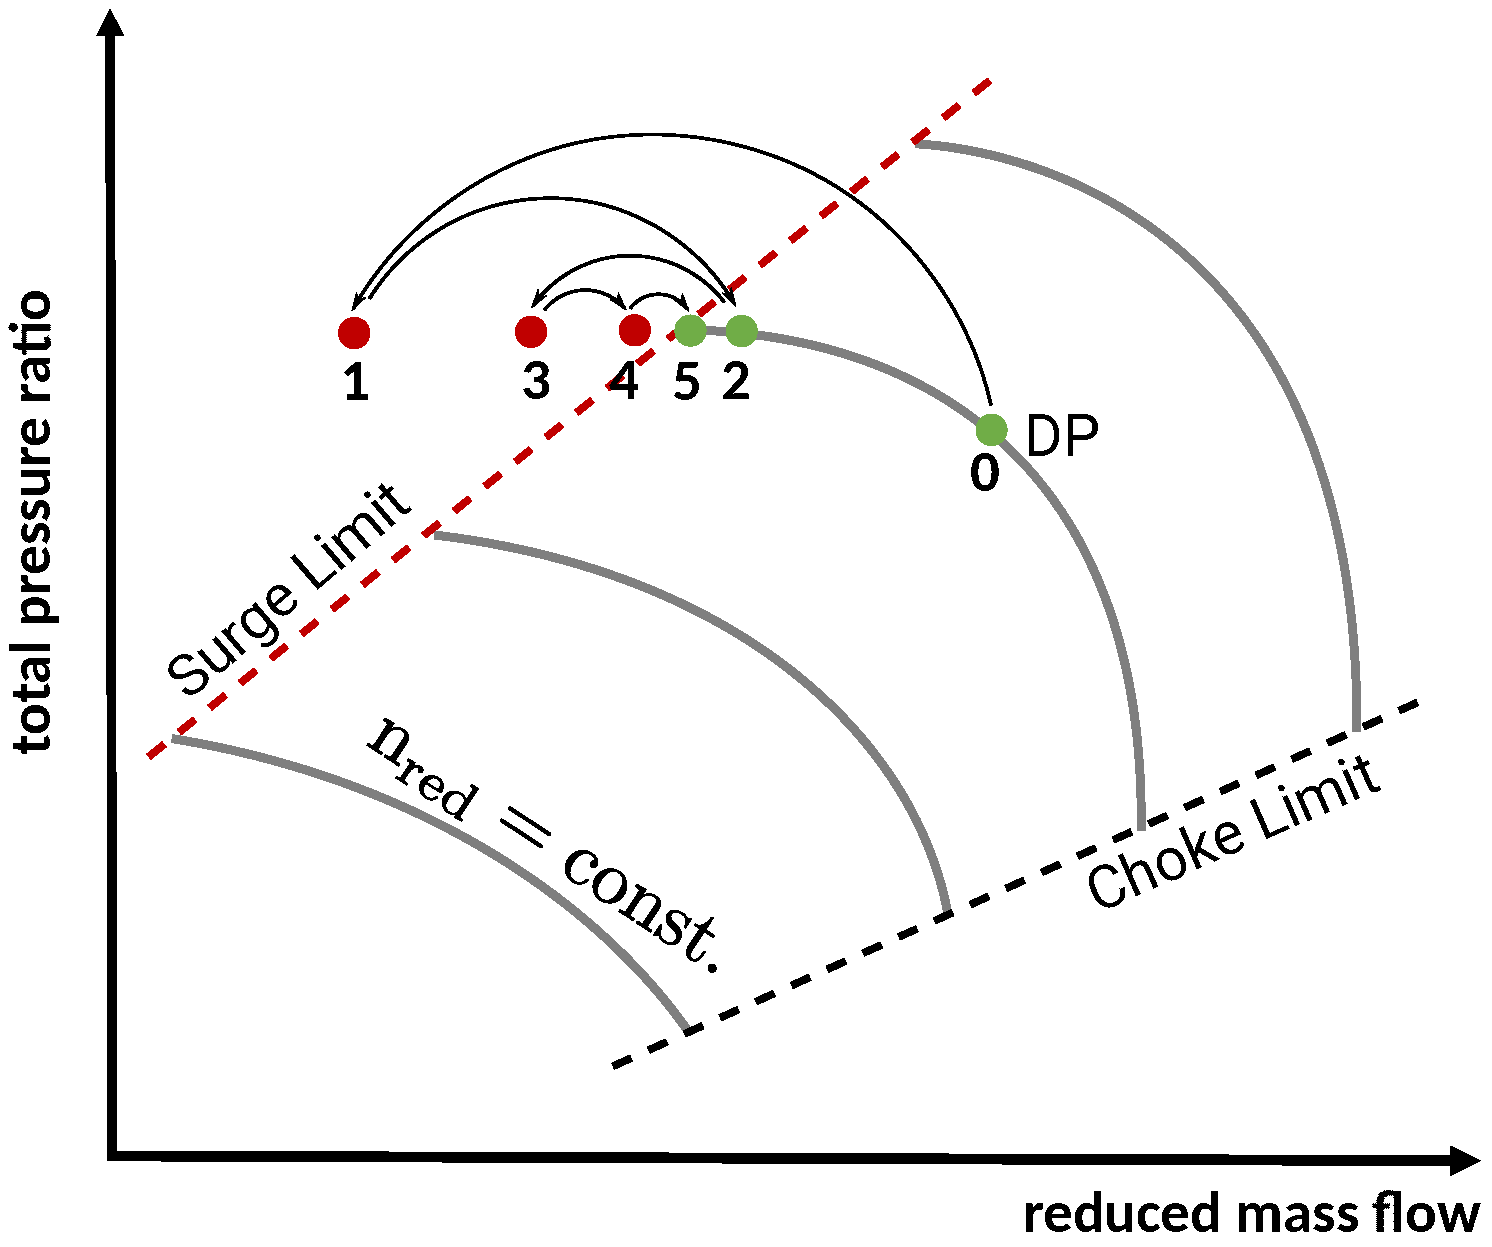
5. Iterative Surge Limit Determination
Figure 6 shows the procedure of the numeric, iterative surge limit determination. Six operating points (
) were considered. For Operating Points 1 to 5, Operating Point 0 was used as the initial solution.
The bisection algorithm proceeds as follows:
Calculation of the operating point .
Check convergence of operating point .
Dependent on the convergence of operating point
, calculation of operating point
with:
with
.
Check convergence, and proceed with in Step 3.
This procedure eventually yielded an accuracy of between the last two calculated operating points. Convergence was checked for the last 50 iterations on the basis of mass flow error and the standard deviation of total pressure ratio and efficiency. Convergence was obtained if the following criteria were fulfilled after a maximum number of 600 iterations.
The authors are well aware that the numerical determination of the surge margin was more than critical and that an absolute prediction of the surge mass flow with steady RANS calculations was likely impossible. However, a relative comparison between the considered designs was valid. To paraphrase, if a certain design at a certain mass flow still converged, the flow did not have a major unsteady character. However, if another design did not converge at that certain mass flow, it was assumed that in an experiment, the flow of that design became unsteady earlier and therefore had a smaller surge margin.
6. Experimental Validation of the Predicted Performance
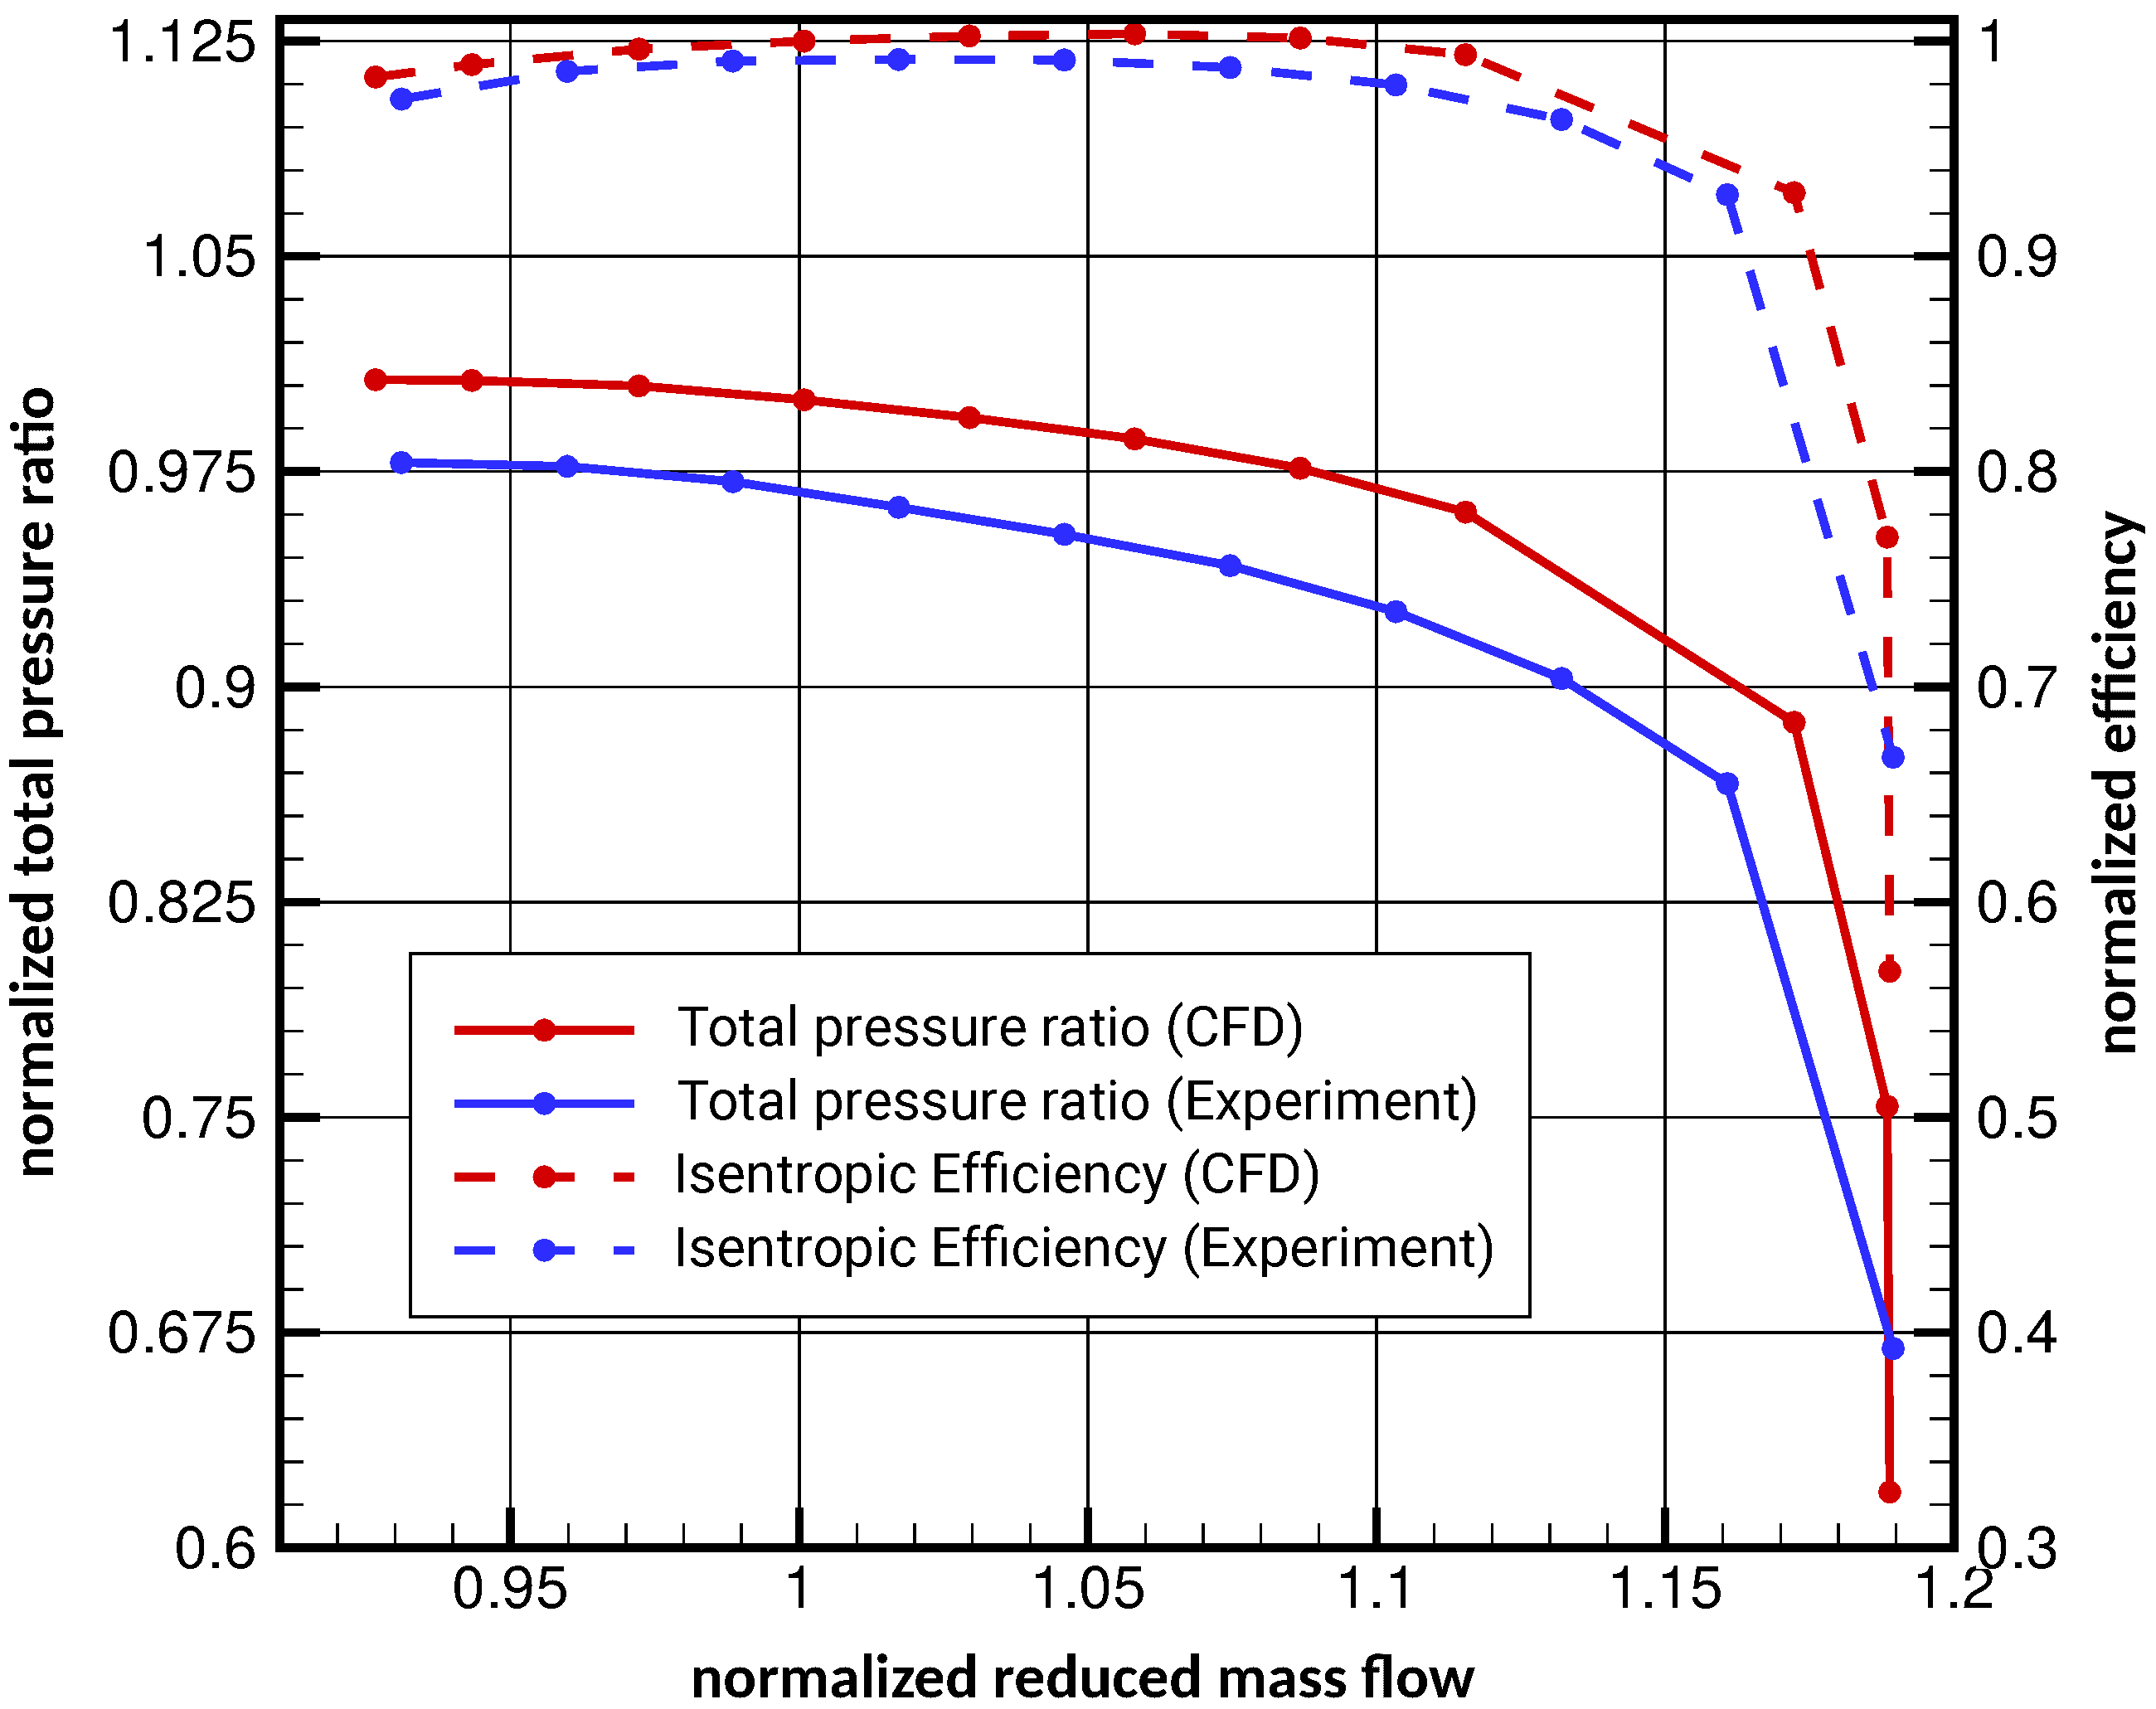
Figure 7 shows the comparison between the experimental and the numerical data of the total pressure ratio and isentropic efficiency. The experimental data were provided by the MTU Friedrichshafen GmbH. All values were normalized with the respective value taken from the design point (CFD). The choke mass flow and the qualitative trend were in good agreement with the experimental data. One has to keep in mind that the numerical investigation was done without volute, which explains the higher predicted total pressure ratio and efficiency, as losses in the volute were neglected.
Since only the shown speed line was considered within this paper, the overall comparison indicated that the chosen mesh and the numerical settings were suitable for the numerical evaluation of the surge margin and the subsequently presented flow parameters.
7. Local Flow Parameters
The evaluated flow parameters (FP) can be grouped into physical values based on the non-uniformity of the impeller outlet flow, the impeller and diffuser back flow, the boundary layer thickness, and the isentropic Mach number distribution. It turned out that the parameters defined with the help of the Mach number distribution were the most promising, and therefore, the other values were not considered in detail at this point.
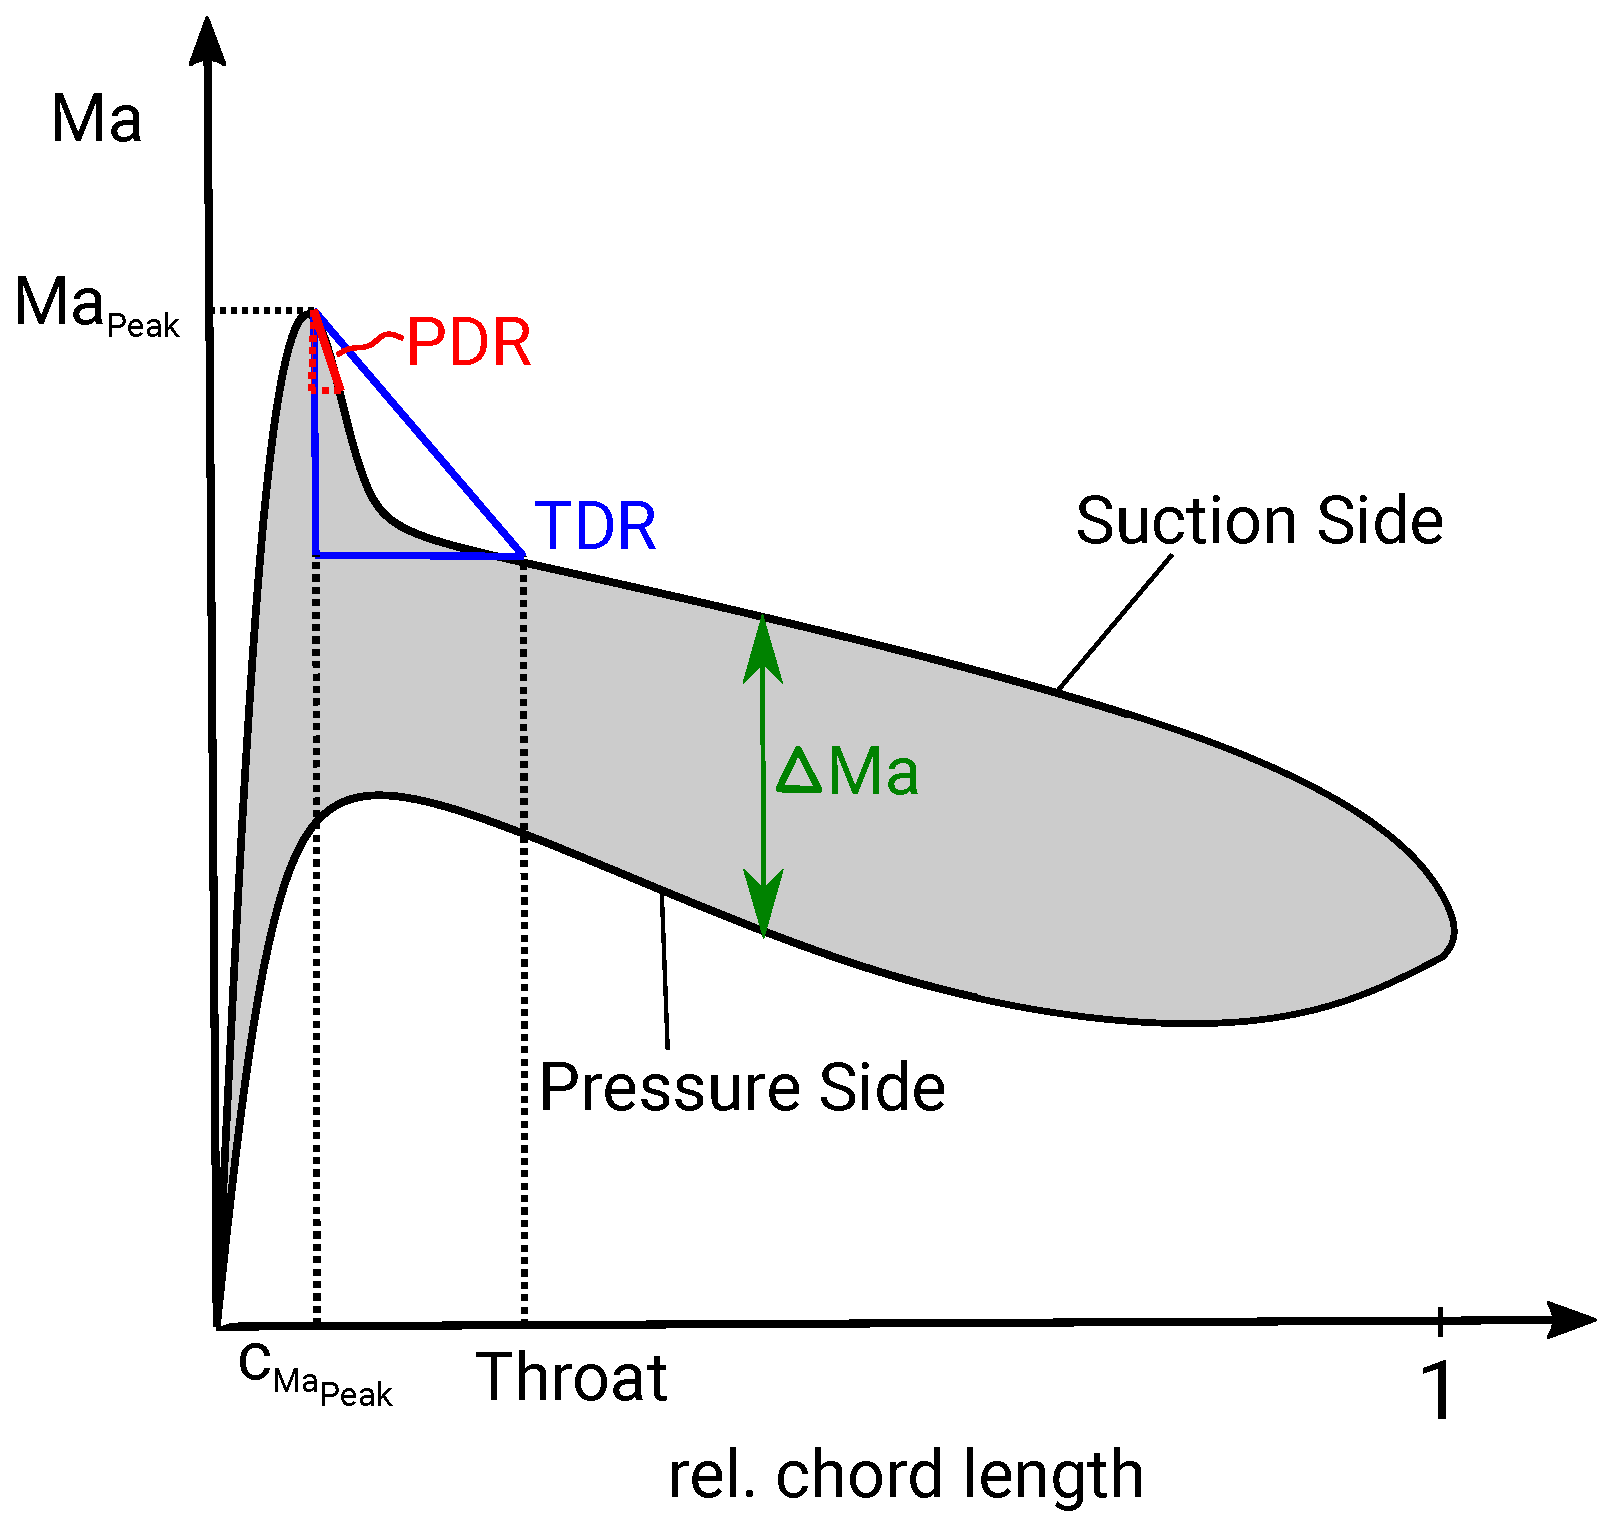
Figure 8 shows the characteristic isentropic Mach number distribution on an arbitrary blade surface. Based on this distribution,
,
,
,
, and
were defined.
and
denote the magnitude and chord position of the Mach number peak on the suction side, respectively. The peak deceleration ratio (
) denotes the slope of the Mach number curve directly after the Mach number peak. The throat deceleration ratio
expresses the flow deceleration from the
value to the Mach number at the throat.
denotes the maximum difference between the Mach number at suction and pressure side. All values were evaluated at 10%, 50%, and 90% blade span.
8. Correlations
The evaluation of the flow parameters shown in the last section, concerning their potential for correlating with the surge margin, was done via Spearman’s rank correlation coefficient:
wherein
x and
y are random variables,
denotes the rank of a variable,
is the standard deviation, and
the covariance. The advantage of Spearman’s rank correlation coefficient is the ability to assess correlations independently of the underlying relation between
x and
y. Hence, as long as the relation between
x and
y is monotonically increasing or decreasing,
indicates a high correlation. It does not matter if the relation is linear, quadratic, or anything else.
takes values between −1 and one, whereby −1 and one indicate a pure monotonically decreasing or increasing relation between the two variables, respectively. Zero indicates no relation at all, and everything in between indicates a more or less strong monotonic relation. To decide if the correlation between two variables is significant, the T-test was used. For the 73 designs, the T-test revealed that for 0.3 and −0.3, the correlation between two variables had 99.5% significance.
Table 2 lists the correlations between the selected flow parameters and the iteratively determined surge mass flow (
). The considered flow parameters were expressed through the sum of the respective flow parameter at all three span positions (10%, 50%, and 90%) in the impeller and diffuser (cf. Equation (
6)). The TDR showed with
the highest correlation and therefore was used for the formulation of the new objective function. Funabashi et al. [
10] reported that a high deceleration between LE and the throat, which corresponded to a low TDR, caused an increased boundary layer thickness, which was more likely to separate and therefore led to surge.
9. New Objective Function
Equation (
6) shows the new objective function based on the TDR.
denotes the values of the basis design. As the correlation is negative and the surge mass flow shall be minimized, the objective of the optimization is to maximize TDR.
10. Optimization Example
For the validation of the new objective function, two optimizations were carried out. One was with the classic objective function
(Equation (
3)), referred to as SM-Optimization, and another one with the new objective function TDR (Equation (
6)), referred to as TDR-Optimization. Both optimizations had the aim to increase the surge margin by nearly constant efficiency at the design point. During the optimization, only the design speed was considered.
Table 3 shows the operating points and constraints used in the optimizations. For the SM-Optimization, an additional highly throttled operating point was needed to evaluate
, which was chosen to be 94% of
and corresponded to the surge mass flow of the basis design. For the TDR-Optimization, only the design point was needed to evaluate the objective function, which saved one computation for each design iteration.
Both optimizations were started with the same DOE database of 255 designs, created by a ULH algorithm. Then, the optimizations were run using a genetic algorithm combined with meta surfaces for faster convergence. The last optimization iterations were executed by combining a genetic and a gradient based algorithm. In addition to the DOE database, 210 designs were evaluated during the optimization runs, whereof the TDR-Optimization resulted in 100 and the SM-Optimization in 57 valid designs. From each optimization, the best design regarding the objective function and efficiency was chosen for comparison.
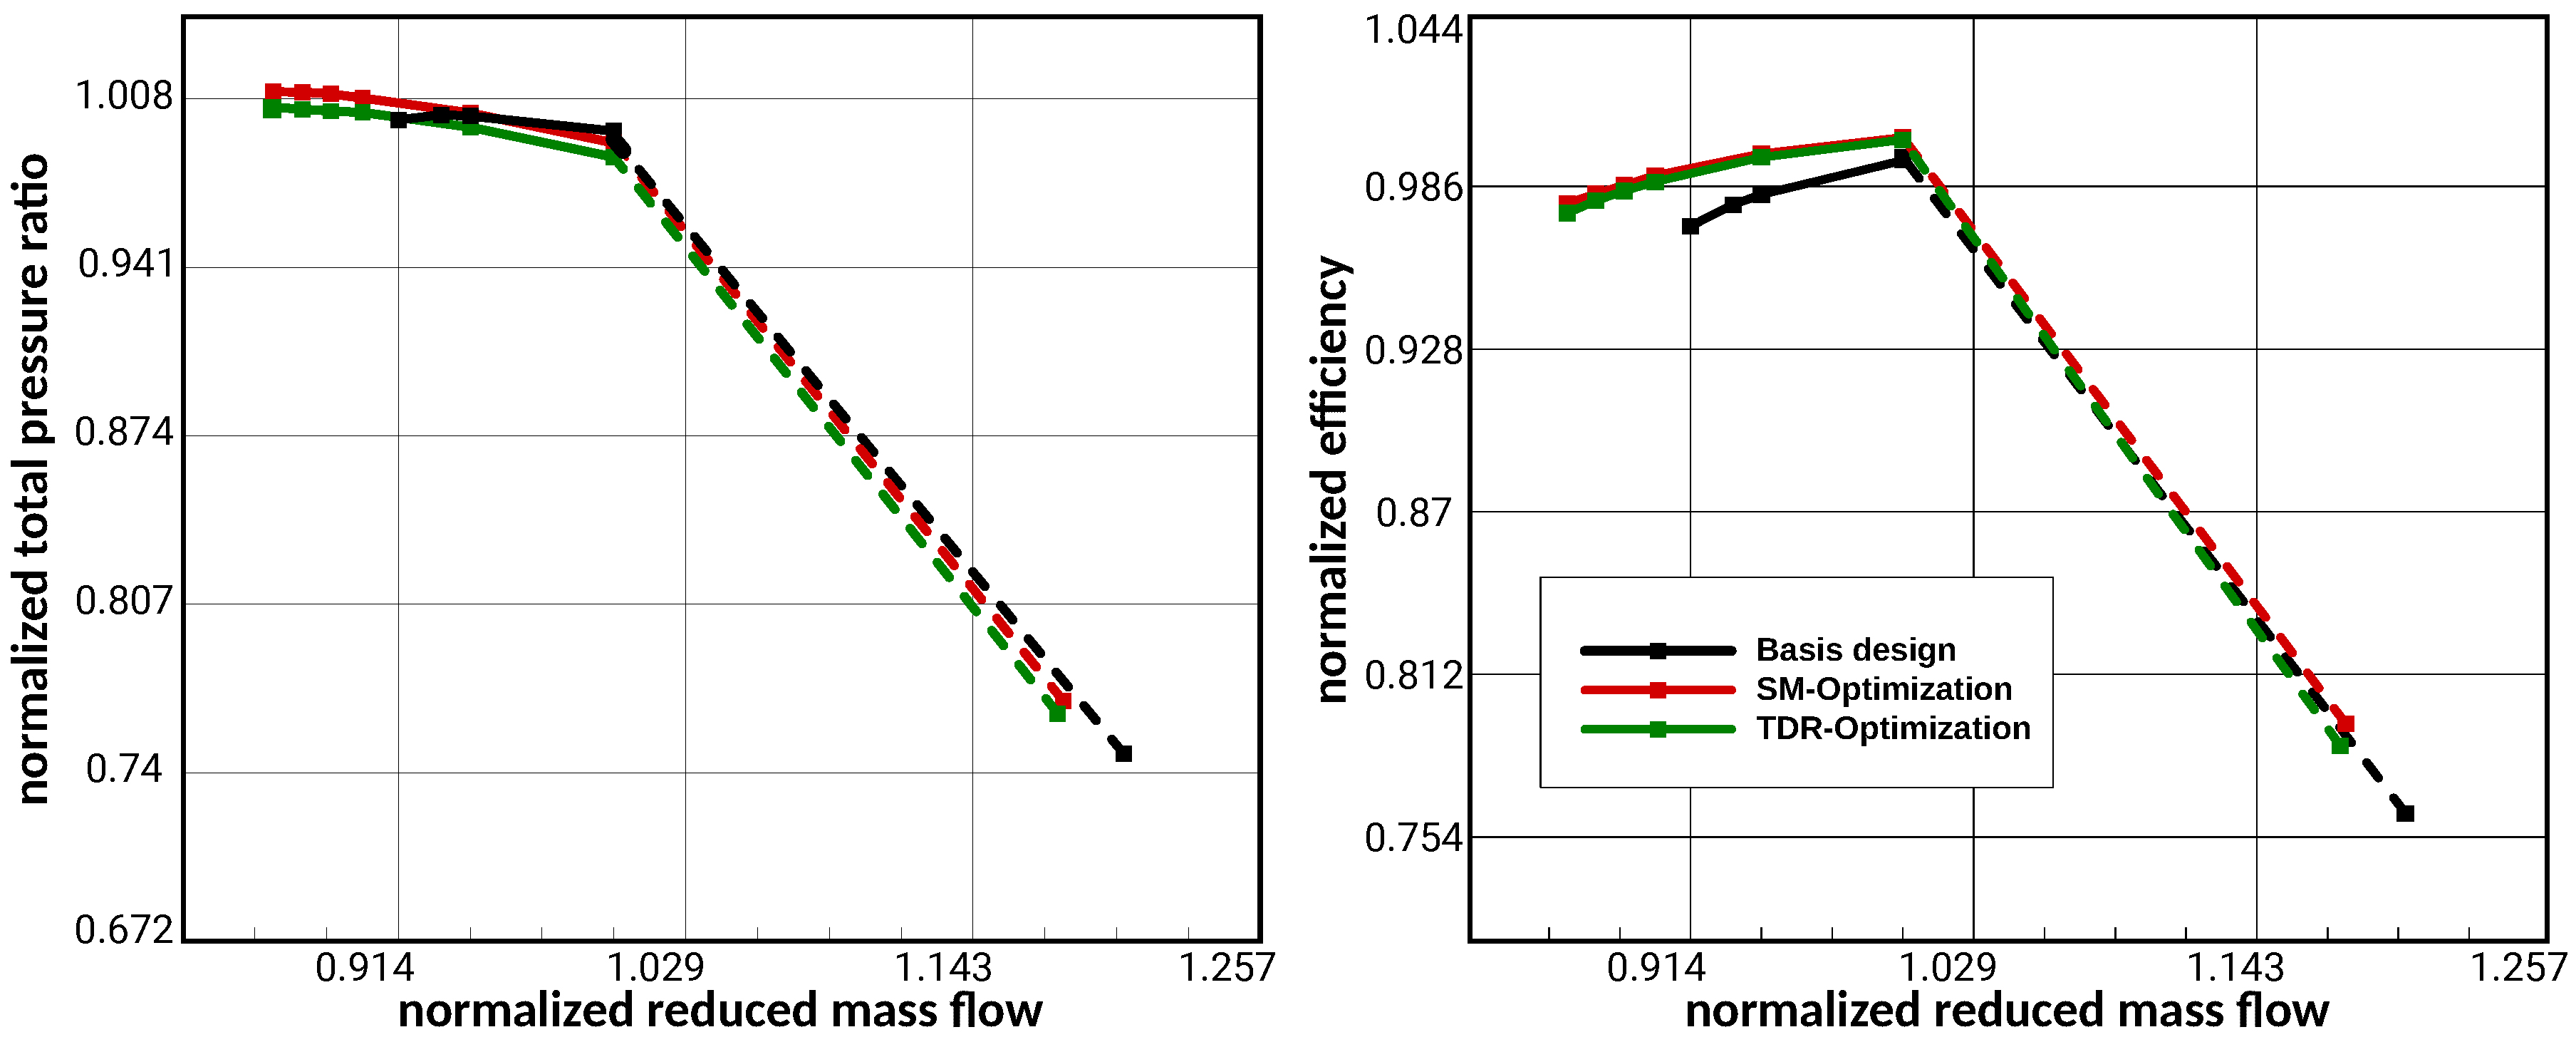
Figure 9 shows the performance map (total pressure ratio and efficiency (total-total)) for the optimized designs and the basis design. Both optimizations resulted in a very similar output. The efficiency was slightly increased by 0.64 (TDR) and 0.71 (SM) percentage points and the surge margin
by five percentage points. It has to be mentioned that due to the chosen constraints, the speed line was shifted to a slightly smaller mass flow. However, still, the total width of the speed line
was increased by 2.5 percentage points.
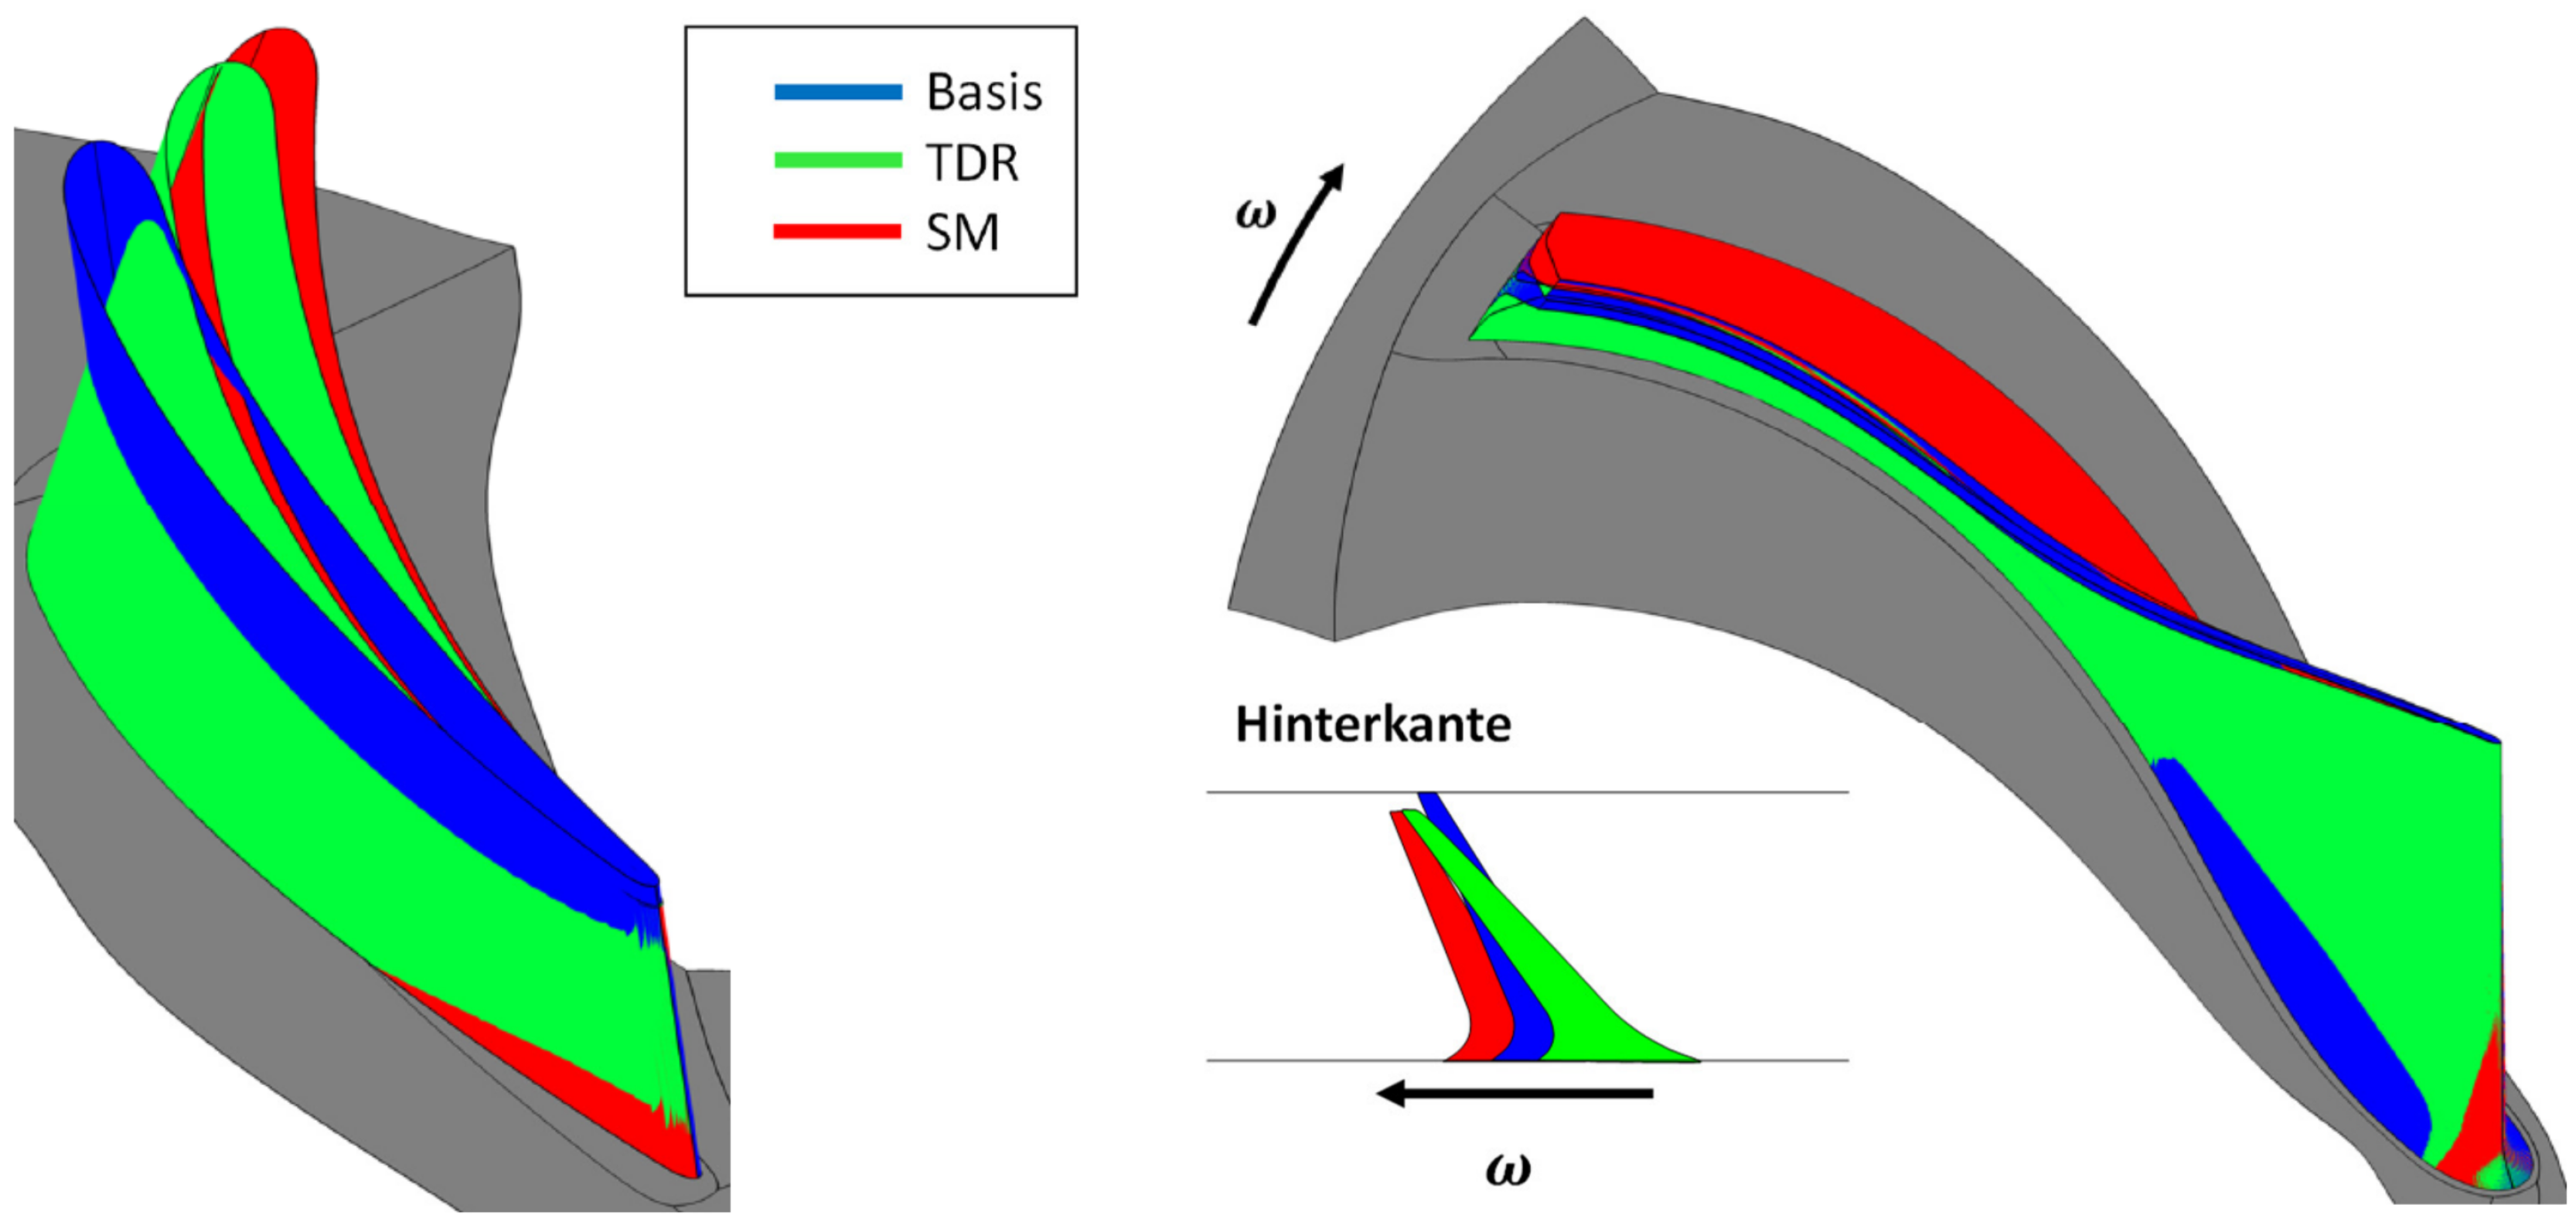
Figure 10 compares the original impeller and diffuser blade design with the final blade shape of both optimizations. Regarding the impeller (right side), the optimization mainly led to an increase of the rake angle, which in turn led to a redistribution of the impeller outflow. More precisely, due to the higher rake angle, the impeller outflow between the hub and 70% span was more radially directed compared to the original impeller. Regarding the diffuser (left side), both optimized blades were more twisted compared to the original diffuser. The higher twist led to a better adaptation to the different impeller outflow angles at the hub and shroud.
Besides, at least one third of the computation time was saved as no surge point needed to be considered, the TDR-Optimization revealed two further benefits. First, the TDR-Optimization contained almost twice as many valid designs as the SM-Optimization. The larger number of “error” designs in the SM-Optimization was due to the non-convergence of many designs at the operating point . Even though those designs were considerably bad in terms of surge margin, the optimizer’s database was increased by every new valid design, though the optimization converged faster.
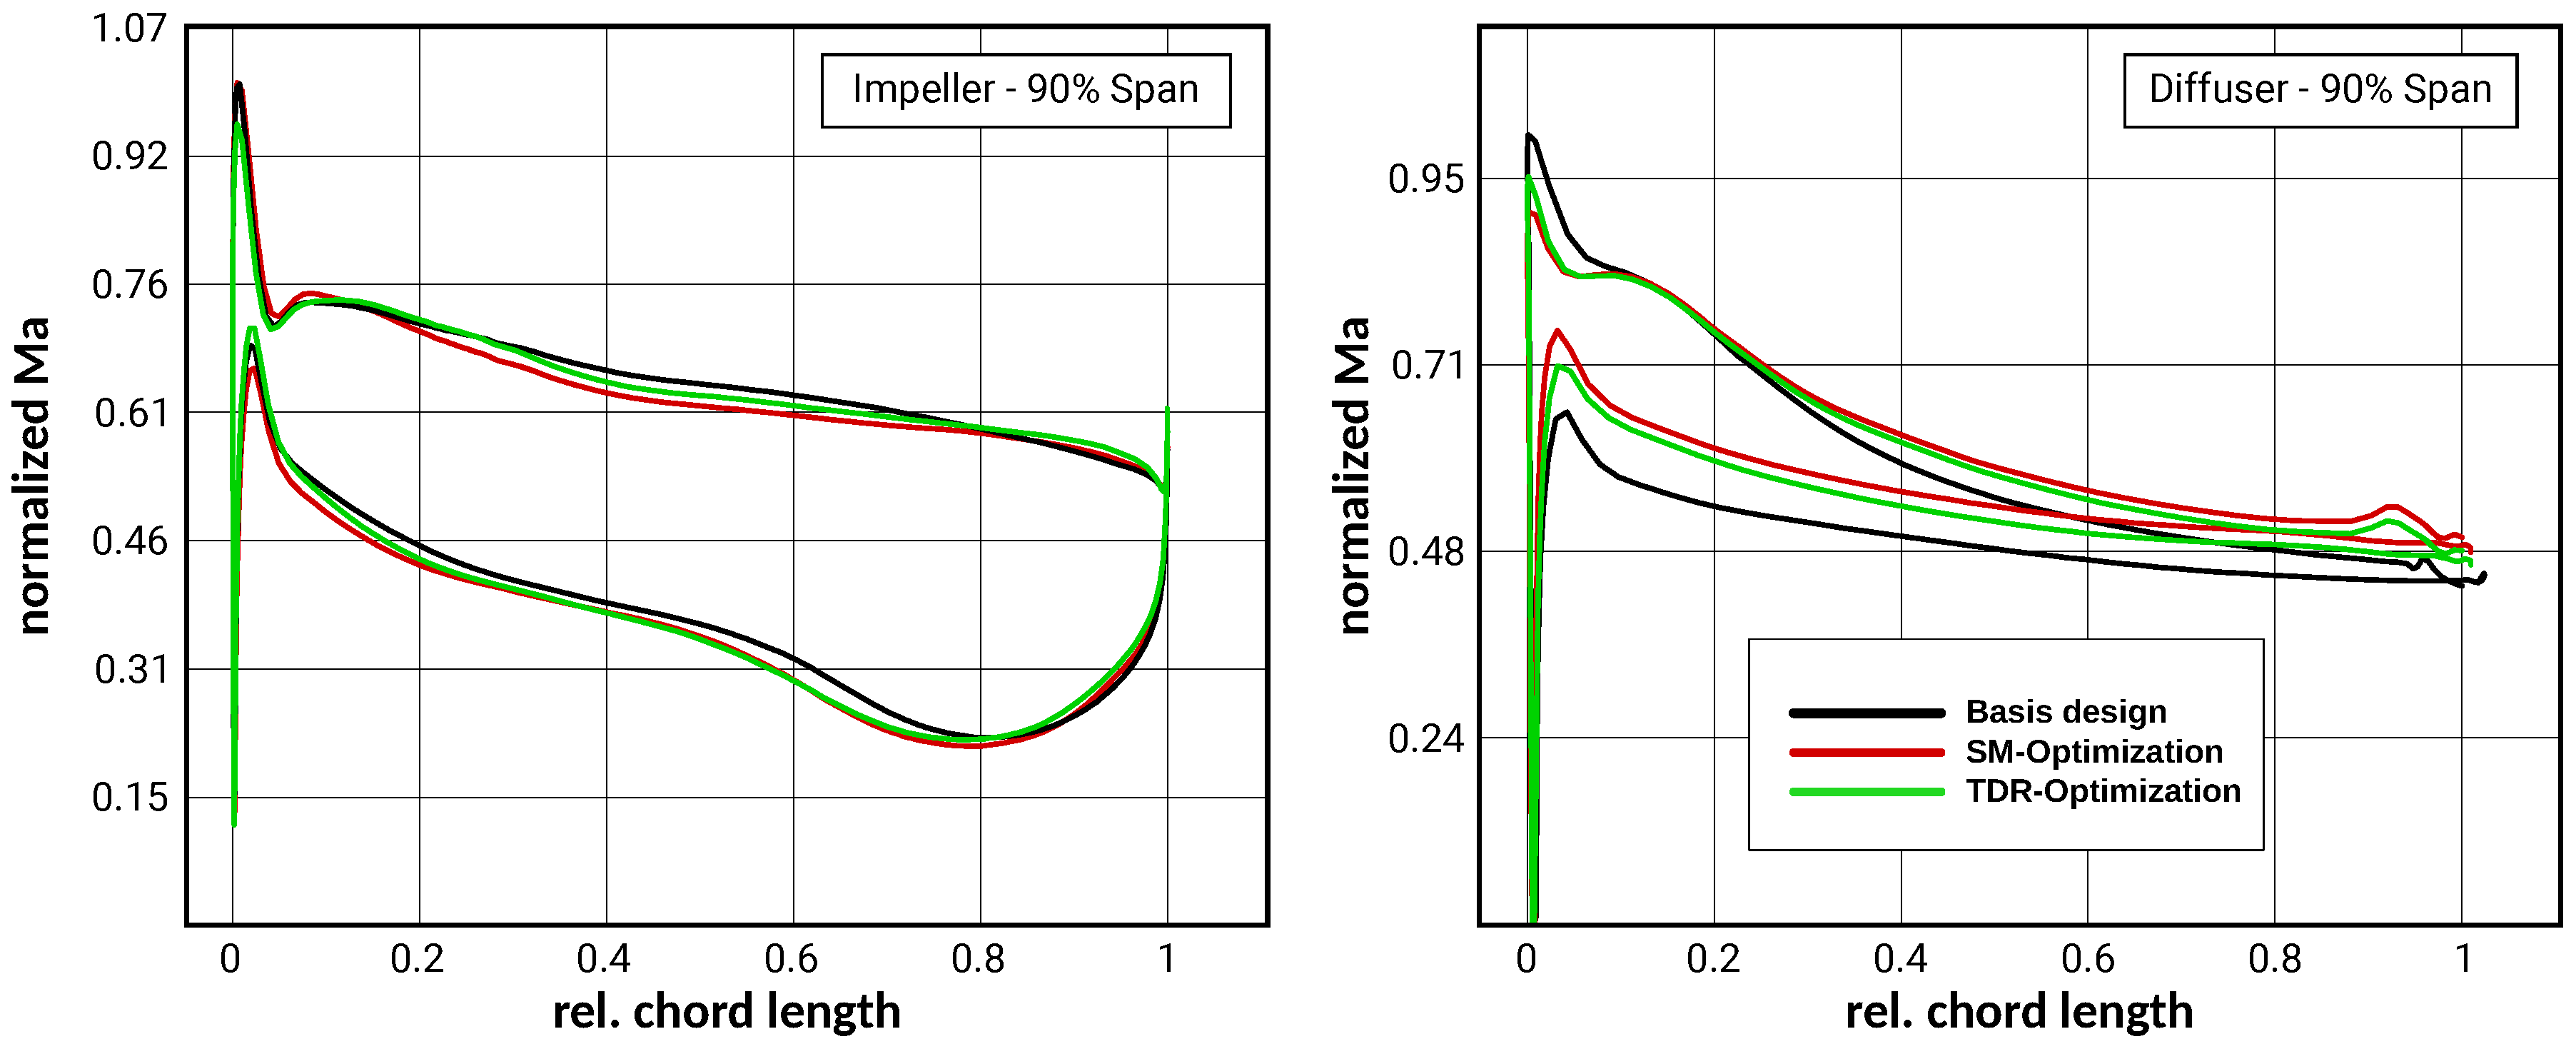
Second, the TDR-Optimization considered both the impeller and the diffuser design regarding the surge margin. For illustration,
Figure 11 shows the Mach number distribution for the impeller and diffuser at 90% span at the DP.
Table 4 lists the percentage change of the TDRs compared to the basis design for the impeller and diffuser. Considering the impeller and diffuser, the TDR (cf. Equation (
6)) was increased in both optimizations. However, considering the single components, in the SM-Optimization, only the diffuser was improved in terms of surge margin, whereas the impeller declined. This was due to the fact that the basis design and both optimized designs hit the surge limit due to stall in the diffuser. Hence, while trying to increase the surge margin, the SM-Optimization tried to improve the diffuser as only integral information between the impeller inlet and diffuser outlet was available. Let us assume that during an optimization, the critical component changes. For example, the diffuser had such a good shape that now the impeller was responsible for surge. Then, the TDR-Optimization clearly had the advantage over the SM-Optimization as the impeller already was improved in terms of the surge margin.
11. Conclusions
Seventy-three centrifugal compressor designs were generated by means of a variation of the beta angle distribution and the diffuser width. For all 73 design variations, several local flow parameters present at the design point were correlated with the respective iteratively determined surge margin of the design. Values based on the isentropic Mach number distribution showed the highest correlation with the surge margin. Therefore, the so-called TDR , which represents the flow deceleration from the value near the LE to the Mach number at the throat, was defined as the new objective function.
For validation of the new objective function, two optimizations were carried out. One optimization was with the new objective function TDR and another one with a classic objective function using two operating points for surge margin estimation. Both optimizations led to a similar result regarding the surge margin and efficiency. However, the optimization with the TDR showed several advantages. First, as no operating point near surge needed to be considered, the optimization time was at least reduced by one third. Second, the TDR optimization led to more valid designs, whereby the optimizer learned faster. Third, as not only integral values between the inlet and outlet were considered, the TDR-Optimization improved the impeller and diffuser regarding the surge margin at the same time.
In conclusion, it can be stated that the approach using local flow parameters was suited for surge margin optimization and even had advantages compared to the classic objective function using two operation points for surge margin estimation.
Author Contributions
Conceptualization, J.R. and F.F.; data curation, M.B.; funding acquisition, S.L. and H.-P.S.; investigation, J.R.; methodology, J.R.; project administration, J.R.; supervision, S.L. and H.-P.S.; visualization, J.R.; writing, original draft, J.R.; writing, review and editing, S.L., H.-P.S., and F.F.
Funding
The authors acknowledge the financial support by the Federal Ministry for Economic Affairs and Energy of Germany (BMWi) in the project GAMMA (Project Number 03ET1469). The APC of this paper was funded by Euroturbo.
Acknowledgments
Calculations for this research were conducted on the Lichtenberg high performance computer of the TU Darmstadt. Moreover, we give thanks to Friendship Systems AG and the NUMECA Ingenieurbüro for the great support regarding parametrization and CFD. Last but not least, we want to thank MTU Friedrichshafen GmbH for providing the geometries and the permission to publish the results.
Conflicts of Interest
The authors declare no conflicts of interest.
Nomenclature
| Latin | |
| Chord length |
| Covariance |
| Diameter |
| i | operating point |
| Normalized arc length |
| Mass flow |
| Mach number |
| Rank |
| Abbreviations | |
| BC | Boundary condition |
| CFD | Computational fluid dynamics |
| DOE | Design of experiments |
| FP | Flow parameter |
| OP | Operating point |
| PDR | Peak deceleration ratio |
| SF | Slope factor |
| SM | Stall margin |
| TDR | Throat deceleration ratio |
| ULH | Uniform Latin hypercube |
| Greek | |
| Blade angle |
| Efficiency |
| Total pressure ratio |
| Angular coordinate |
| Subscripts | |
| DP | Design point |
| LE | Leading edge |
| Surge | Surge point |
| TE | Trailing edge |
References
- Moore, D.; Reid, L. Performance of Single-Stage Axial-Flow Transonic Compressor with Rotor and Stator Aspect Ratios of 1.19 and 1.26, Respectively, and with Design Pressure Ratio of 2.05; NASA Technical Paper 1659; Lewis Research Center: Cleveland, Ohio, USA, 1980. [Google Scholar]
- Cumpsty, N.A. Compressor Aerodynamics, Reprinted 1998 ed.; Krieger Publishing: Malabar, FL, USA, 2004. [Google Scholar]
- Sundström, E.; Semlitsch, B.; Mihaescu, M. Generation Mechanisms of Rotating Stall and Surge in Centrifugal Compressors. Flow Turbul. Combust. 2018, 100, 705–719. [Google Scholar] [CrossRef] [PubMed] [Green Version]
- Goinis, G. Optimierung von transsonischen Verdichterstufen mit Gehäuseeinbauten. 2013. Available online: https://elib.dlr.de/85555/ (accessed on 17 December 2019).
- Kim, J.H.; Choi, K.J.; Kim, K.Y. Aerodynamic analysis and optimization of a transonic axial compressor with casing grooves to improve operating stability. Aerosp. Sci. Technol. 2013, 29, 81–91. [Google Scholar] [CrossRef]
- Van den Braembussche, R.A. Optimization of Radial Impeller Geometry; Educational Notes; von Karman Institute for Fluid Dynamics: Sint-Genesius-Rode, Belgium, 2006. [Google Scholar]
- Hiradate, K.; Kanno, T.; Nishida, H.; Shinkawa, Y.; Joukou, S. Improvement in Efficiency and Operating Range of Centrifugal Blower Stage for Sewage Aeration Blower. Int. J. Fluid Mach. Syst. 2010, 3, 379–385. [Google Scholar] [CrossRef]
- Miller, P.L.; Oliver, J.H.; Miller, D.P.; Tweedt, D.L. BladeCAD: An Interactive Geometric Design Tool for Turbomachinery Blades. In Proceedings of the 41st Gas Turbine and Aeroengine Congress, Birmingham, UK, 10–13 June 1996. [Google Scholar]
- Celik, I.B.; Ghia, U.; Roache, P.J.; Freitas, C.J.; Coleman, H.; Raad, P.E. Procedure for Estimation and Reporting of Uncertainty Due to Discretization in CFD Applications. J. Fluids Eng. 2008, 130, 078001. [Google Scholar]
- Funabashi, S.; Iwase, T.; Hiradate, K.; Fukaya, M. Platform Technology for Computational Fluid Dynamics Supporting Design of System Products. Hitachi Rev. 2012, 61, 244. [Google Scholar]
© 2019 by the authors. Licensee MDPI, Basel, Switzerland. This article is an open access article distributed under the terms and conditions of the Creative Commons Attribution (CC BY-NC-ND) license (https://creativecommons.org/licenses/by-nc-nd/4.0/).

 ,
, 


