Article

Enhancement of Corrosion Resistance and Microbial Protection Analysis of a Rosin Coating with the Incorporation of Leucaena leucocephala

by
Wan Mohamad Ikhmal Wan Mohamad Kamaruzzaman
1,2,
Maria Fazira Mohd Fekeri
1,2,
Muhamad Syaizwadi Shaifudin
1,
Wan Rafizah Wan Abdullah
2,3,
Wan Mohd Norsani Wan Nik
2,3,
Mohammad Fakhratul Ridwan Zulkifli
2,3 and
Mohd Sabri Mohd Ghazali
1,2,*
1
Advanced Nano Materials (ANoMa) Research Group, Faculty of Science and Marine Environment, Universiti Malaysia Terengganu, Kuala Nerus 21030, Terengganu, Malaysia
2
Materials and Corrosion Research Group, Universiti Malaysia Terengganu, Kuala Nerus 21030, Terengganu, Malaysia
3
Faculty of Ocean Engineering Technology and Informatics, Universiti Malaysia Terengganu, Kuala Nerus 21030, Terengganu, Malaysia
*
Author to whom correspondence should be addressed.
Coatings 2020, 10(9), 825; https://doi.org/10.3390/coatings10090825
Submission received: 13 July 2020 / Revised: 12 August 2020 / Accepted: 14 August 2020 / Published: 26 August 2020
(This article belongs to the Section Corrosion, Wear and Erosion)

Abstract

:
Leucaena leucocephala leaves extract (LLE) was incorporated as an additive in a new coating formulation. The coatings containing different wt.% of the extracts were analysed by optical characterizations and we proceeded to the antimicrobial assessment. The coating was applied onto the surface of stainless steel grade 316L and immersed in seawater for 50 days. A batch of specimens was collected every 10 days and evaluated through electrochemical impedance spectroscopy (EIS), potentiodynamic polarization and scanning electron microscope with energy dispersive X-ray (SEM/EDX). The incorporation of 3 wt.% LLE into the coating (P2) matrix remarkably boosted the barrier quality of the coating.

1. Introduction

Corrosion is a critical issue faced by the marine industry globally [1]. Even when the metal structure in such an environment is protected by a coating, the substrates are still prone to corrosion through the degradation process as illustrated in Figure 1. The mechanism of degradation can be accelerated by environmental factors such as the salinity and aggressive attachment of microorganisms [2,3,4]. In the marine environment, the salt content of seawater increases the conductivity of the solution, causing an increase in the electron transfer in the redox reaction. The changes generate a higher distribution of electrons to the reduction site and enhance the degradation progress [5]. Moreover, with the presence of the microorganism in the medium, biofilm is formed as soon as the substrate is exposed to seawater. As the microorganism start to multiply, the accumulated microorganism will begin to perform its metabolic reaction and produced the extracellular polymeric substance (EPS) that can form complexes and penetrate the coating layer and metal [6,7]. The rate of penetration depends on the barrier quality of the coating, but for most organic coating, the result of coating being completely detached is usually inevitable. In this research, two microbiologically influenced corrosion (MIC) bacteria were selected from the both Gram-positive and Gram-negative class, which were Staphylococcus aureus (+) and Pseudomonas aeruginosa (−), respectively [8,9,10].
This study aimed to develop a highly efficient organic coating using the plant extract of Leucaena leucocephala or river tamarind as the additive. The use of plant extracts as an additive to enhance the corrosion inhibition of a coating is eco-friendly, and its feasibility has been proven by previous studies [11,12]. Interestingly, similar attempts have also been made by other researchers using other plant extract incorporated into the coating, such as Lawsonia inermis, Solanum tuberosum, and olive leaves [13,14,15]. They found that the incorporation of natural resources into the coating resulted in a higher adhesion ability and an increase in corrosion resistance when exposed to a harsh medium. However, all of the studies also shared a common conclusion where the usage of the plant extract has its limitation. When incorporated into the coating, the increase in natural extract concentration will enhance the barrier properties until a certain value, and beyond this value, the efficiency of coating tends to fall drastically. In some cases, the value can even drop below the original positive control. However, for the coating with an optimum additive concentration, the capabilities are boosted significantly. The phenomenon can be attributed to the presence of heteroatoms with lone pair electrons in the molecular structure of the compounds in the additive [16]. Moreover, a theory has also pointed out that the long carbon chain of the compounds of the extract can be intertwined with the fatty acids of the binder as a way to increase its overall strength [17]. The findings on the enhancement ability of plant extract are believed to play a vital role in future applications in the coating industry.
Leucaena leucocephala originates from Central America and Mexico. It is a famous plant due to its properties of high antioxidation, antimicrobial, anticancer, and anti-inflammatory [18]. To date, various analyses to determine the constituents of the plant have been performed. An analysis done by Malaysian researchers detected the presence of 30 compounds, with the major components including squalene and phytol [19]. Another study, on the other hand, also pointed out similar compounds in terms of the molecular structure such as catechol, quercetin and gallic acid [20,21]. The comparable findings were linked to similar identifiable functional groups such as phenolics, carbonyl, and alkene. The recent usage of this plant in the field of corrosion study was performed in 2013, where the researchers employed the pods as an inhibitor in H2SO4 solution [22]. However, concerning the leaves part, no study has been conducted for this field to the best of our knowledge.

2. Materials and Methods

2.1. Materials

The stainless steel grade 316L (SS316L) coupons were purchased from CG Tradeware. The nominal composition of the SS316L determined through both X-ray fluorescence (XRF) and carbon analyses method is presented in Table 1 [23]. The steels with a dimension of 25 mm × 25 mm × 3 mm were prepared according to the American Standard Testing Method (ASTM) E3-11 [24], where each was polished with abrasive papers of various grades (240, 600, 800 and 1000) to get a mirror-like finish. The polishing process was performed using Presi Mecapol model P255 U (PRESI, Shah Alam, Malaysia). The polished steels were rinsed with acetone and distilled water before being air-dried and stored in a dry box until used.
Water-white (WW) rosin was provided by Urich Technology (Sungai Petani, Malaysia), and other chemicals including methyl isobutyl ketone (MIBK), calcium carbonate (CaCO3) and zinc oxide (ZnO) powder (micron) were supplied by Chembio Technology Sdn. Bhd. (Seri Kembangan, Malaysia). The dried powder of Leucaena leucocephala was purchased from Secret Barn Sdn. Bhd. (Sungai Petani, Malaysia). All the stated chemicals were used with no further purification.

2.2. Crude Extract Preparation

The dried powder of river tamarind was macerated in 80% ethanol per ratio of 1:10. The conical flask containing the mixture was sealed using parafilm and aluminium foil, before being placed on a shaker for 24 h. The purpose of the maceration process is to separate the active compounds present in the leaves powder from its solid part. Then, the mixture was filtered using a vacuum pump through the Whatman no. 1 filter paper (Sigma-Aldrich, Petaling Jaya, Malaysia). The ethanol solvent was later evaporated using the rotary evaporator, leaving behind an oily crude extract. The collected crude extract was collected inside a vial bottle and stored in a refrigerator (4 °C).

2.3. Coating Formulation and Application

The formulation of coating presented in Table 2 was derived from a previous study with significant modifications [25]. The WW rosin was deployed as the binder component where it provides the overall coating resistance. The production of coating started with the mixing of WW rosin and MIBK, an organic solvent. The mixture was stirred at high speed for 4 h to ensure the coating was well dispersed. Then, the pigments, i.e., ZnO and CaCO3, powders were inserted slowly into the mixture and left to be stirred at 500 rpm for 24 h. When the mixture was confirmed to be homogenous with no presence of coagulant, the Leucaena leucocephala leaves extract (LLE) of different wt.% was incorporated, and the process of stirring was resumed for another 2 h. The final products were directly applied onto the surface of SS316L with a simple brushing technique, following the standard thickness of 90 µm used for marine vessels [26]. The coated samples were dried in an oven for 24 h at a temperature of 52 °C to speed up the curing process. The dried samples were then stored in a desiccator.

2.4. Characterization of Coating

2.4.1. Fourier Transform Infrared (FTIR) Spectroscopy

The examination of WW rosin and coatings with different wt.% LLE under KBr-FTIR was conducted to identify the presence of functional groups. The analysis began by placing freshly produced samples directly onto the sample holder before the characterization procedure. The measurement was performed using a Thermo Nicolet 380 FTIR spectrometer model (Thermo Fisher Scientific, Waltham, MA, USA with the frequency ranging between 500 and 4000 cm−1.

2.4.2. X-ray Diffraction (XRD) Analysis

The XRD evaluation gives an accurate identification of the phases and compositions of the materials used. Through the measurement, changes in the molecular structure of the coatings with and without the addition of LLE can be understood. The materials analysed included ZnO, CaCO3, and coatings with different wt.% LLE after being dried in the oven. The samples were scanned using a Rigaku Miniflex II XRD (Rigaku, Shibuya, Japan) at an angle of 2θ from 2° to 80° with a scanning rate of 2°/min.

2.5. Antimicrobial Assessment Using the Well-Diffusion Method

2.5.1. Materials Preparation

Mueller–Hilton agar (MHA), nutrient agar (NA) and Mueller–Hilton broth (MHB) were prepared through the suspension of the powder with distilled water according to the ratio of 38:1, 28:1 and 21:1, respectively. The corresponding mixtures were autoclaved at 121 °C for 15 min to eliminate all forms of biological agents. MHA was cooled down to 45 °C and directly poured into Petri dishes near to the burning bunsen burner. The experimental procedures were conducted inside the laminar flow cabinet to lower the risk of contamination, which can affect the overall result. The petri dish containing MHA was left for a few minutes until the MHA solidified, and was stored in a chiller before the next process. The purpose of NA was to grow or cultivate the bacteria received from the laboratory. There were two types of bacteria strains grown for the assessment process, which were Staphylococcus aureus (+) and Pseudomonas aeruginosa (−). The process was conducted using the standard cross-streaking method [27]. The petri dishes containing NA with streaked bacteria were placed in an incubator for 20 h at 37 °C.

2.5.2. Antimicrobial Test

The colonies produced on the NA after the incubation process were collected using a sterilized cotton swap and inserted into a test tube containing MHB. The turbidity of the MHB was adjusted using the cultivated bacteria until it became equal to the turbidity of the McFarland 0.5 standard. Then, another sterilized cotton swap was dipped into the MHB and proceeded to be streaked onto the surface of the Petri dishes with MHA. The streaking process was performed for three times at an angle of 60° to the previous streaking step. Wells of the same diameter (6 mm) were punched out of the MHA, where it served to contain the tested samples. The negative control for the analysis was a commercialized antibiotic, gentamicin, and the positive control was the P1, a coating without LLE in its formulation. The plates were incubated for 20 h at 37 °C. Inhibition zones produced from all samples were measured and recorded on the next day for comparison evaluation.

2.6. Immersion Test

The immersion test was carried out to investigate the barrier and resistance properties of the coating when exposed to a harsh environment. The experiment was performed in a coastal area at Setiu, Terengganu for 60 days. Both coated and uncoated SS316L were hung inside a steel cage where each was tied on both ends to ensure the specimens remained firm. A batch of samples was collected after each subsequent 10 days from the site and analysed. The parameters of pH, salinity, and conductivity were measured using Yellow Springs Instrument (YSI) meter (Xylem Analytics, Beverly, MA, USA) during the initial stage of immersion, and the average values with standard deviation are tabulated in Table 3.

2.7. Electrochemical Impedance Spectroscopy (EIS)

The behaviour of coatings toward the aggressive attack of multiple corrosive agents of seawater was inspected using EIS. The method is a common practice for the related study and can be performed using a single-step procedure. The analysis probed the susceptibility of metal to corrosion and also directly examined the amount of electrolytes’ penetration into the coating matrix. It employed simple three-electrode cells, which included the reference electrode (RE) for measuring the potential of the working electrode (WE), as the studied sample, and a counter electrode (CE) for allowing the current to pass through. For the research, the evaluation of the specimens (no replicates) with a surface area of 6.25 cm2 was conducted using the Autolab PGSTAT302N (Metrohm, Herisau, Switzerland), where it was connected to the NOVA software 1.10 (Metrohm, Herisau, Switzerland) for data analysis. The impedance measurement was executed within a range of 10 mHz to 100 kHz with an amplitude of 10 mV (rms). The analysis was performed using two equivalent electric circuits for the bare sample, as shown in Figure 2a, and the coated sample, as shown in Figure 2b [28].

2.8. Potentiodynamic Polarization

The potentiodynamic or Tafel polarization analysis measured the susceptibility of corrosion through the current–voltage (I–V) relation with respect to the properties of the medium. It is a flexible technique where the evaluation can be based on the preferred range of potential. In the study, the potential ranged from −1.0 V to 0.3 V when 1.0 mV∙s−1 of scanning rate was applied. Moreover, the measurement was initiated at the negative overpotential up to the positive potential value when the studied solution was set to be at a stagnant state. To ensure the reading was performed with good accuracy, other parameters including the density (8.03 g/cm3), the surface area (6.25 cm2), and the equivalent weight (25.65 g/mol) of SS316L were also inserted during the measurement process. The data obtained were fitted using the software NOVA 1.10, where the corresponded Tafel plots were acquired.

2.9. Scanning Electron Microscope with Energy Dispersive X-ray (SEM/EDX)

The investigation of the morphological and elemental distribution on the surface of the coated samples was conducted by utilizing a scanning electron microscope (JEOL JSM-6360LA model) (JEOL USA, Peabody, MA, USA) attached to the energy dispersive X-ray (EDX). The collected samples from the site were coated with a thin gold layer using the JFC-1600 Auto Fine Coater prior to the scanning process with the deposition time of 60 s. The additional gold layer helped to enhance the clarity of the images, which is essential for the study. The evaluation was executed using a magnification of ×100 (scale of 100 µm) for the samples which had been immersed for 60 days in seawater.

3. Results and Discussion

3.1. Fourier Transform Infrared Spectroscopy (FTIR)

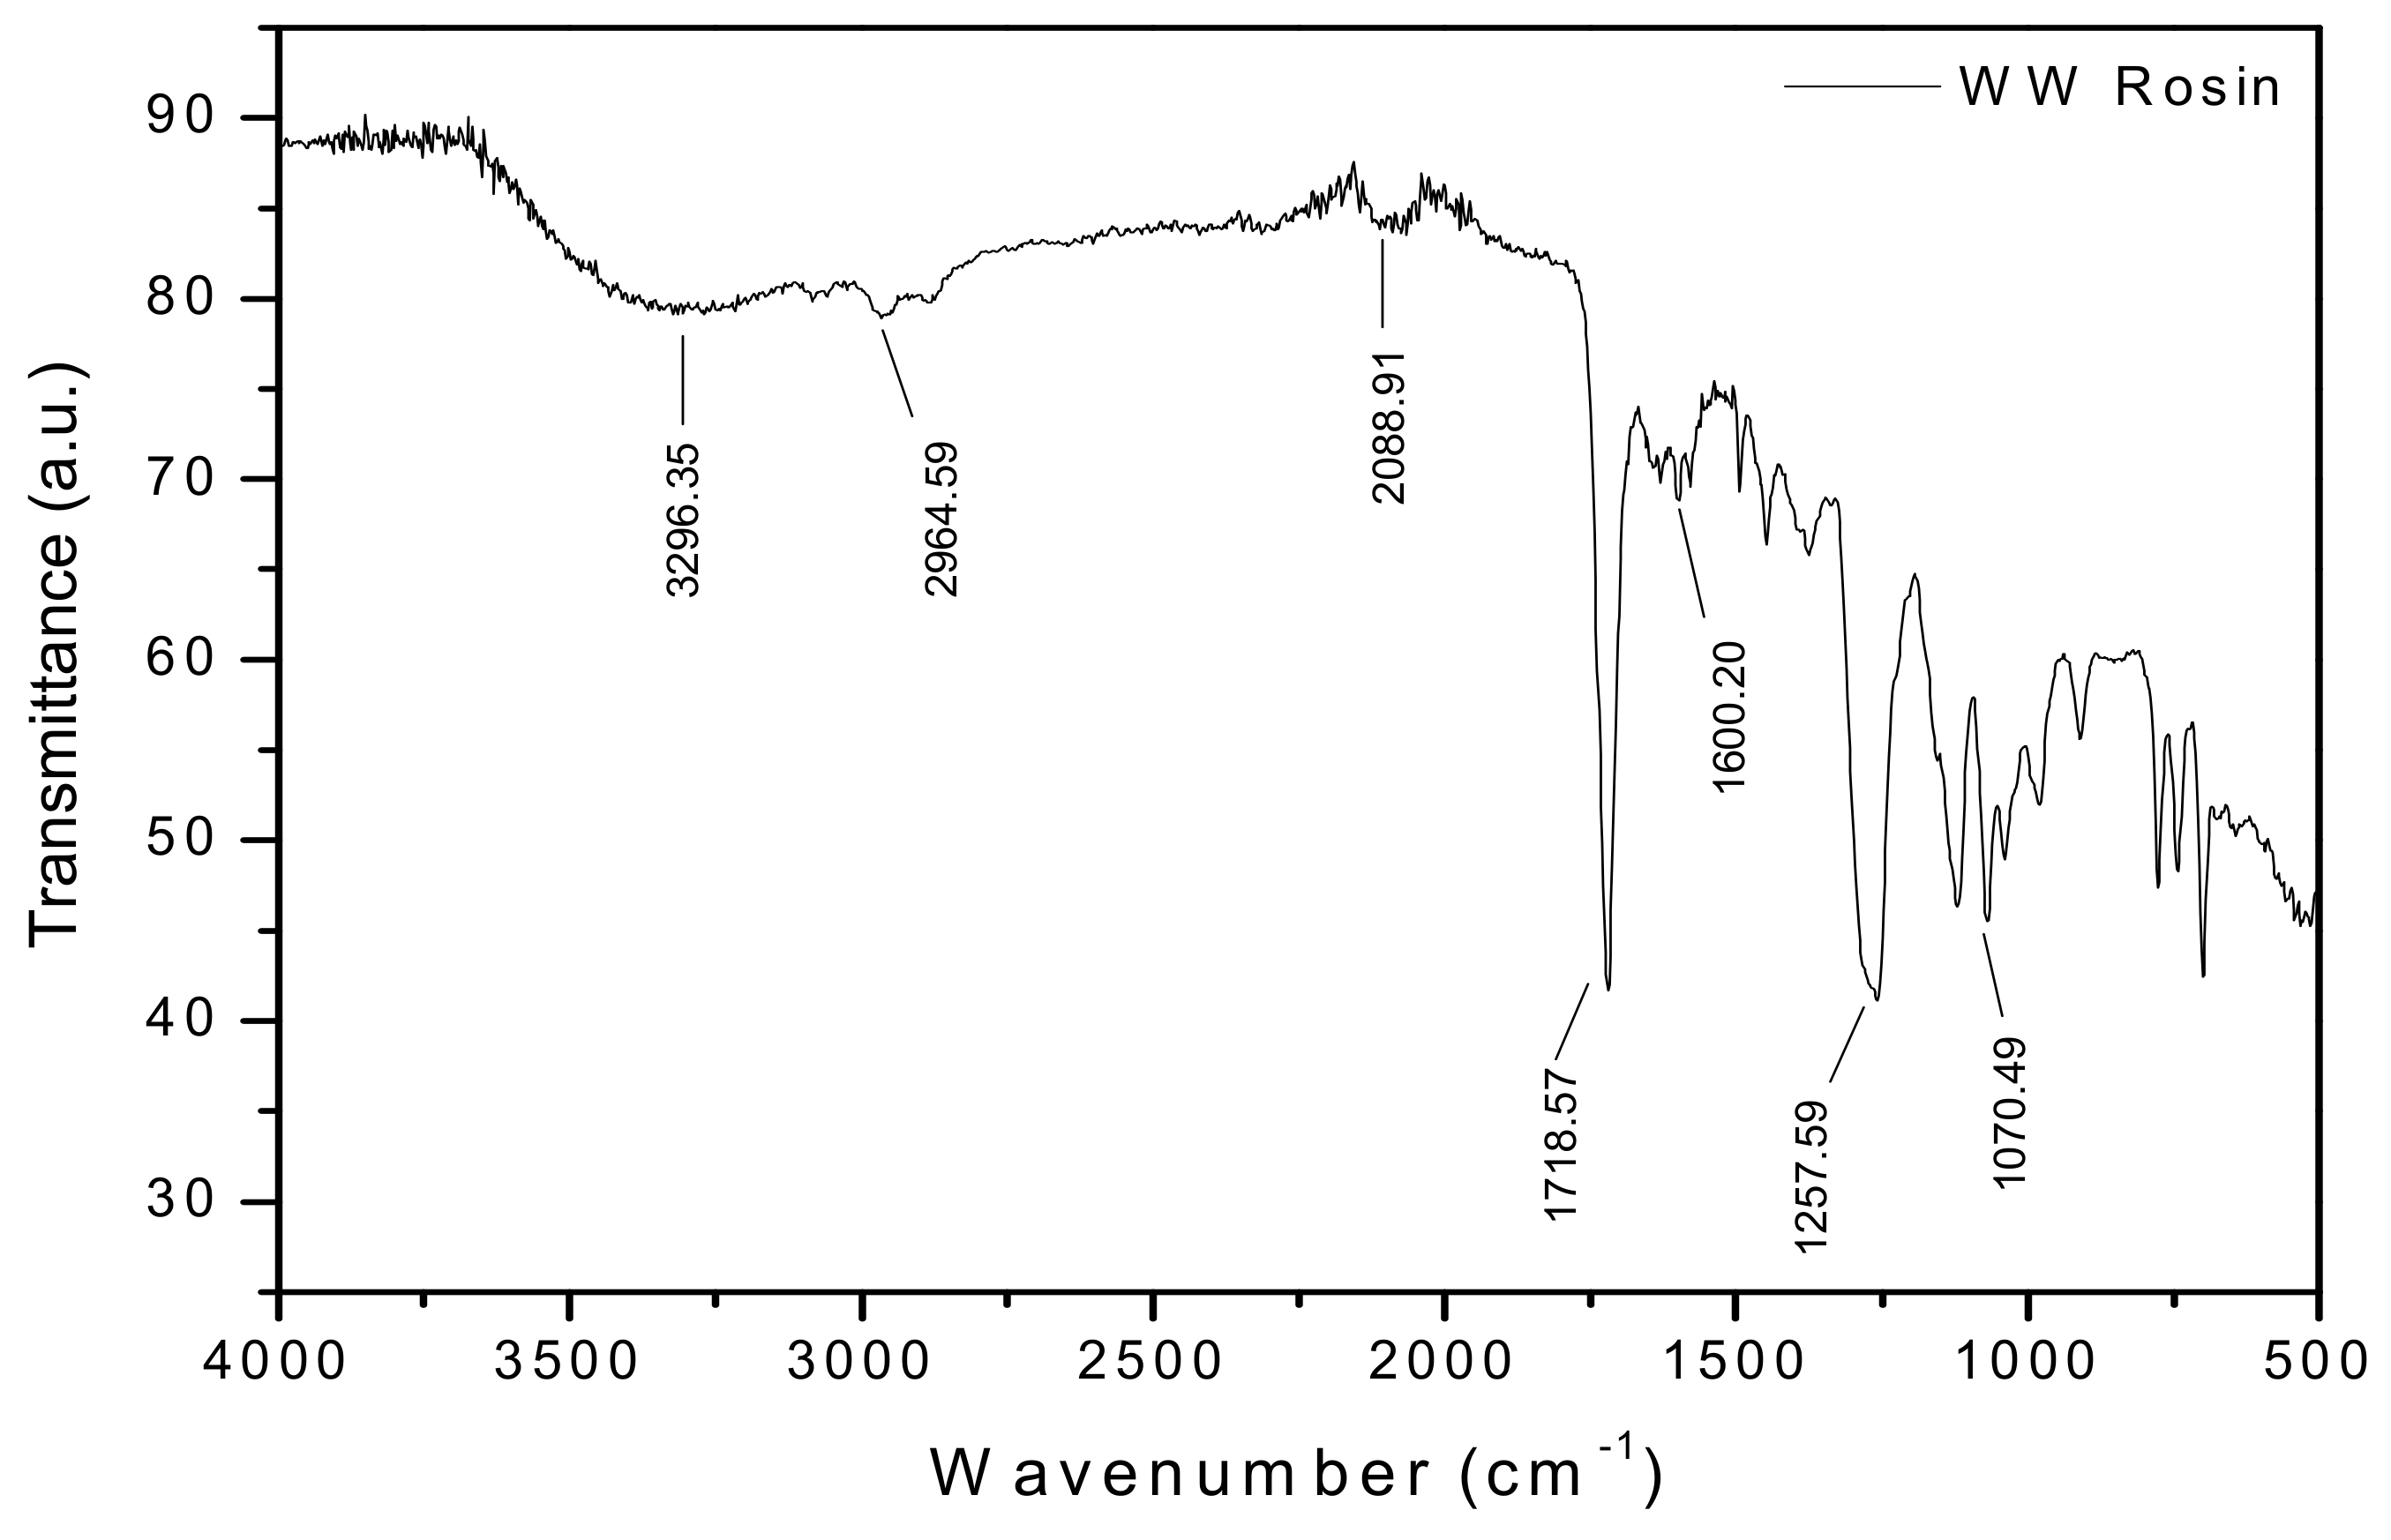
The FTIR spectra analysis performed on the WW rosin and the coatings with different wt.% LLE is presented in Figure 3 and Figure 4, respectively while the corresponding peak properties for the WW rosin are tabulated in Table 4. Several identifiable peaks signified the presence of multiple functional groups on the targeted samples. Based on Figure 3 and Table 4, for the WW rosin, the presence of the hydroxyl (–OH) functional group was detected at 3296 cm−1 with the characteristics of being strong and broad. C–O stretches were identified on two separable peaks at 1257 cm−1 and 1070 cm−1. Other peaks included 1718 and 2964 cm
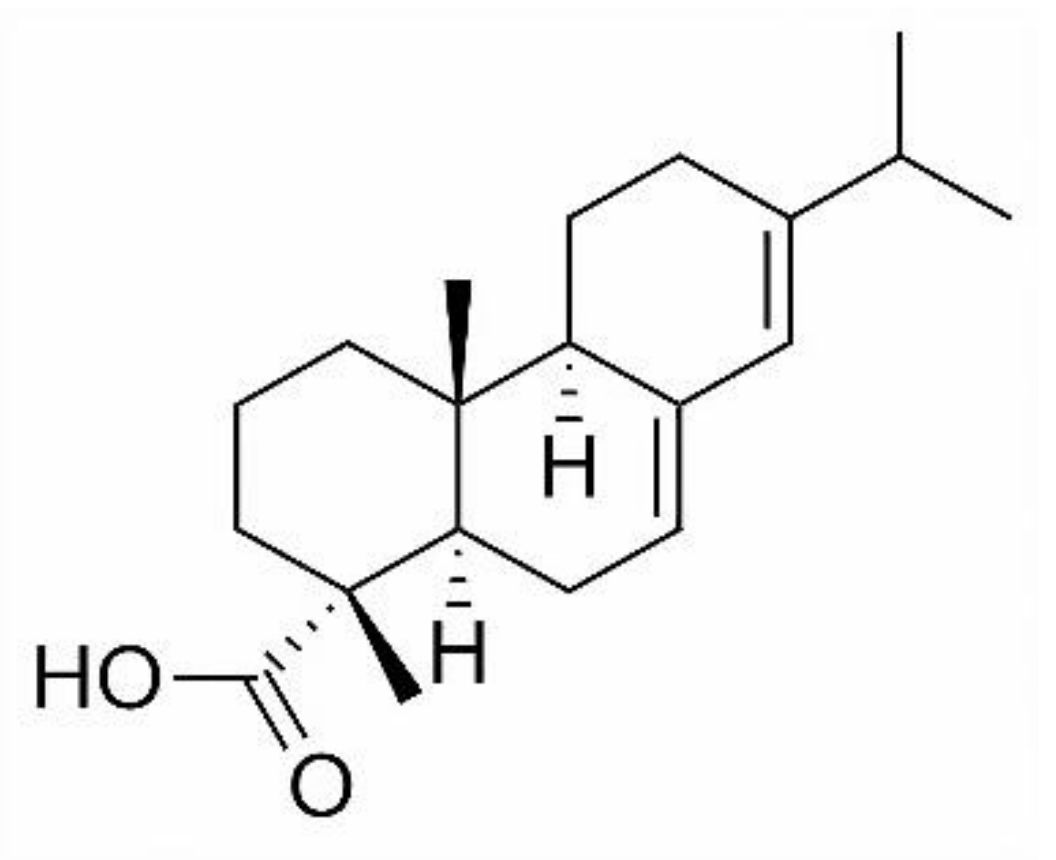
−1 which correlated to C=O and C–H, respectively. These functional groups were in agreement with the molecular structure of that abietic acid, as shown in Figure 5, the primary compound found in rosin [29].
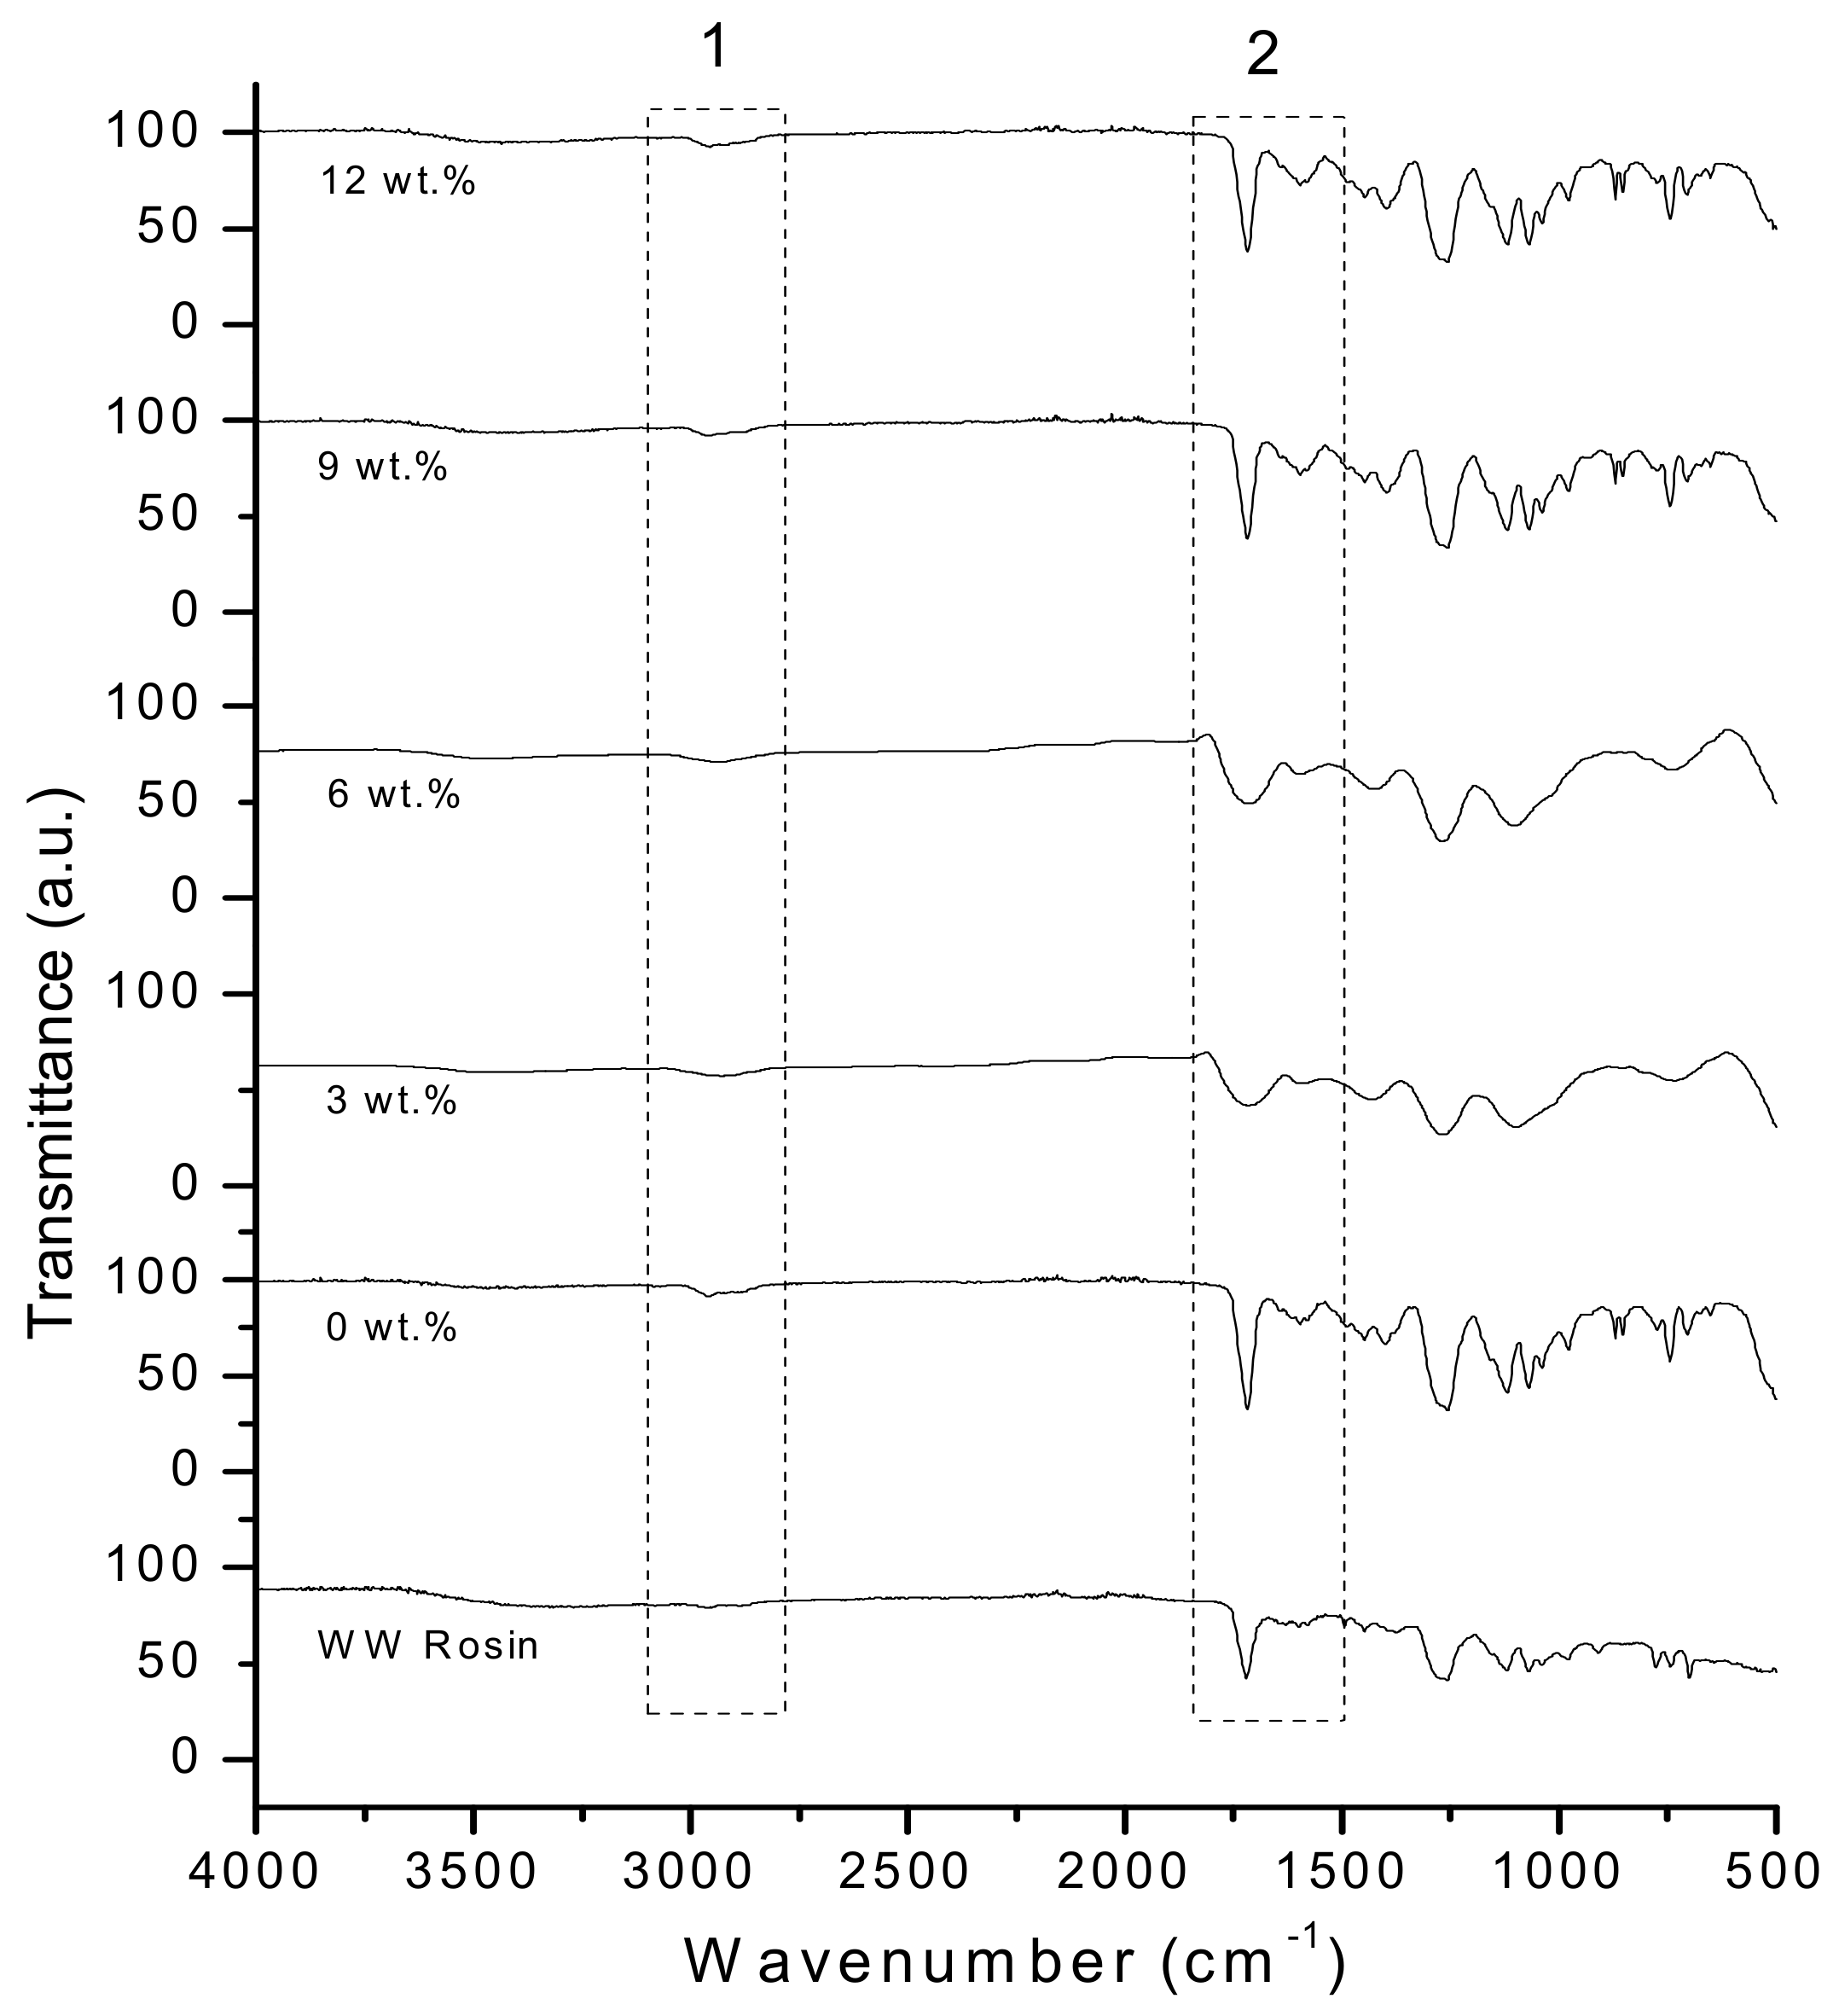
The IR spectra of coatings with a different wt.% LLE displayed in Figure 4 were discussed separately based on two regions. At region 1 (3090 cm−1 to 2770 cm−1), with the addition of LLE into the coating matrix, the peak representing the OH group began to increase in its sharpness, indicating that the incorporated LLE did not entirely dissociate or reduce. The condition is preferable since the functional group contains a heteroatom, which is critical to increase the coating capability in reducing the rate of corrosion. Additionally, it can also provide an additional boost in the adhesive property of the coating. As for region 2 (1840 cm−1 to 1490 cm−1), the peaks presented corresponded to the C=O and C=C functional groups based on the data obtained in Table 4. With the addition of LLE, a decrease in the sharpness of both peaks was identifiable on P2 and P3, but for P1, P5 and P5, a similar intensity was observed. The decrease was probably due to the dissociation or combination of the peaks between the WW rosin and LLE. Moreover, the peaks observed in between 1250 cm−1 and 1300 cm−1 may also correlate to –OH bending modes of the ring structure of the LLE compound. In between 1410 cm−1 and 1500 cm−1, the peaks there represent the C=C ring stretch vibrations of the aromatic groups in both the cathechol [
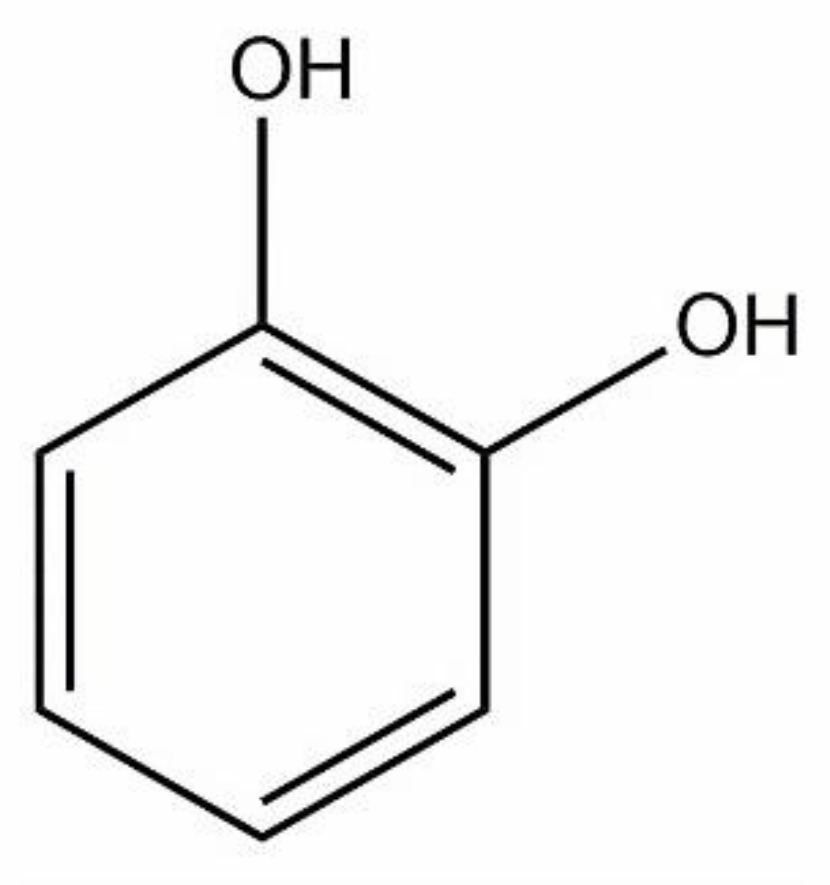
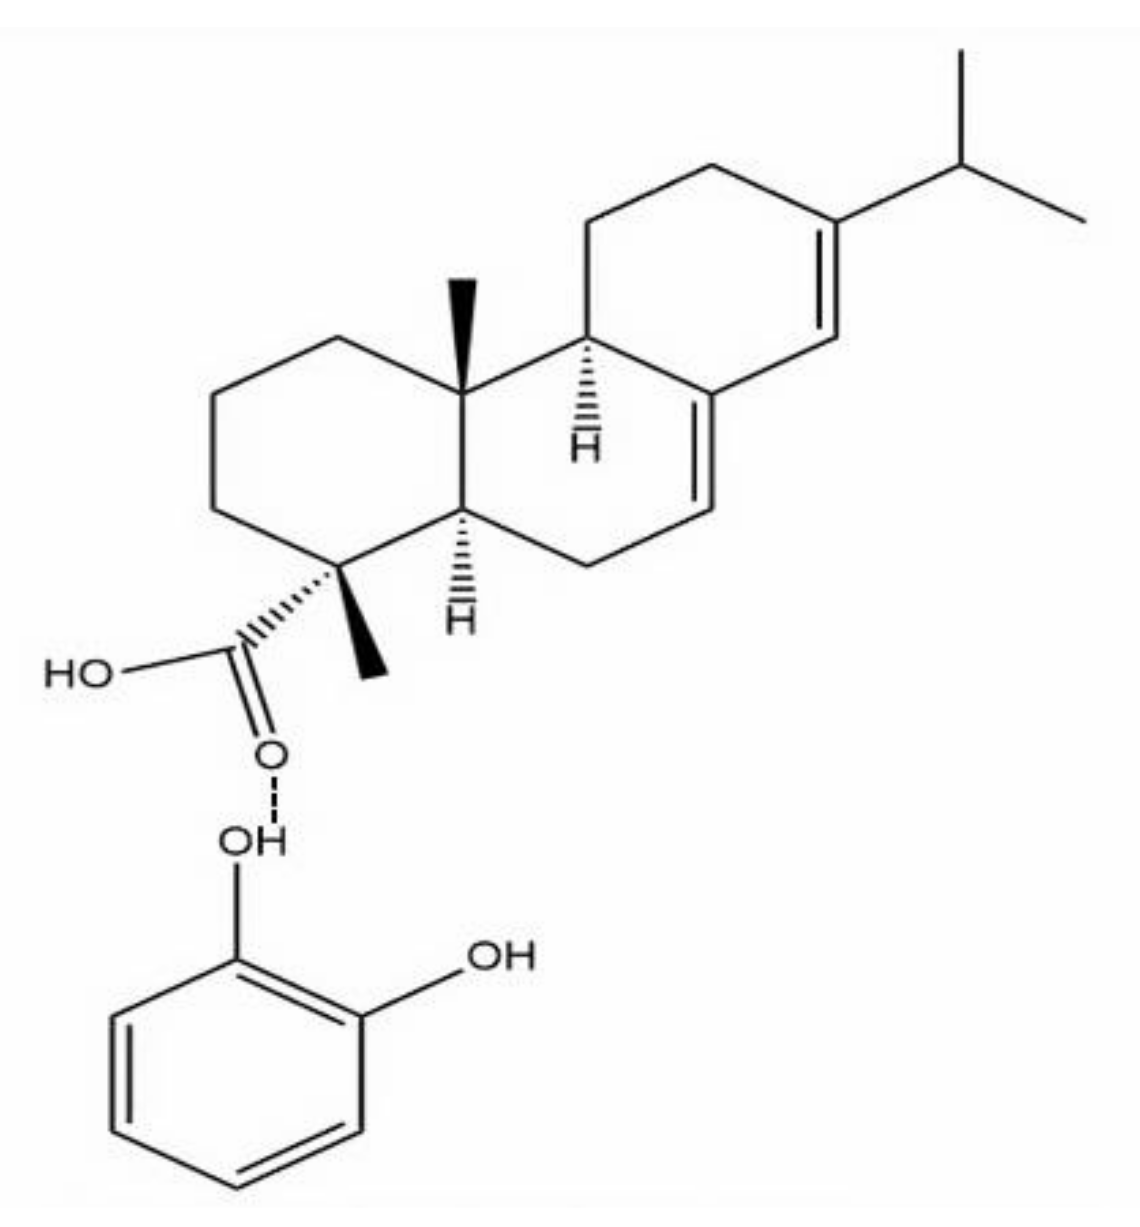
21] and WW rosin, with the peaks becoming more defined with increasing wt.% LLE. Since LLE also possessed a similar primary compound, which is the catechol structure as shown in Figure 6, a suggestion on the complexes according to the previous study which may form between the two materials is illustrated in Figure 7 [30].

3.2. X-ray Diffraction Analysis

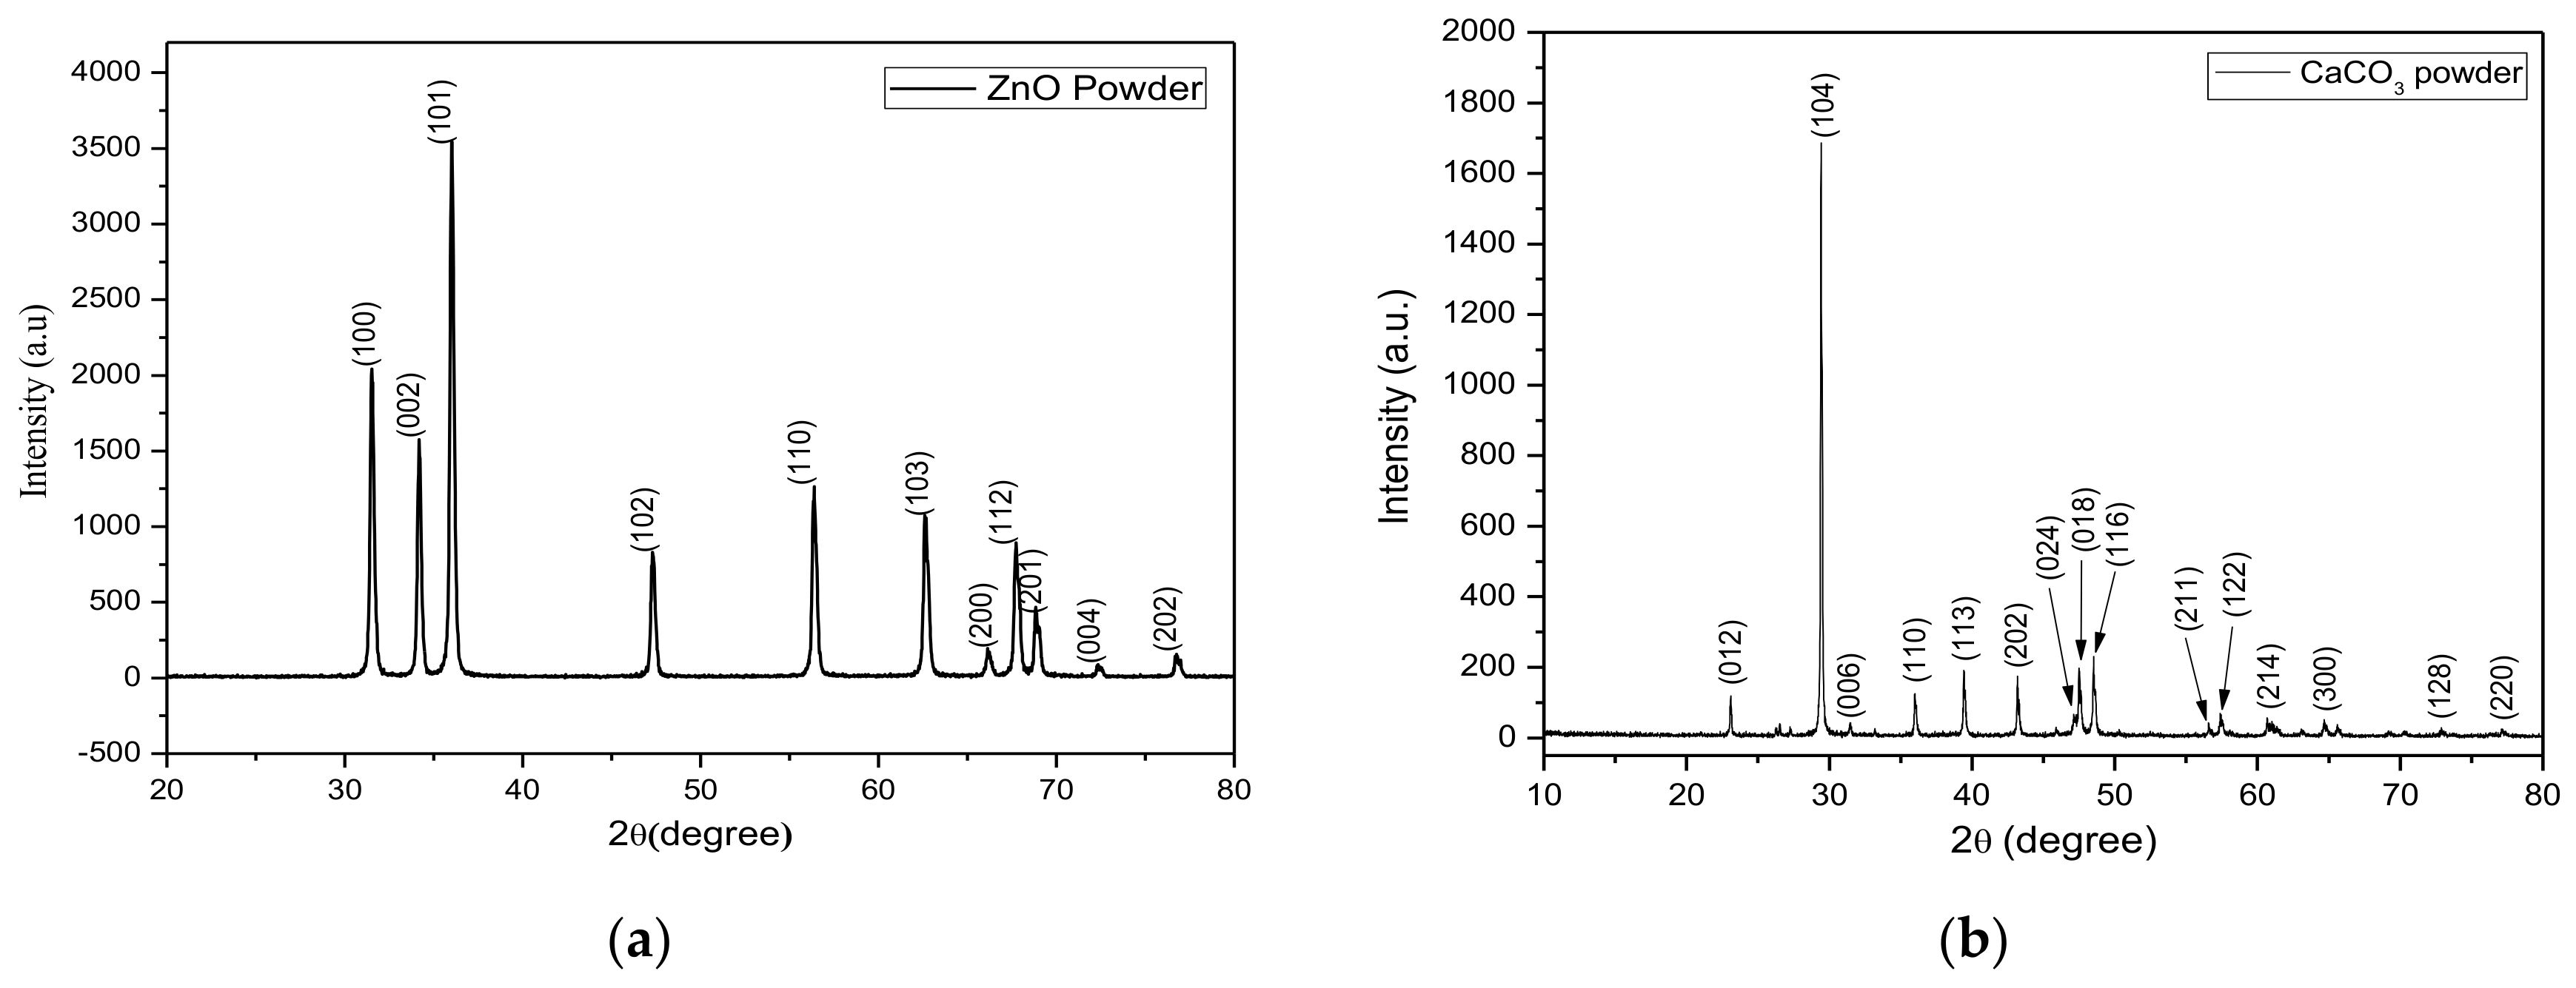
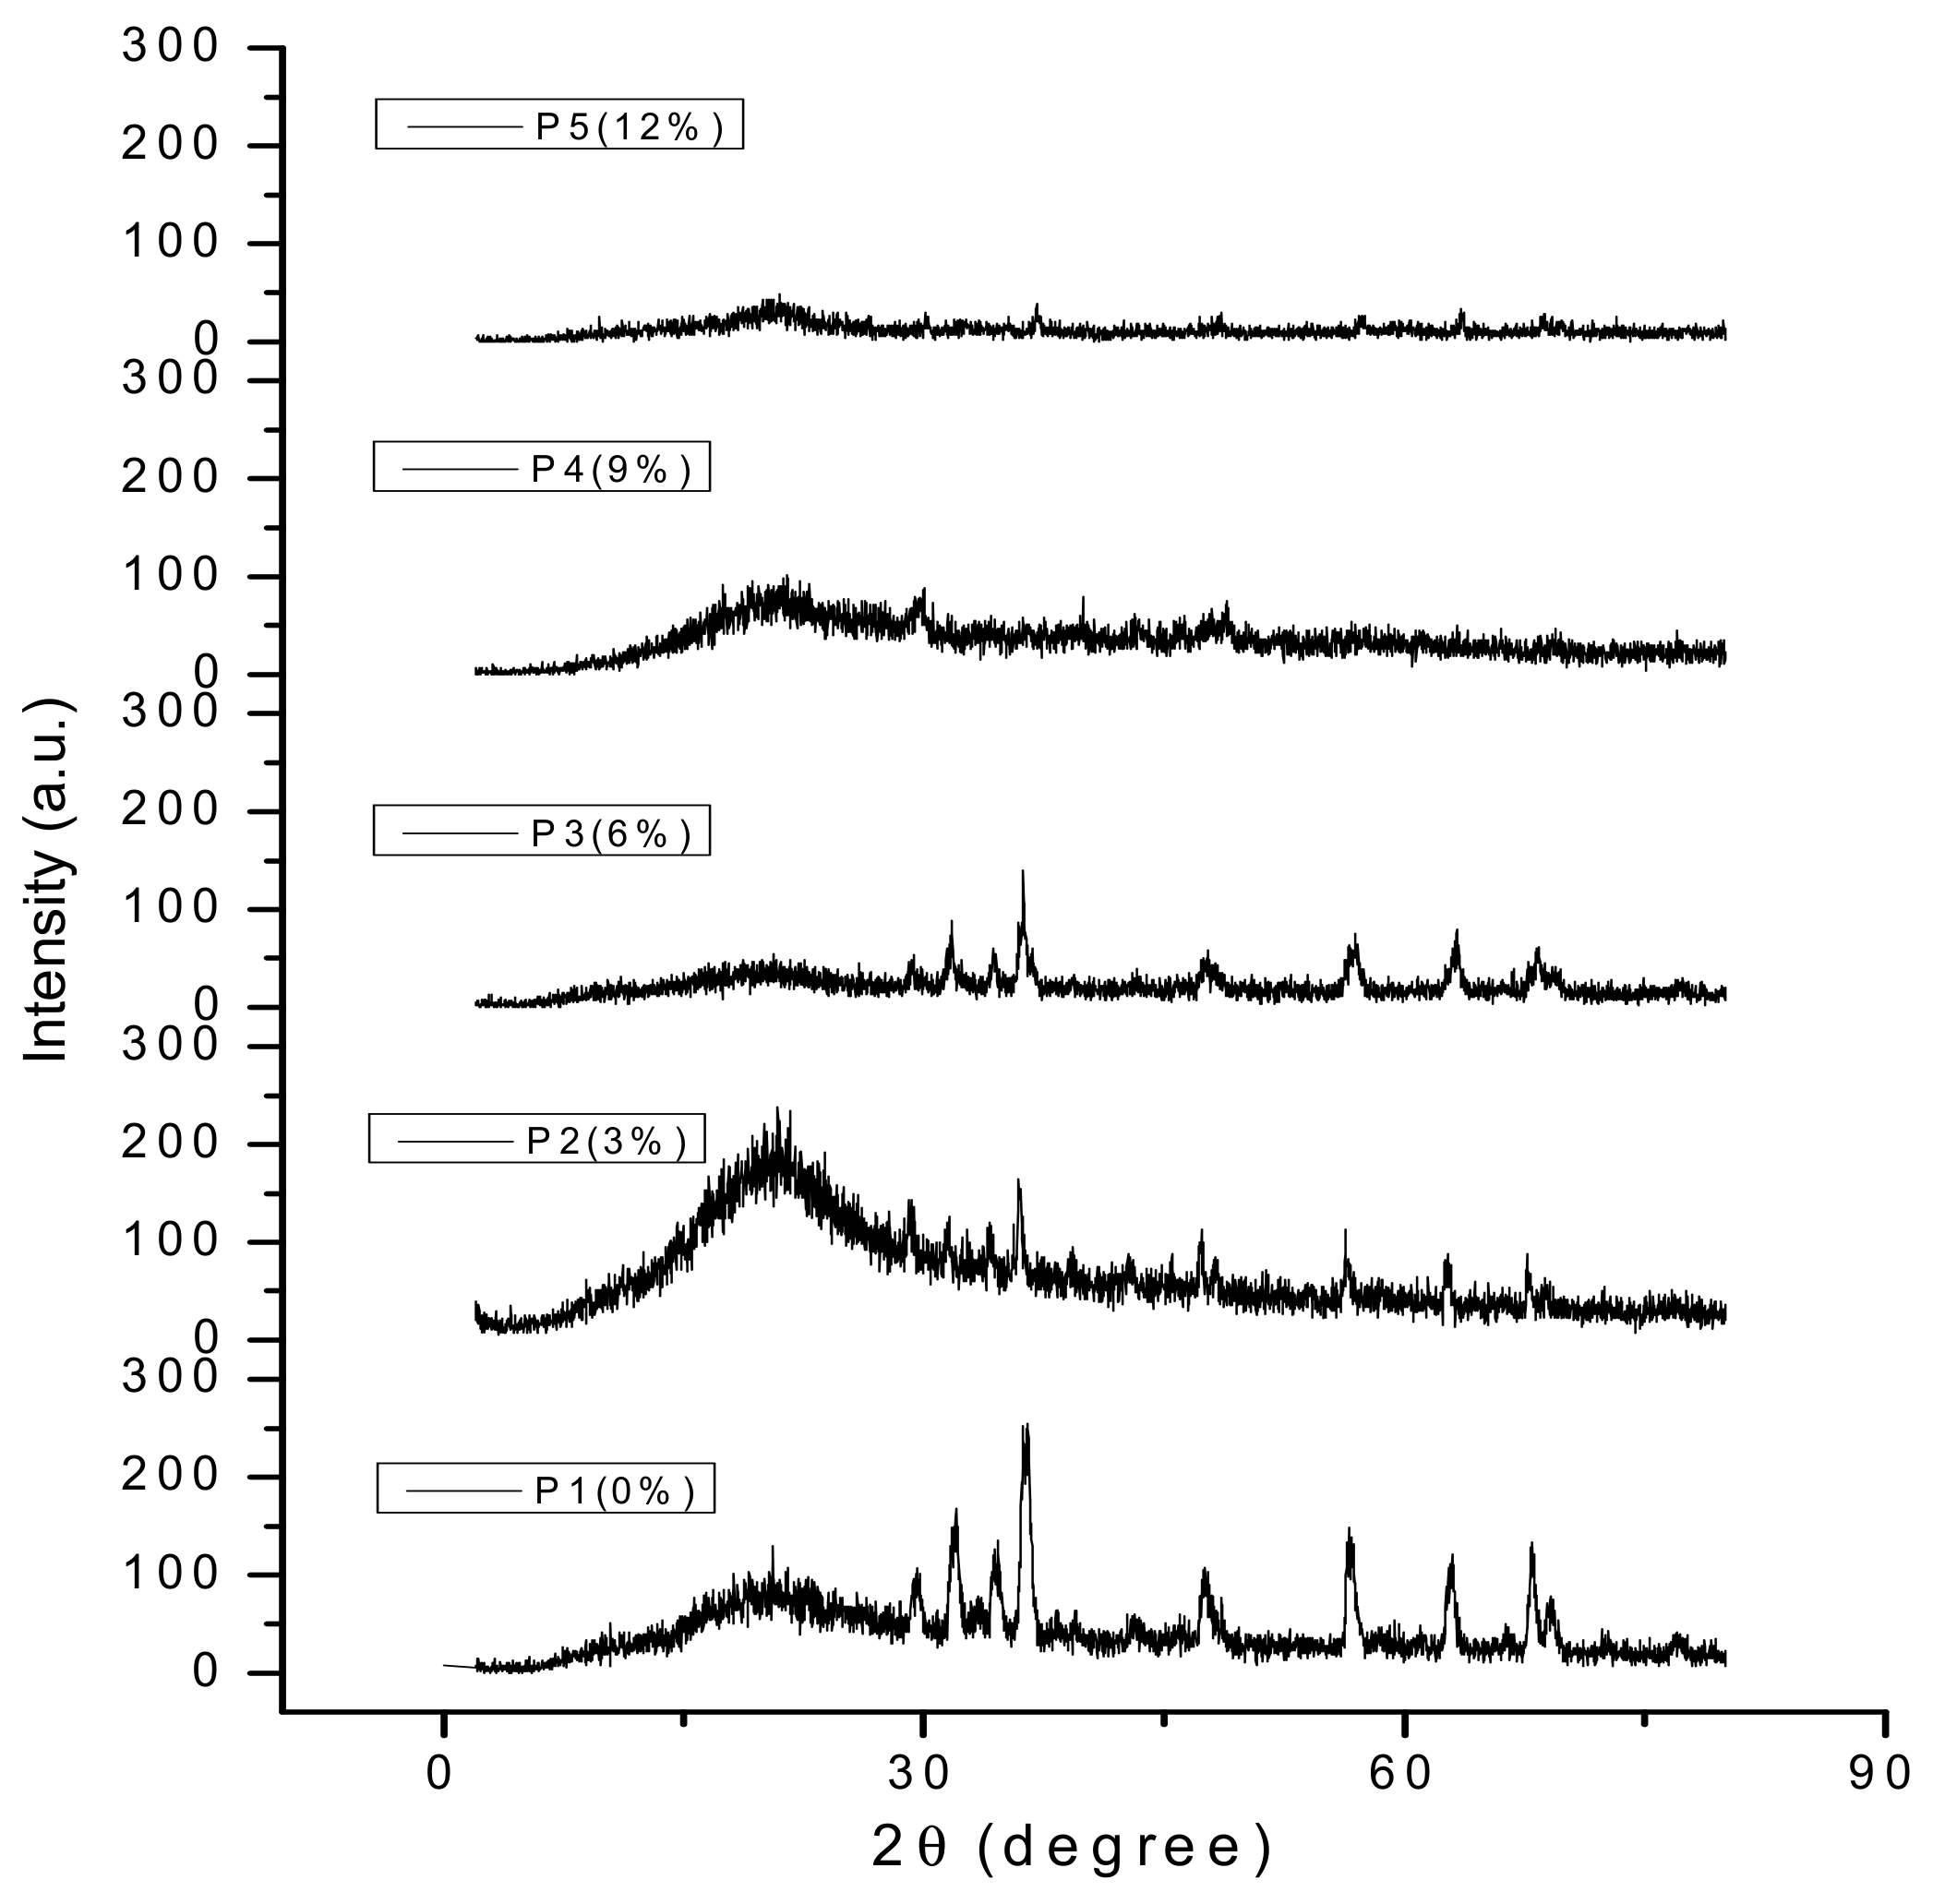
The XRD analysis was performed on the solid components of coating, i.e., ZnO and CaCO3. The obtained results are shown in Figure 8. Based on Figure 8 for the ZnO powder, multiple peaks were identified at 2θ such as 31.5°, 34.2°, 36.0°, 47.3°, 56.4°, 62.6°, 66.2°, 67.7°, 67.7°, 68.8°, 72.4° and 76.7° with corresponding planes of (100), (002), (101), (102), (110), (103), (200), (112), (201), (004) and (202); respectively. The findings were in agreement with the ZnO standard of the Search-Match software (PDF No. 5-664).
As for the CaCO3 powder, the angles discerned at 2θ were 23.1°, 29.4°, 31.4°, 36.0°, 39.4°, 43.2°, 47.1°, 47.5°, 48.5°, 56.6°, 57.4°, 60.7°, 64.7°, 72.9° and 77.2°, with corresponding planes of (102), (104), (006), (110), (113), (202), (024), (018), (116), (211), (122), (214), (300), (128) and (220); respectively. The spectrum was in agreement with the standard given by the Search-Match software (PDF No. 86-2334).
As for the spectra of coatings with different wt.% LLE, the results are presented in Figure 9. Based on the plotted graph, when the LLE was introduced into the coating matrix containing ZnO and CaCO3, it was observed that a sharper hump was developed for the coating with 3 wt.% LLE, as compared to the coating with no LLE. The condition denotes a qualitative change in the matrix of coating where it has become much more crystalline. The crystallinity property is vital for the performance of coating where it corresponded to higher capabilities of coating to stay as an intact structure when exposed to a harsh environment [31]. Additionally, it was also discernable that an increase in the concentration of LLE resulted in a decrease in the peaks representing both ZnO and CaCO3. The occurrence may yield from the dissociation of the solid components as more LLE was incorporated. The decrease in the sharpness of the hump gave an early sign of the efficiency of coatings in terms of its barrier properties. Coatings with an LLE concentration above 3 wt.% can be expected to have a lower performance during the last stage of the immersion test since the amount can be considered to be an overload, and thus may reduce the cross-linkage formation during the curing stage.

3.3. Antimicrobial Assessment

The antimicrobial screening was performed on each component of the coating and the coatings with different wt.% LLE against the strains of Staphylococcus aureus (+) and Pseudomonas aeruginosa (−). The corresponding average data (three samples per each condition), and standard deviation with the efficiency calculated based on the comparison of each material with the positive control, gentamicin, are tabulated in Table 5. The data are also illustrated as a vertical bar graph in Figure 10a for S. aureus (+) and Figure 10b for P. aeruginosa (−). For the Gram-positive bacteria, which is S. aureus (+), the highest efficiency was achieved by ZnO (30.0%) with the size of the inhibition zone was 12.0 mm. The discovery is supported by a various study where ZnO was proven to have the capability to kill the bacteria by attaching itself to the surface and release the reactive oxygen species (ROS) [32,33]. As for P. aeruginosa (−), the crude extract of river tamarind profoundly reduced the growth of the bacteria with the efficiency up to 66.7% and the inhibition zone of 20.0 mm. The finding was critical since P. aeruginosa (−) is a bacterium, which is said to have a higher resistance towards the antibiotic compared to other bacteria in the same category [34]. The excellent antimicrobial ability of LLE can be attributed to the primary compounds contained within the extract, such as phytol and squalene [19].
The tabulated average data, standard deviation and efficiency for the evaluation of coatings with different wt.% LLE against similar bacteria are presented in Table 6 and illustrated in Figure 11. For the strain of S. aureus (+), the coatings do not show any significant differences, even with the variation in the amount of LLE. Most coatings displayed an efficiency of 45.0%, with the average inhibition zone of 18.0 mm. This suggests that the addition of LLE into the coating matrix gave no added value in terms of inhibiting the bacterial growth of S. aureus (+). In contrast, when against 
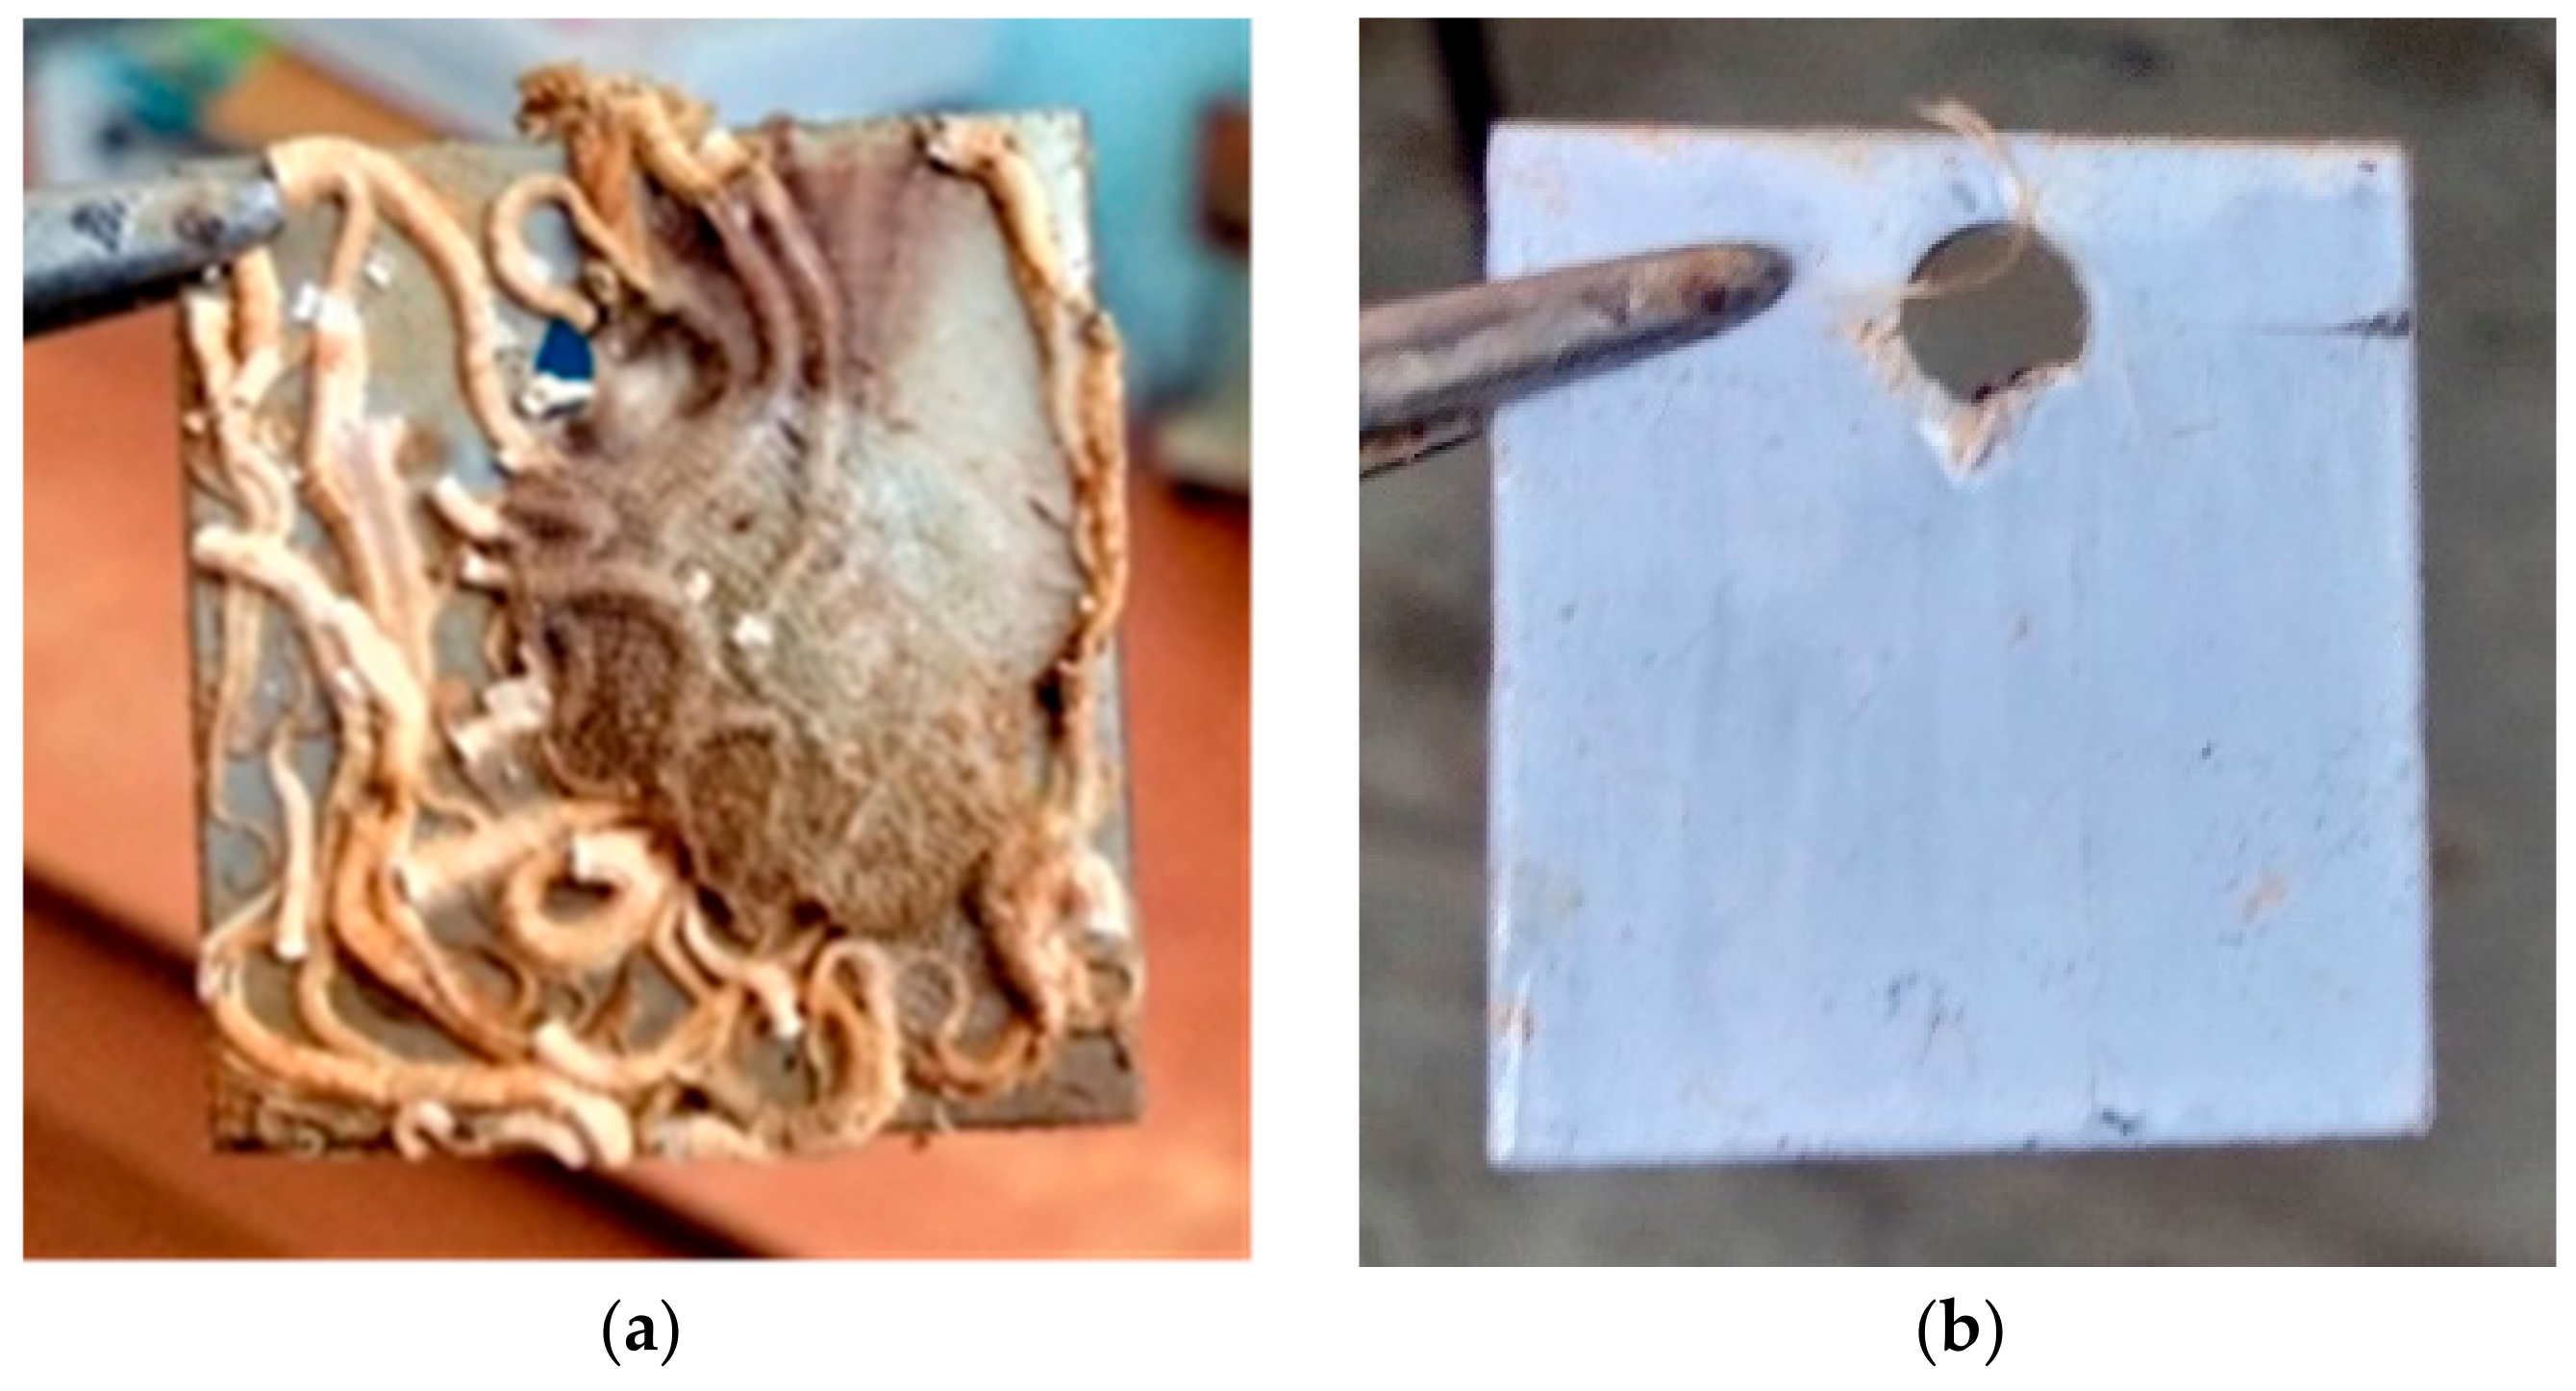
P. aeruginosa (−), the increased LLE caused an increase in the size of the inhibition zone. P5 with the highest wt.% LLE possessed the most excellent efficiency of 36.7%. The increment of the efficiency was supported by the finding obtained when the individual LLE was tested against similar bacterium. Additionally, during the immersion test in the real environment, the uncoated SS316L was observed to have a lot of solid deposition as compared to the coated SS316L. The comparison is as illustrated in Figure 12. This suggests that the presence of coating managed to stop the formation of biofilm commonly produced by the bacteria. Hence, it also proved that the formulated coating did not only have anticorrosion property, but also microbial inhibitive capability.

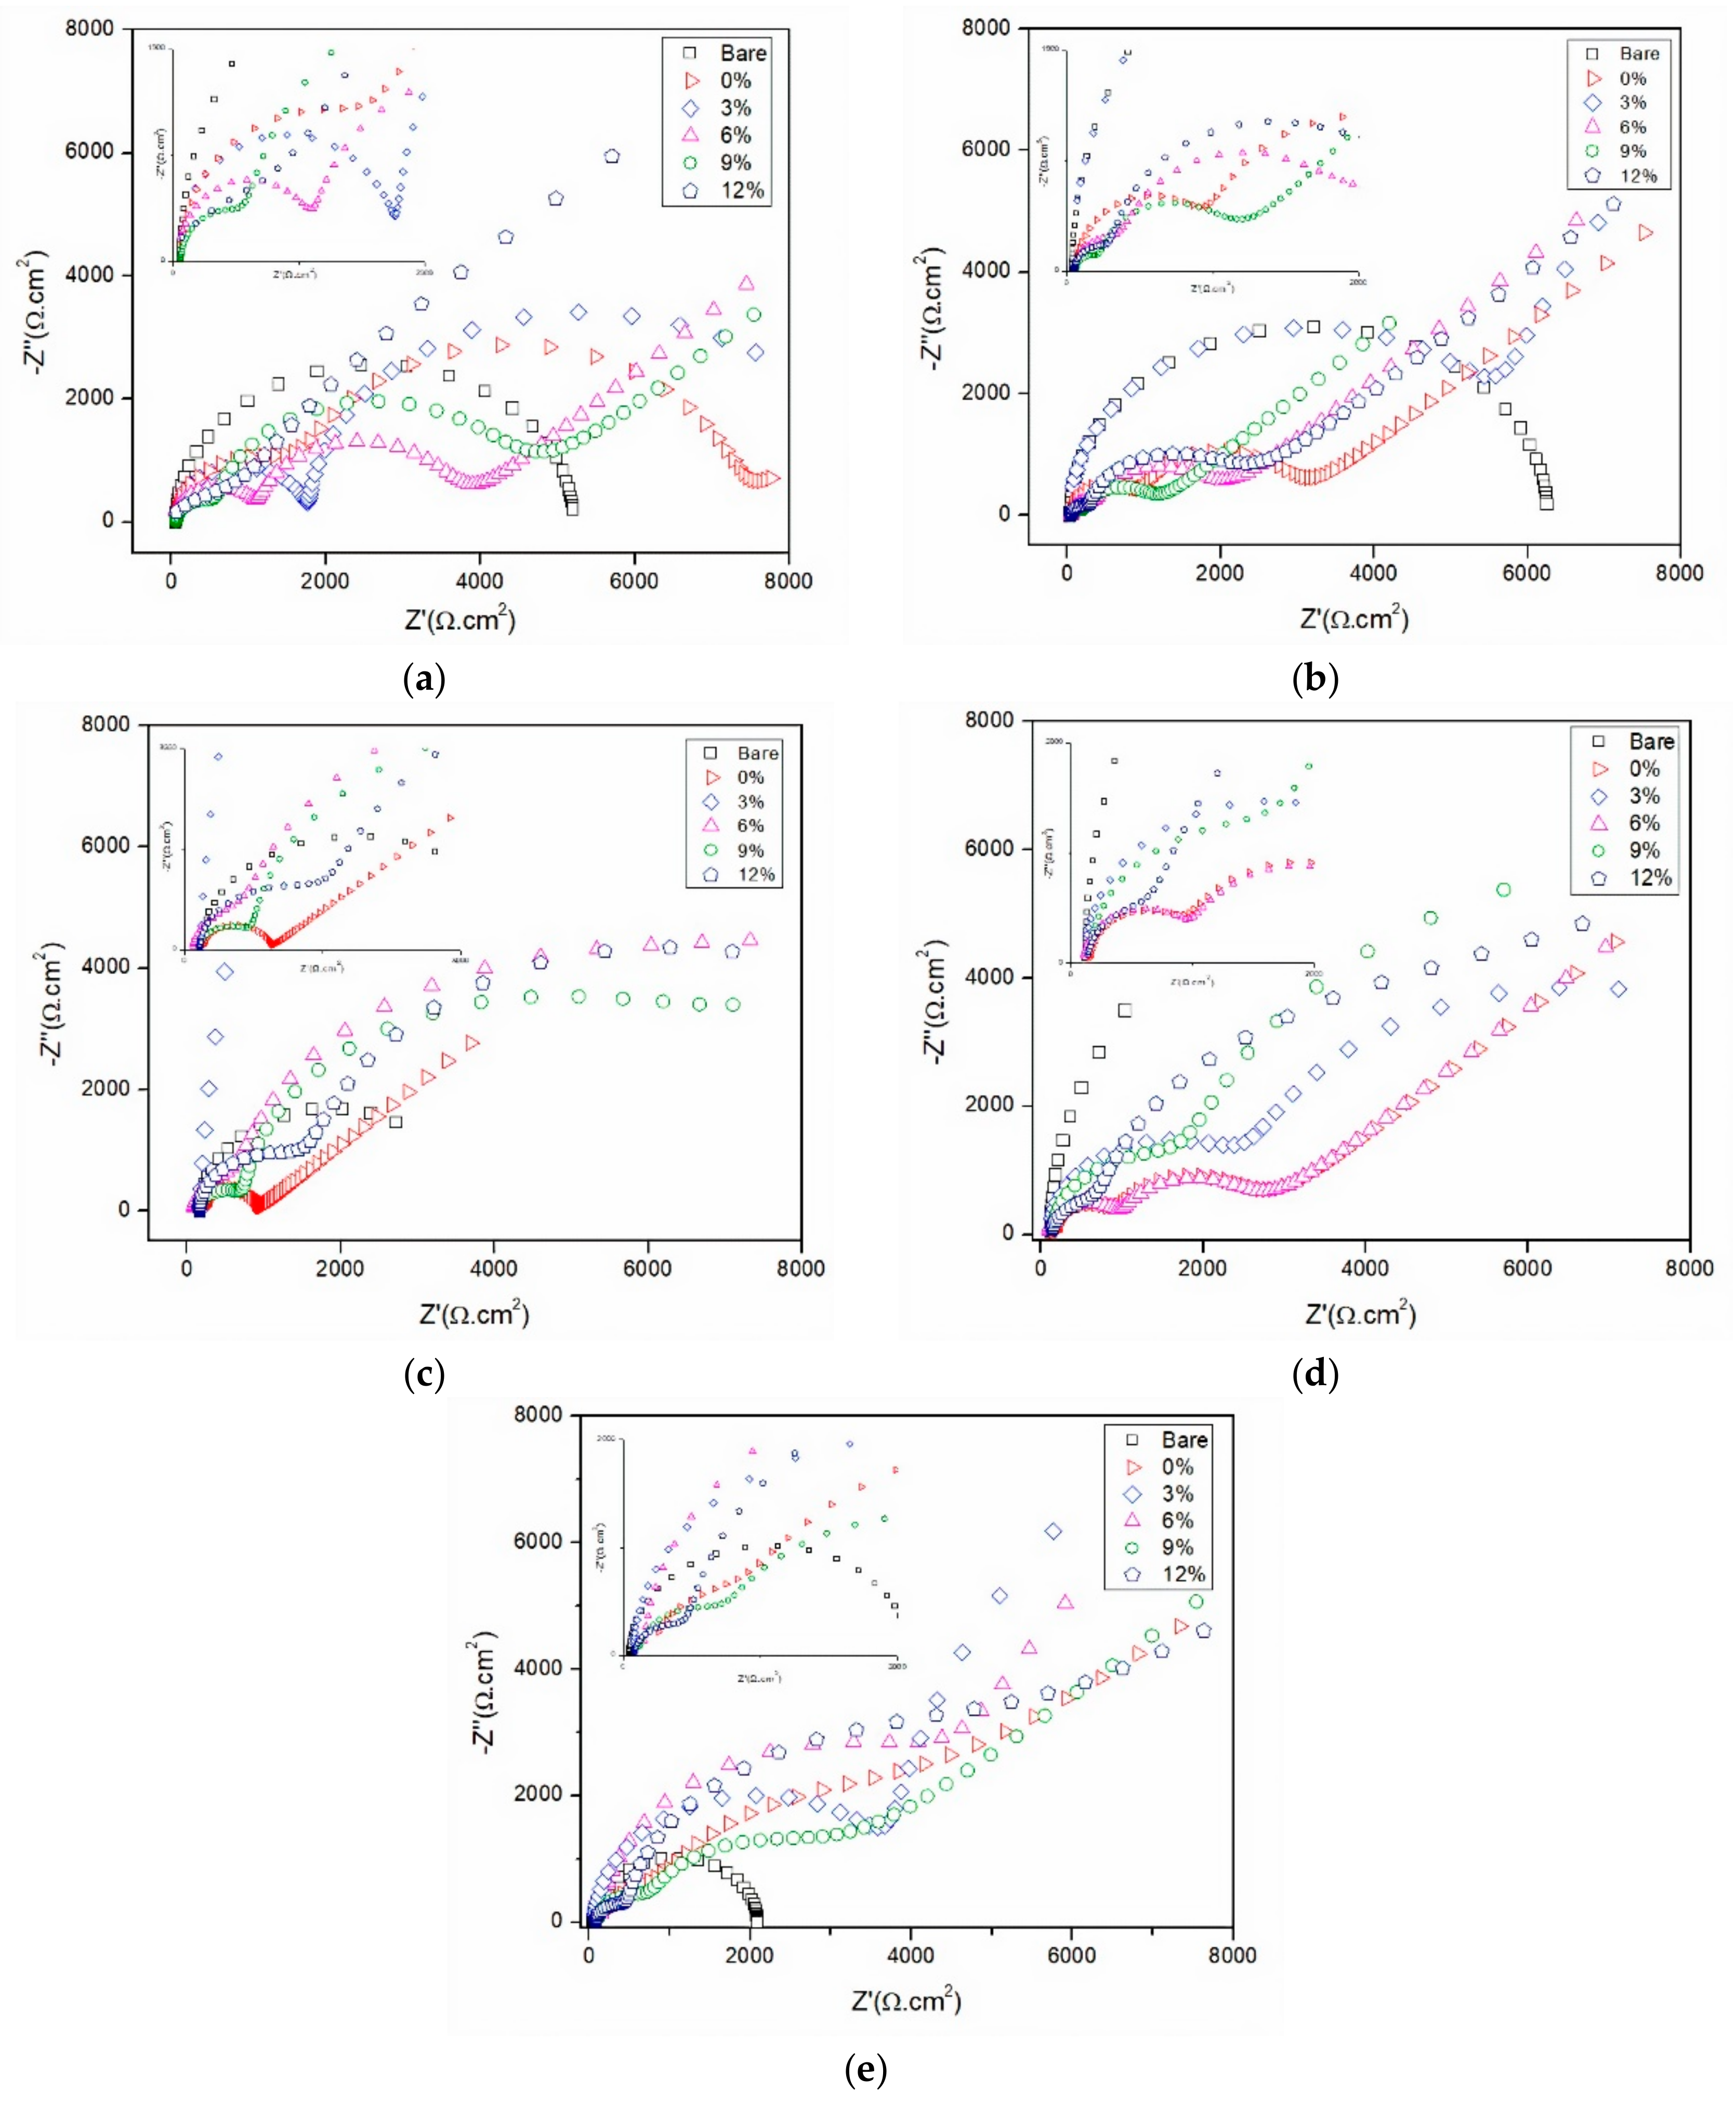
3.4. Electrochemical Impedance Spectroscopy (EIS)

The EIS study on the barrier qualities of coatings, when immersed in a real environment at Setiu, Terengganu, is displayed as Nyquist plots in Figure 13 with the corresponding impedance data tabulated in 
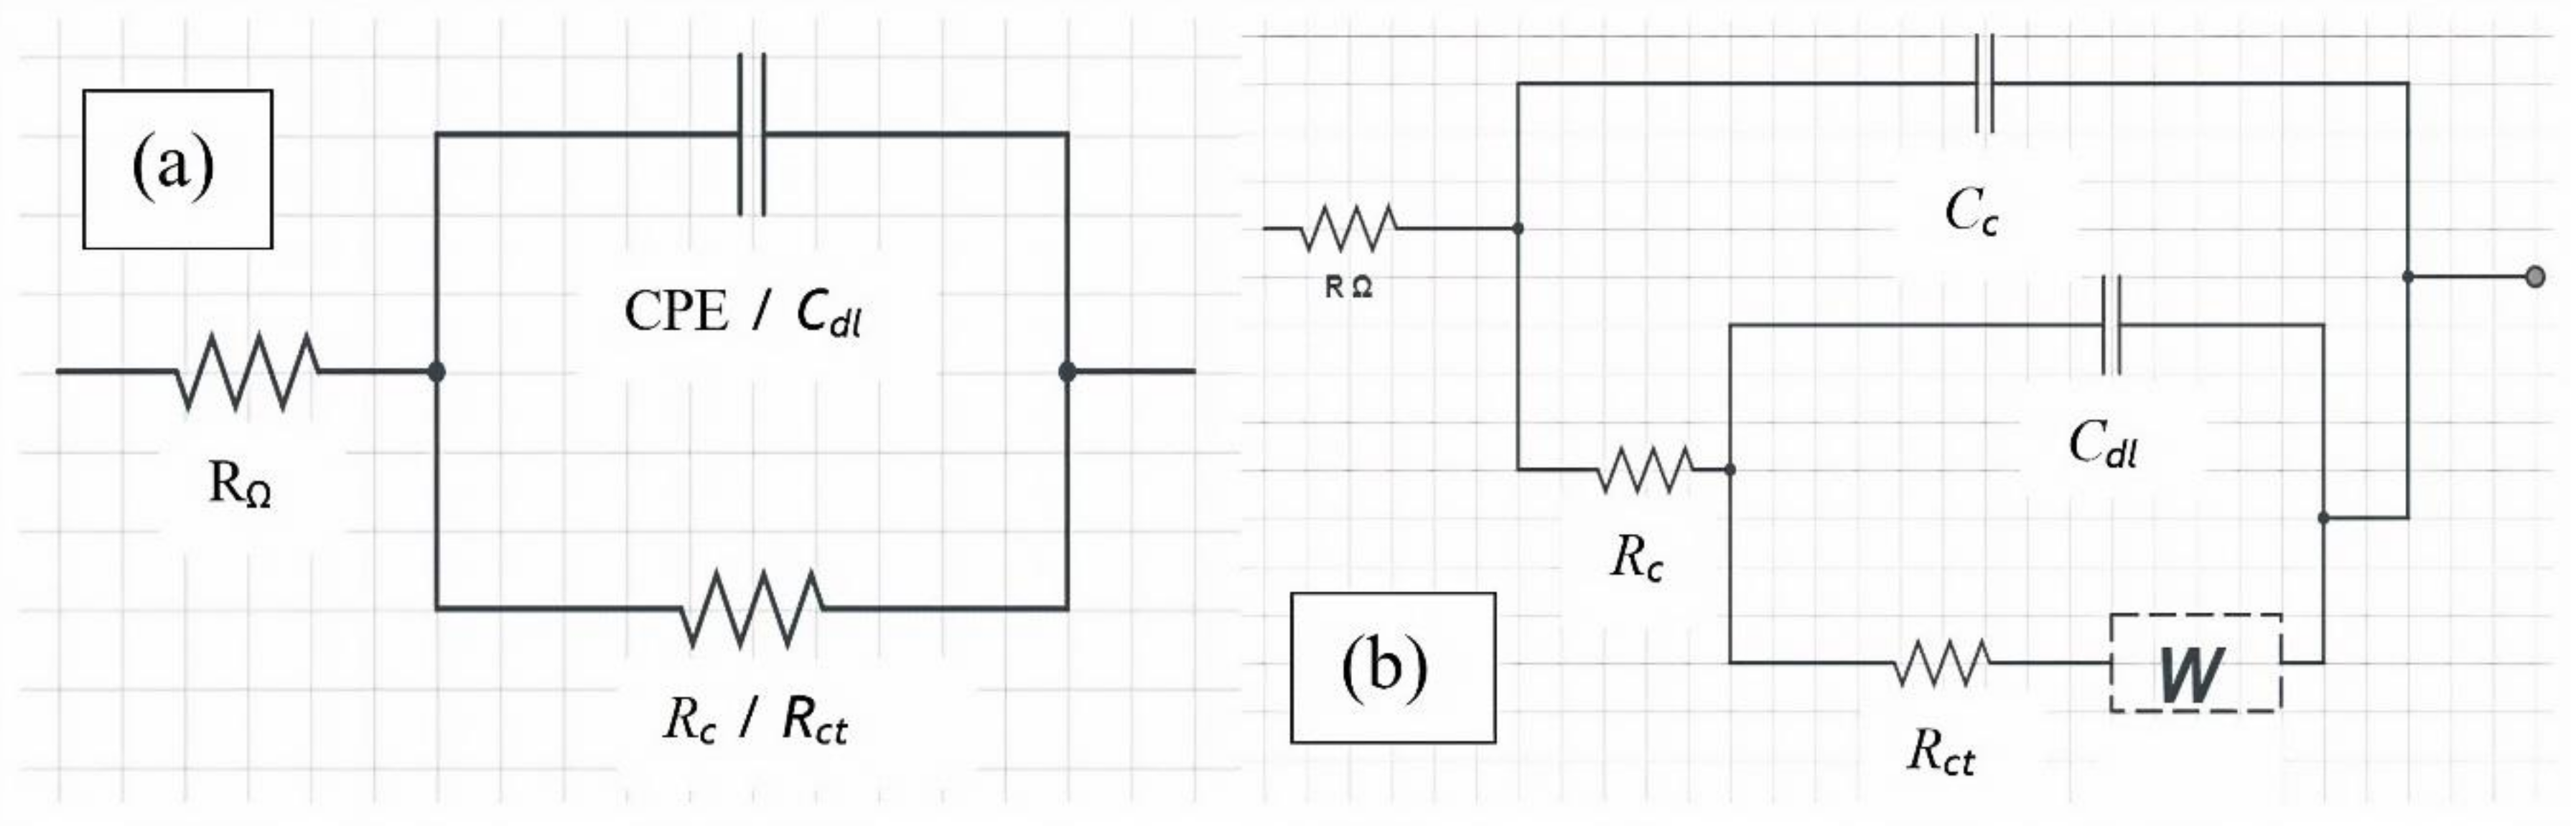
Table 7. The impedance analysis used the coating deterioration equivalent circuit, where it deployed the elements of two resistors and two capacitors connecting in parallel, as mentioned in the previous study [28]. There are several parameters measured, including the constant phase element (CPE), coating resistance (Rc), coating capacitance (Cc), the charge transfer resistance (Rct), and the double-layer capacitance (Cdl). In general, the Rc denotes the breakdown or deterioration of the coating matrix. As the values of Rc begin to drop, the formation of pores due to the penetration of aggressive electrolytes will also increase. The Cc parameter relates to the amount of electrolytes present in the coating matrix. The changes which happen in this parameter are induced by the changes of the electrical permittivity of the coating matrix. The condition arises since coating has a small amount of electrical permittivity compared to water. Hence, when the coating begins to absorb water, its overall electrical permittivity will also start to increase. On the other hand, the Rct is considered as the primary indicator of the barrier quality. The parameter denotes the susceptibility of corrosion on the metal surface that is directly underneath the coating layer. In the Nyquist plot, the increase in Rct is presented with the increase in the diameter of the semicircle. The increment of its value means that the corrosion resistance is higher, and the probability of corrosion occuring is lower. As for the Cdl, the increase in this value relates to the higher generation of the delaminated area at the interface of coating/metal. The emergence of this delaminated area is only possible when the formation of pores has successfully breached the interface region. With the increase in Cdl, the number of delaminated areas produced also increased, and hence the adhesive property of coating began to lose.
For the parameter of Rc, during the first 10 days of immersion, P1 with no LLE produced the best value of 2.07 × 10³ Ω followed by P5 (1.85 × 10³ Ω) and P2 (1.79 × 10³ Ω) with 12 wt.% and 3 wt.% LLE, respectively. The differences in these specimens, however, were not notably different and can be assumed to behave in a relatively similar efficiency. The high Rc values during the initial stage are due to the lower rate of electrolytes penetration. Most electrolytes on this stage are attached to the outer layer of coating and as such, the formation of pores are still insignificant. However, during the immersion period of 20 days to 50 days, coatings except P2 have a substantial drop, signalling the high rate of corrosive agents’ penetration into the coating matrix. In this stage, P2 displayed the best performance with only a slight fluctuation on the last period of immersion (20 days, Rc = 6.17 × 10³ Ω; 30 days, Rc = 79.80 × 10³ Ω; 40 days, Rc = 2.90 × 10³ Ω; 50 days, Rc = 4.00 × 10
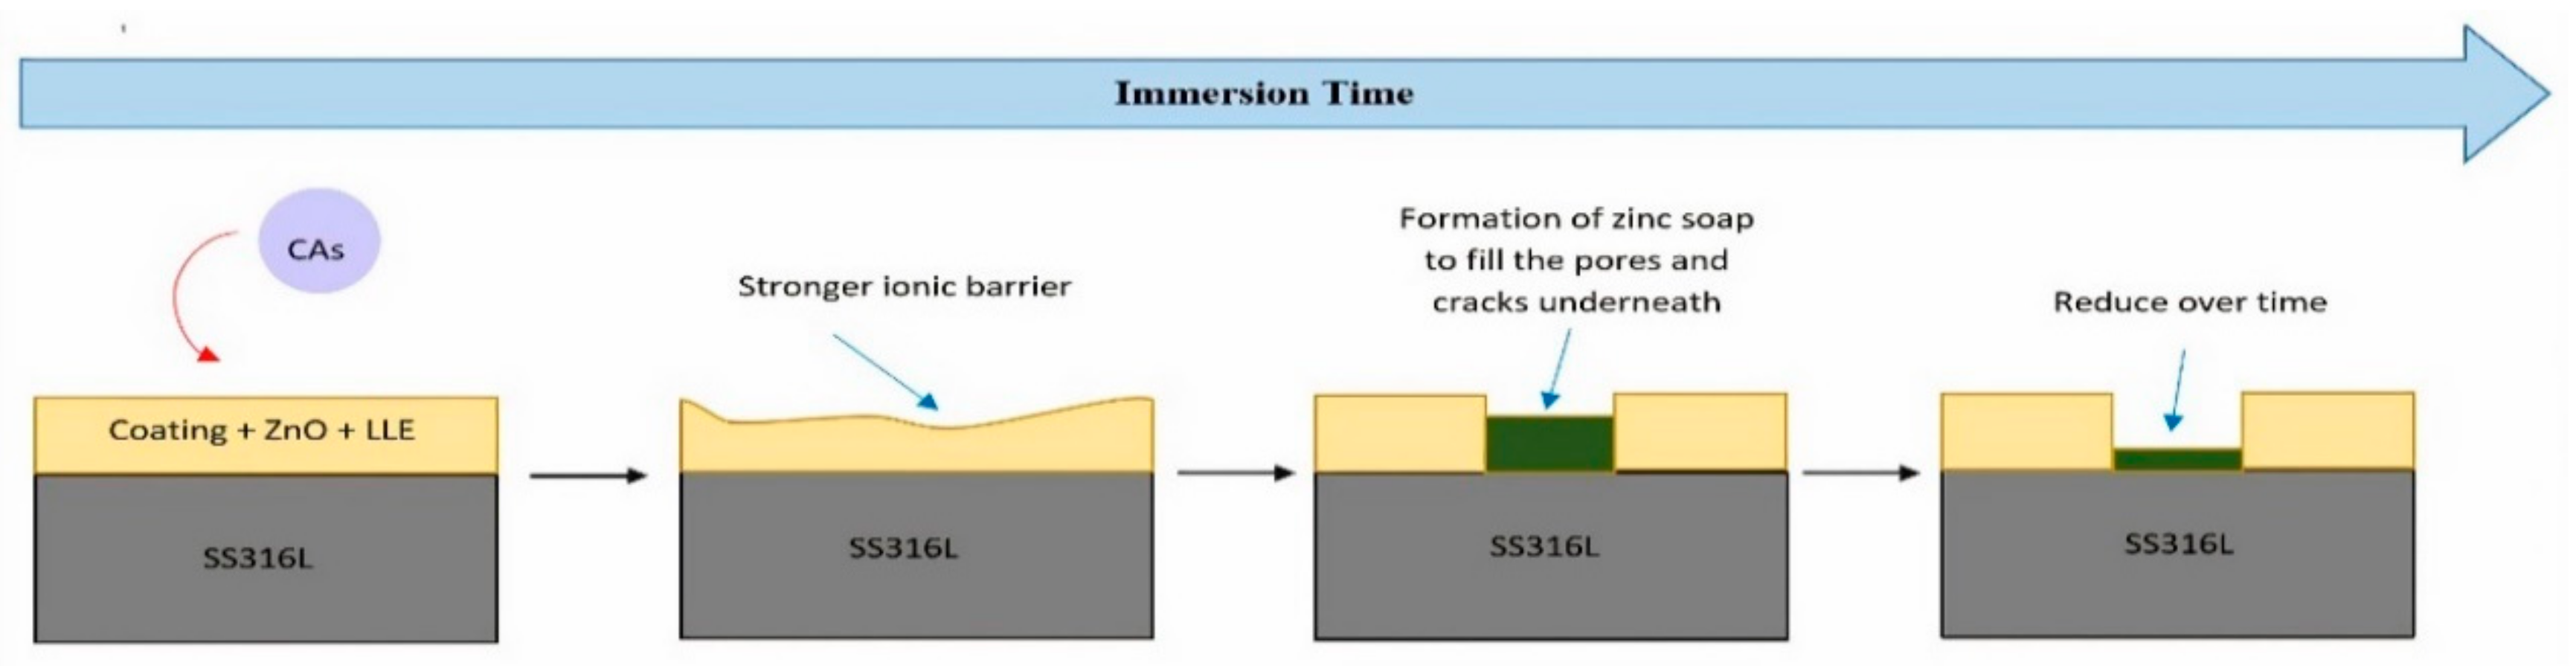
³ Ω). The drastic increase in the P2 performance between the period of 20–40 days can be attributed to the action of the pigment, where it acts through the sacrificial action to produce an intermediate barrier, which is the zinc stearate or zinc soap within the coating matrix, as illustrated in Figure 14 The process occurring due to the zinc oxide is known to develop the substance after the rapid oxidation of the coating by combining with the fatty acid present in the binder [35]. Nonetheless, after a certain period, the substance will inevitably be used up which causes a drop in its defensive ability. For the parameter of Cc, the trend of lower values can be observed in the immersion period of 20 days to 40 days for P2 as compared to other coatings. The result denotes the low amount of electrolytes detected in the coating. However, similar to the 
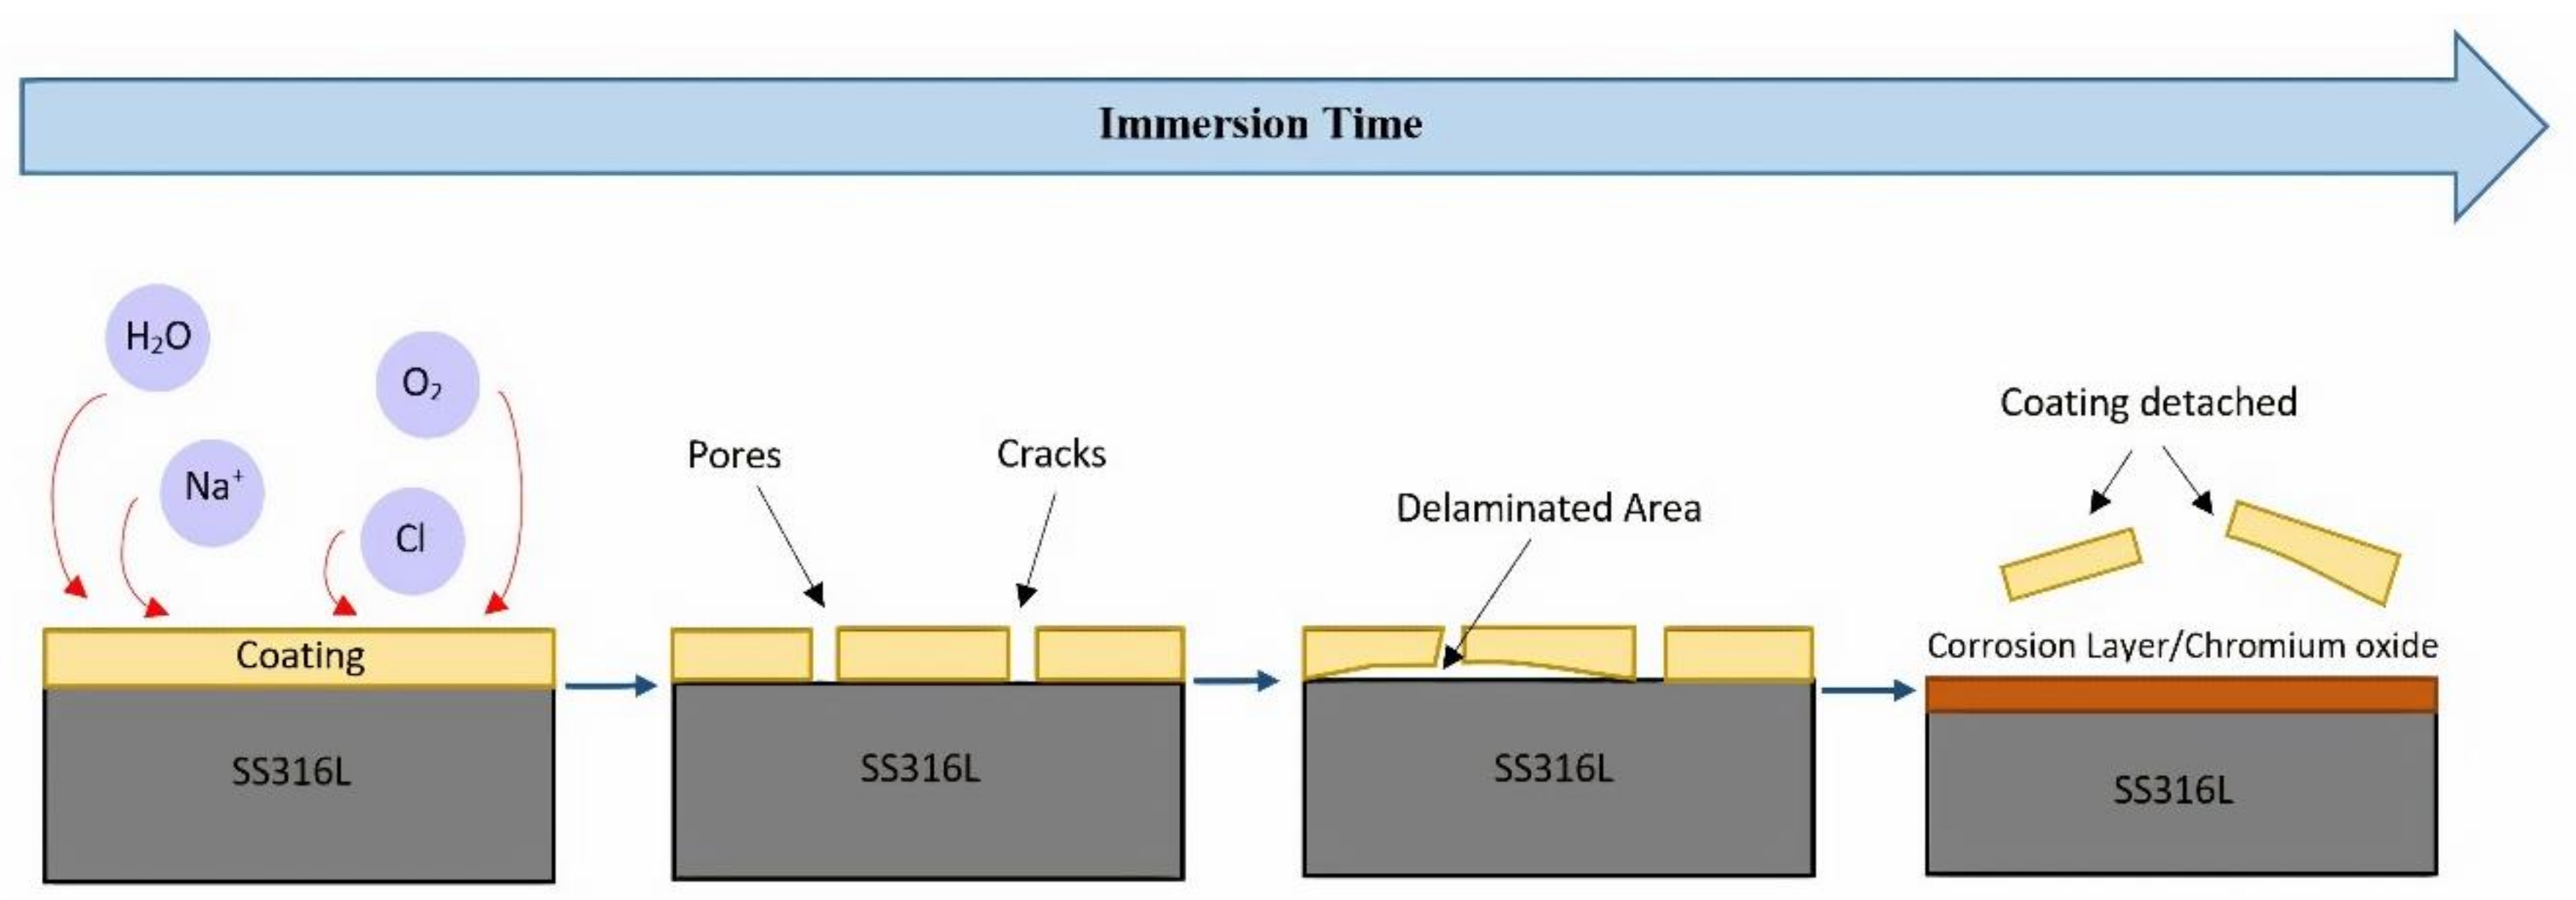
Rc value at 50 days, a fluctuation was identified where it could be ascribed to the condition of pigments being used up. The prolonged immersion period provides some useful information on the degradation process of organic coating. As the outer layer of coating has been breached, three pathways will be formed by electrolytes which are free volume, micro-porosity and large voids. These pathways are produced through different reactions but served a similar purpose—to dig and reach the surface of the protected substrate. The process involved the diffusion and ion exchange between the electrolytes and the hydrophilic parts of the coating, leading to the formation of a delaminated area and the end result of detachment from the substrate, as illustrated in Figure 1 [36,37].
For the Rct and Cdl parameters that describe the occurrence at the interface of coating/metal, no fluctuation was observed during the initial stage (10 days) to the last stage (50 days) of the immersion test. In fact, similar to the previously discussed parameter, Rct displayed a tremendous increase (10 days, Rct = 6.32 × 10³ Ω; 20 days, Rct = 16.80 × 10³ Ω; 30 days, Rct = 529.00 × 10³ Ω) in its resistance values up to 30 days and only began to drop after 40 days of interval. A similar course of the phenomenon was also displayed by Cdl throughout the immersion period, which denotes that P2 has the lowest amount of the delaminated area formation in respect to other coatings. Overall, P2 with 3 wt.% LLE showed the best performance in terms of the obtained impedance measurement. The conclusion also suggests that P2 has the best ionic resistance and barrier properties of the formulated coatings.

3.5. Potentiodynamic Polarization

The potentiodynamic polarization is a corrosion study focusing on the changes of the anodic and cathodic polarization. Several measured parameters include corrosion potential (Ecorr), corrosion current density (icorr), and corrosion rate (CR). The Ecorr usually denotes the dominant inhibitive action of the targeted material. There are three possible inhibitive actions, which are anodic, cathodic, and mixed types. In contrast, the icorr measures the susceptibility of corrosion, and when there is a significant drop in its value, the phenomenon means that the coating induced a mixed type of inhibitive action. As for CR, it displayed the rate of corrosion throughout the surface of the metal, which may occur after 1 year of being exposed to a particular solution. Figure 15 shows the Tafel plots obtained from the analysis for the coated and uncoated substrates during the immersion test. The corresponding data are tabulated in Table 8. After 10 days of immersion test, the best performance was displayed by P2 with 3 wt.% LLE where there is a significant drop for both icorr (1.63 × 10⁻⁵ A∙cm2) and CR (2.71 × 10⁻² mm/year) values. The Ecorr also shifted towards the more negative side as compared to the bare metal, and this indicates that P2 is a mixed type inhibitor with preferable action on the cathodic region. The trend of optimum performance of P2 followed the same pattern for icorr and CR till the period of 50 days with no significant fluctuation (20 days, icorr = 2.50 × 10⁻⁶ A∙cm2 and CR = 4.17 × 10⁻³ mm/year; 30 days, icorr = 8.31 × 10⁻⁶ A∙cm2 and CR = 1.38 × 10⁻² mm/year; 40 days, icorr = 4.18 × 10⁻⁶ A∙cm2 and CR = 6.99 × 10⁻³ mm/year; 50 days, icorr = 4.57 × 10⁻⁷ A∙cm2 and CR = 7.63 × 10⁻⁴ mm/year). Although P2 illustrated the optimum efficiency, based on the recorded readings, there was a substantial drop in the parameters with respect to the increased duration of the immersion period. The situation is a common trend for coating exposed to a harsh environment, since the barrier will not be able to hold on forever in resisting the attacks of corrosive electrolytes. However, it is evident that the addition of 3 wt.% LLE critically enhanced the general impedance performance of P2, when compared to the other formulated coatings.

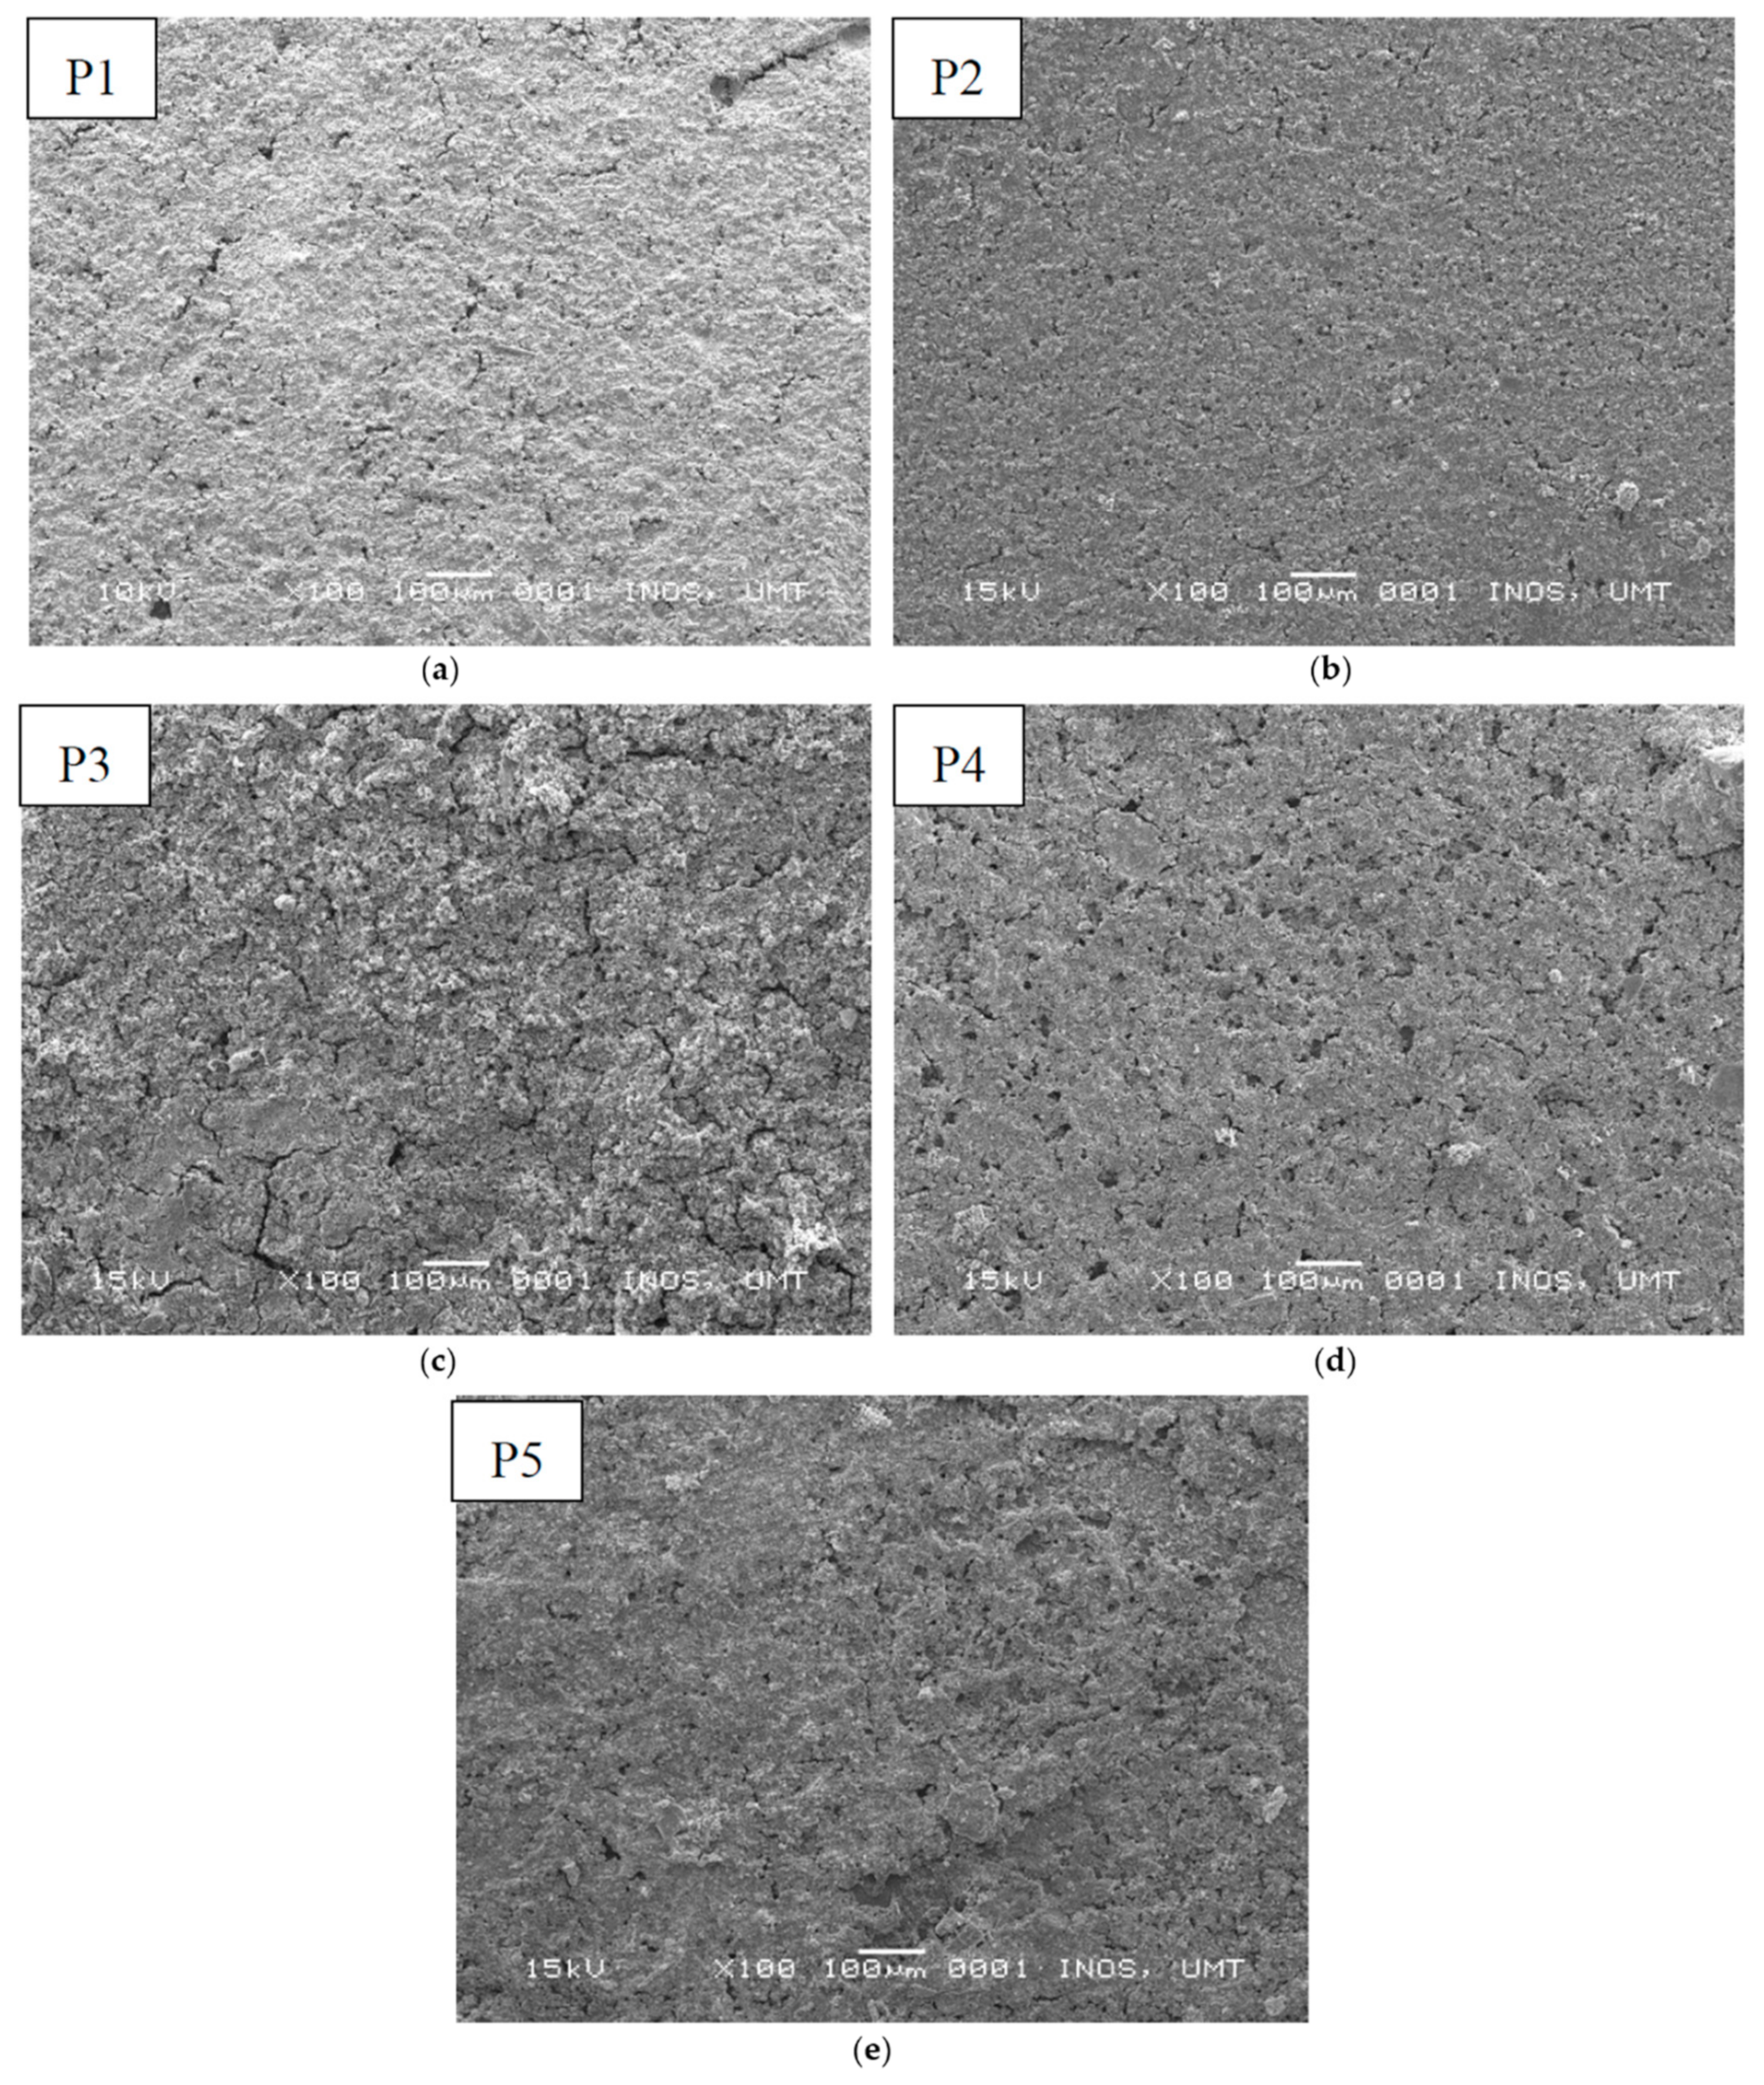
3.6. Scanning Electron Microscope with Energy Dispersive X-ray (SEM/EDX)

Through the SEM/EDX evaluation of the morphological condition and the distribution of the elements on the coated substrates, the result can be used to make a correlation with the previous impedance and polarization characterizations. Samples immersed on the site were collected after 60 days and analysed. The obtained micrographs are shown in Figure 16, and the percentage of elements distribution on P2 is tabulated in Table 9. Based on Figure 16, P2 with the best performance in respect to the previous data displayed a rather smooth surface with small amounts of cracks. In comparison to the other coatings with LLE, P3 and P5 were discerned to have very rough surfaces with multiple cracks. Additionally, P4 with 9 wt.% LLE has a slight difference; instead of cracks, the surface has a lot of pores or holes, which signified the entrance of the electrolytes. The observable rough surface of all coatings is attributed to the severe degradation that occurred after 60 days of being exposed to seawater. Due to a large number of percolation networks formed at the bottom of the coatings layer, more electrolytes have been able to pass through and accumulate to form the delaminated area. Hence, this caused the condition where the layer of the coating seems to become a bit of swelling. The response also indicates that P3 and P5 probably have lost the majority of their adhesive ability, and will soon detach entirely from the metal surface. As for P2, although the surface was in a better state, the identifiable defects mean that the coating will also possess a similar issue if the immersion period is prolonged.
As for the elemental distribution analysis, according to Table 9, the primary elements present on the P2 surface were sodium (Na) and chloride (Cl), while the minor elements included chromium (Cr) and nickel (Ni). The reason for selecting the analysis on both Cr and Ni is because these are the main elements formed in the composition of the passive or corrosion layer by SS316L. The detected Na and Cl were due to salt deposition, which usually occurs on the surface of the solid coating. The importance of the identification of Cr and Ni also lies in their harmful effects on the environment. As mentioned by various studies, Cr is a well known substance that can have lethal effects on aquatic life, such as fish [38]. Thus, the low percentage identified for these elements represent the good barrier quality of the coating in preventing the formation of rust and exposing the harmful materials to the environment.

4. Conclusions

(1)
As a conclusion, the FTIR and XRD analyses revealed the presence of multiple functional groups (e.g., –OH and C=O) with essential heteroatoms, and provided an understanding of the nature of coatings when incorporated with the crude extract of river tamarind. Besides, the XRD analysis revealed an increase in the crystallinity of the coating with 3 wt.% LLE.
(2)
The antimicrobial screening showed that most of the samples tested displayed a good degree of microbial inhibitory action towards the S. aureus (+) and P. aeruginosa (−) bacteria. The most outstanding performance was shown by the crude extract of LLE towards P. aeruginosa (−) with the highest value of resistance. Additionally, the test conducted in a real environment produced a remarkable result, where a coated substrate displayed no attachment of unwanted solid, and hence validated the coating’s ability to reduce fouling reaction.
(3)
The polarization and mainly the impedance study highlighted the P2 samples with 3 wt.% LLE as the best coating able to protect the stainless steel for near two months in seawater. These samples also presented a smooth surface with a negligible presence of Cr and Ni elements, suggesting low oxide formation on the SS316L surface.

Author Contributions

Conceptualization, methodology, software, formal analysis, visualization and investigation, W.M.I.W.M.K. and M.F.M.F.; validation, W.R.W.A. and W.M.N.W.N.; resources, M.S.M.G. and M.S.S.; data curation, M.F.R.Z.; writing—original draft preparation, review and editing, W.M.I.W.M.K. and M.S.M.G.; supervision, project administration and funding acquisition, M.S.M.G. All authors have read and agreed to the published version of the manuscript.

Funding

This research was funded by the Ministry of Higher Education (Malaysia) through the Fundamental Research Grant Scheme (Award no. FRGS/1/2018/WAB09/UMT/02/2, Vot no. 59537).

Acknowledgments

The authors extend an appreciation for the support of analytical analysis and testing centre of Universiti Malaysia Terengganu.

Conflicts of Interest

The authors declare no conflict of interest.

References

  1. Valdez, B.; Ramirez, J.; Eliezer, A.; Schorr, M.; Ramos, R.; Salinas, R. Corrosion assessment of infrastructure assets in coastal seas. J. Mar. Eng. Technol. 2016, 15, 124–134. [Google Scholar] [CrossRef] [Green Version]
  2. Shokry, H. Corrosion protection of mild steel electrode by electrochemical polymerization of acrylamide. Chem. Met. Alloy. 2009, 2, 202–210. [Google Scholar] [CrossRef]
  3. Jia, R.; Wang, D.; Jin, P.; Unsal, T.; Yang, D.; Yang, J.; Xu, D.; Gu, T. Effects of ferrous ion concentration on microbiologically influenced corrosion of carbon steel by sulfate reducing bacterium Desulfovibrio vulgaris. Corr. Sci. 2019, 153, 127–137. [Google Scholar] [CrossRef]
  4. Marciales, A.; Peralta, Y.; Haile, T.; Crosby, T.; Wolodko, J. Mechanistic microbiologically influenced corrosion modeling—A review. Corr. Sci. 2018, 146, 99–111. [Google Scholar] [CrossRef]
  5. Zakowski, K.; Narozny, M.; Szocinski, M.; Darowicki, K. Influence of water salinity on corrosion risk—The case of the southern Baltic Sea coast. Environ. Monit. Assess. 2014, 186, 4871–4879. [Google Scholar] [CrossRef] [PubMed] [Green Version]
  6. Coetser, S.; Cloete, T.E. Biofouling and biocorrosion in industrial water systems. Crit. Rev. Microbiol. 2005, 31, 213–232. [Google Scholar] [CrossRef] [Green Version]
  7. Heyer, A.; D’Souza, F.; Morales, C.L.; Ferrari, G.; Mol, J.; De Wit, J. Ship ballast tanks a review from microbial corrosion and electrochemical point of view. Ocean Eng. 2013, 70, 188–200. [Google Scholar] [CrossRef]
  8. Sreekumari, K.R.; Sato, Y.; Kikuchi, Y. Antibacterial Metals—A Viable Solution for Bacterial Attachment and Microbiologically Influenced Corrosion. Mater. Trans. 2005, 46, 1636–1645. [Google Scholar] [CrossRef] [Green Version]
  9. Abdolahi, A.; Hamzah, E.; Ibrahim, Z.; Hashim, S. Microbially influenced corrosion of steels by Pseudomonas aeruginosa. Corros. Rev. 2014, 32, 129–141. [Google Scholar] [CrossRef]
  10. Hamzah, E.; Hussain, M.Z.; Ibrahim, Z.; Abdolahi, A. Influence of Pseudomonas aeruginosa bacteria on corrosion resistance of 304 stainless steel. Corros. Eng. Sci. Technol. 2013, 48, 116–120. [Google Scholar] [CrossRef]
  11. Abdel-Gaber, A.; Abd-El-Nabey, B.; Sidahmed, I.; El-Zayady, A.; Saadawy, M. Inhibitive action of some plant extracts on the corrosion of steel in acidic media. Corros. Sci. 2006, 48, 2765–2779. [Google Scholar] [CrossRef]
  12. Nardeli, J.V.; Fugivara, C.S.; Taryba, M.; Pinto, E.R.; Montemor, M.; Benedetti, A.V. Tannin: A natural corrosion inhibitor for aluminum alloys. Prog. Org. Coat. 2019, 135, 368–381. [Google Scholar] [CrossRef]
  13. Hajar, H.M.; Zulkifli, F.; Suriani, M.; Sabri, M.G.M.; Nik, W.N.W. Lawsonia Lnermis extract enhances performance of corrosion protection of coated mild steel in seawater. In Proceedings of the MATEC Web of Conferences EDP Sciences, Phuket, Thailand, 1–2 May 2016; pp. 1–8. [Google Scholar]
  14. Pandian, B.R.; Sethuraman, M.G. Solanum tuberosum as an inhibitor of mild steel corrosion in acid media. Iran J. Chem. Chem. Eng. 2009, 28, 77–84. [Google Scholar]
  15. Ikhmal, W.M.K.W.M.; Yasmin, M.Y.N.; Fazira, M.F.M.; Rafizah, W.A.W.; Nik, W.B.W.; Sabri, M.G.M. Anticorrosion coating using Olea Sp. leaves extract. In Proceedings of the IOP Conference Series: Materials Science and Engineering, Universiti of Lampung, Bandar Lampung, Indonesia, 18–20 September 2017; IOP Publishing: Bristol, UK, 2018; pp. 1–11. [Google Scholar]
  16. Winkler, D.A. Predicting the performance of organic corrosion inhibitors. Metals 2017, 7, 553. [Google Scholar] [CrossRef] [Green Version]
  17. Voyutskii, S.S. The Diffusion Theory of Adhesion. Rubber Chem. Technol. 1960, 33, 748–756. [Google Scholar] [CrossRef]
  18. Awe, F.; Giwa-Ajeniya, A.; Akinyemi, A.; Ezeri, G. Phytochemical analysis of Acalypha wilkesiana, Leucaena leucocephala, Pepperomia pellucida and Senna alata leaves. Int. J. Eng. Sci. 2013, 2, 41–44. [Google Scholar]
  19. Zayed, M.; Samling, B. Phytochemical constituents of the leaves of Leucaena leucocephala from Malaysia. Int. J. Pharm. Pharm. Sci. 2016, 8, 174–179. [Google Scholar] [CrossRef]
  20. Zarina, Z.; Ghazali, C.; Sam, S. Characterization analysis for leaves of Leucaena Leucocephala by using phytochemical screening assay. In Proceedings of the AIP Conference, Krabi, Thailand, 29–30 April 2017; AIP Publishing: Melville, NY, USA, 2017; pp. 1–8. [Google Scholar]
  21. Hassan, R.; Tawfik, W.; Abou-Setta, L. The flavonoid constituents of Leucaena Leucocephala growning in Egypt, and their biological activity. Afr. J. Tradit. Complement. Altern. Med. 2014, 11, 67–72. [Google Scholar] [CrossRef] [Green Version]
  22. Muthukrishnan, P.; Jeyaprabha, B.; Prakash, P. Corrosion inhibition of Leucaena leucocephala pod on mild steel in sulphuric acid solution. Acta Metall. Sin-Engl. 2013, 26, 416–424. [Google Scholar] [CrossRef] [Green Version]
  23. Savaloni, H.; Agha-Taheri, E.; Abdi, F. On the corrosion resistance of AISI 316L-type stainless steel coated with manganese and annealed with flow of oxygen. J. Theo. Appl. Phys. 2016, 10, 149–156. [Google Scholar] [CrossRef] [Green Version]
  24. ASTM Standard E3-11. Standard Guide for Preparation of Metallographic Specimens; ASTM International: West Conshohocken, PA, USA, 2011. [Google Scholar]
  25. Pérez, M.; García, M.; Ruiz, D.; Autino, J.C.; Romanelli, G.; Blustein, G. Antifouling activity of green-synthesized 7-hydroxy-4-methylcoumarin. Mar. Environ. Res. 2016, 113, 134–140. [Google Scholar] [CrossRef] [PubMed]
  26. Mostafaei, A.; Nasirpouri, F. Epoxy/polyaniline–zno nanorods hybrid nanocomposite coatings: Synthesis, characterization and corrosion protection performance of conducting paints. Prog. Org. Coat. 2014, 77, 146–159. [Google Scholar] [CrossRef]
  27. Velho-Pereira, S.; Kamat, N.M. Antimicrobial screening of actinobacteria using a modified cross-streak method. Indian J. Pharm. Sci. 2011, 73, 223–228. [Google Scholar] [PubMed] [Green Version]
  28. Calderón-Gutierrez, J.A.; Bedoya-Lora, F.E. Barrier property determination and lifetime prediction by electrochemical impedance spectroscopy of a high performance organic coating. Dyna 2014, 81, 97–106. [Google Scholar] [CrossRef]
  29. Lappi, H.; Alén, R. Pyrolysis of tall oil-derived fatty and resin acid mixtures. ISRN Renew. Energy 2012, 2012, 1–8. [Google Scholar] [CrossRef] [Green Version]
  30. Abidin, Z.; Naziron, N.; Nasir, K.; Rusli, M.; Lee, S.; Kufian, M.Z.; Majid, S.; Vengadaesvaran, B.; Arof, A.; Taha, R.; et al. Influence of curcumin natural dye colorant with PMMA-acrylic polyol blended polymer. Pigm. Resin Technol. 2013, 42, 95–102. [Google Scholar] [CrossRef] [Green Version]
  31. Liu, X.; Xiang, Z.; Niu, J.; Xia, K.; Yang, Y.; Yan, B.; Lu, W. The corrosion behaviors of amorphous, nanocrystalline and crystalline Ni-W alloys coating. Int. J. Electrochem. Sci. 2015, 10, 9042–9048. [Google Scholar]
  32. Aleaghil, S.A.; Fattahy, E.; Baei, B.; Saghali, M.; Bagheri, H.; Javid, N.; Ghaemi, E.A. Antibacterial activity of zinc oxide nanoparticles on Staphylococcus aureus. Int. J. Adv. Biotechnol. Res. 2016, 7, 1569–1575. [Google Scholar]
  33. Kadiyala, U.; Turali-Emre, E.S.; Bahng, J.H.; Kotov, N.A.; Vanepps, J.S.; Tulari-Emre, E.S. Unexpected insights into antibacterial activity of zinc oxide nanoparticles against methicillin resistant Staphylococcus aureus (Mrsa). Nanoscale 2018, 10, 4927–4939. [Google Scholar] [CrossRef]
  34. Henwood, C.J.; Livermore, D.M.; James, D.; Warner, M. The Pseudomonas Study Group: Antimicrobial susceptibility of Pseudomonas aeruginosa: Results of a UK survey and evaluation of the british society for antimicrobial chemotherapy disc susceptibility test. J. Antimicrob. Chemother. 2001, 47, 789–799. [Google Scholar] [CrossRef]
  35. Osmond, G. Zinc white: A review of zinc oxide pigment properties and implications for stability in oil-based paintings. AICCM Bull. 2012, 33, 20–29. [Google Scholar] [CrossRef]
  36. González, M.G.; Cabanelas, J.C.; Baselga, J. Applications of FTIR on epoxy resins-identification, monitoring the curing process, phase separation and water uptake. In Infrared Spectroscopy-Materials Science, Engineering and Technology; InTech: London, UK, 2012. [Google Scholar]
  37. Lin, Y.; Chen, X. Investigation of moisture diffusion in epoxy system: Experiments and molecular dynamics simulations. Chem. Phys. Lett. 2005, 412, 322–326. [Google Scholar] [CrossRef]
  38. Velma, V.; Vutukuru, S.; Tchounwou, P.B. Ecotoxicology of hexavalent chromium in freshwater fish: A critical review. Rev. Environ. Health 2009, 24, 129–146. [Google Scholar] [CrossRef] [PubMed] [Green Version]
Figure 1. The degradation process of coating.
Coatings 10 00825 g001
Figure 2. Equivalent electric circuit model for (a) bare and (b) coated samples.
Coatings 10 00825 g002
Figure 3. FTIR spectrum of WW rosin.
Coatings 10 00825 g003
Figure 4. IR spectra of the WW rosin and coatings with different LLE wt.%.
Coatings 10 00825 g004
Figure 5. Molecular composition of the abietic acid.
Coatings 10 00825 g005
Figure 6. Molecular composition of catechol.
Coatings 10 00825 g006
Figure 7. Possible complexes for WW rosin and LLE.
Coatings 10 00825 g007
Figure 8. XRD spectrum of the (a) ZnO and (b) CaCO3 powder.
Coatings 10 00825 g008
Figure 9. XRD spectra of coatings with the different wt.% LLE.
Coatings 10 00825 g009
Figure 10. Inhibition efficiency of the coating components against the (a) S. aureus (+) and (b) P. aeruginosa (−) bacteria.
Coatings 10 00825 g010
Figure 11. Inhibition efficiency of different coatings against the (a) S. aureus (+) and (b) P. aeruginosa (−) bacteria.
Coatings 10 00825 g011
Figure 12. Surface of (a) the uncoated and (b) the coated SS316L after 30 days of immersion (coupon dimension: 25 mm × 25 mm × 3 mm).
Coatings 10 00825 g012
Figure 13. Nyquist plots of the coated and uncoated SS316L at (a) 10, (b) 20, (c) 30, (d) 40 and (e) 50 days of the immersion test at Setiu, Terengganu, Malaysia.
Coatings 10 00825 g013
Figure 14. Formation of zinc soap during the rapid oxidation of the coating.
Coatings 10 00825 g014
Figure 15. Tafel plots of the coated and the uncoated SS316L at (a) 10, (b) 20, (c) 30, (d) 40 and (e) 50 days of the immersion test at Setiu, Terengganu, Malaysia.
Coatings 10 00825 g015
Figure 16. SEM images of the coatings after 60 days of immersion in seawater: (a) P1 with 0 wt.% LLE; (b) P2 with 3 wt.% LLE; (c) P3 with 6 wt.% LLE; (d) P4 with 9 wt.% LLE; (e) P5 with 12 wt.% LLE.
Coatings 10 00825 g016
Table 1. Chemical composition of SS316L.
ElementCMnPSSiCrNiMoNFe
%0.03 max2.00 max0.045 max0.03 max0.75 max16.00–18.0010.00–14.002.00–3.000.10 maxBalance
Table 2. Coating formulation by wt.%.
Component/PaintP1P2P3P4P5
WW Rosin49.149.149.149.149.1
MIBK20.020.020.020.020.0
CaCO310.910.910.910.910.9
ZnO20.017.014.011.08.0
LLE036912
Table 3. Parameters of the seawater.
ParameterAverage ValueStandard Deviation
pH8.10.22608
Salinity (ppt)26.40.28752
Conductivity (mS)43.70.34335
Table 4. Peaks properties of WW rosin.
Wavenumber
(cm−1)
BondFunctional GroupAppearance
3296R–OH stretchAlcoholStrong and broad
2964C–H stretchAlkylWeak
2088C≡C stretchAlkynesWeak
1718C=O stretchKetoneSaturated
1600C=C stretchAlkenesWeak
1257C–O stretchAromatic esterStrong
1070C–O stretchPrimary alcoholStrong
Table 5. Inhibition zone for the coating components.
SampleAverage Diameter of Inhibition Zone (mm)
S. aureus (+)Efficiency, η (%)Standard DeviationP. aeruginosa (−)Efficiency, η (%)Standard Deviation
Antibiotic (gentamicin)40.0100030.01000
WW Rosin9.022.51.4414.046.75.10
Calcium carbonate6.015.00.017.023.31.91
Zinc oxide12.030.01.446.020.00.01
MIBK9.022.51.447.023.31.91
LLE9.022.51.4420.066.71.91
Table 6. Inhibition zone of coatings.
SampleAverage Diameter of Inhibition Zone (mm)
S. aureus (+)Efficiency, η (%)Standard DeviationP. aeruginosa (−)Efficiency, η (%)Standard Deviation
Antibiotic (gentamicin)40.0100030.01000
P1 (0%)15.037.53.828.026.71.96
P2 (3%)18.045.01.448.026.70.01
P3 (6%)16.040.01.449.030.01.91
P4 (9%)18.045.01.4410.033.35.08
P5 (12%)18.045.03.8211.036.73.50
Table 7. Impedance parameters.
Immersion (days)wt.% LLE in CoatingCoating Resistance, Rc (Ω)Coating Capacitance, Cc (F)Charge Transfer Resistance, Rct (Ω)Double-Layer Capacitance, Cdl (F)
10Bare--5.15 × 103131.00 × 10−6
02.07 × 103115.00 × 10−95.10 × 1030.92 × 10−9
31.79 × 10327.9 × 10−96.32 × 1033.35 × 10−6
61.15 × 10387.90 × 10−92.42 × 1032.95 × 10−6
90.70 × 1031.16 × 10−63.48 × 1038.01 × 10−6
121.85 × 10319.20 × 10−92.95 × 10371.50 × 10−9
20Bare--6.23 × 10379.20 × 10−6
01.02 × 1030.16 × 10−61.82 × 1032.57 × 10−6
36.17 × 10333.0 × 10−916.80 × 1030.80 × 10−6
60.50 × 1030.88 × 10−61.32 × 1035.05 × 10−6
90.20 × 1031.30 × 10−60.80 × 10310.10 × 10−6
120.30 × 1031.43 × 10−61.70 × 1039.28 × 10−6
30Bare--3.40 × 10385.50 × 10−6
02.13 × 103131.00 × 10−95.10 × 1034.20 × 10−6
379.80 × 10312.00 × 10−9529.00 × 1030.64 × 10−6
61.19 × 103251.00 × 10−96.06 × 103642.00 × 10−9
90.70 × 103759.00 × 10−95.74 × 1038.29 × 10−6
121.86 × 103589.00 × 10−97.30 × 1034.39 × 10−6
40Bare--14.2 × 1030.27 × 10−6
00.95 × 103329.00 × 10−91.47 × 1034.35 × 10−6
32.90 × 10361.30 × 10−96.32 × 1030.73 × 10−6
61.01 × 103231.00 × 10−91.46 × 1034.43 × 10−6
92.40 × 10372.00 × 10−98.52 × 1030.39 × 10−6
121.00 × 103201.00 × 10−94.82 × 1030.69 × 10−6
0Bare--2.04 × 10314.60 × 10−6
01.18 × 10369.60 × 10−92.33 × 1030.26 × 10−6
34.00 × 103151.00 × 10−918.50 × 1033.54 × 10−6
65.74 × 10367.50 × 10−916.10 × 1030.60 × 10−6
90.85 × 103193.00 × 10−91.79 × 1031.37 × 10−6
120.55 × 103669.00 × 10−94.25 × 1033.77 × 10−6
Table 8. Polarization parameters.
Immersion (days)wt.% LLE in CoatingCorrosion Potential, Ecorr (V)Corrosion Current Density, icorr (A.cm2)Corrosion Rate, CR (mm/year)
10Bare−0.2962.07 × 10−40.35
0−0.4362.11 × 10−53.60 × 10⁻²
3−0.4441.63 × 10−52.71 × 10⁻²
6−0.3973.25 × 10−55.42 × 10⁻²
9−0.3692.23 × 10−53.73 × 10⁻²
12−0.4482.48 × 10−54.14 × 10⁻²
20Bare−0.2981.91 × 10−40.32
0−0.3862.19 × 10−53.66 × 10⁻²
3−0.4732.50 × 10−64.17 × 10⁻³
6−0.4905.18 × 10−58.67 × 10⁻²
9−0.3998.23 × 10−513.76 × 10⁻²
12−0.4493.26 × 10−55.44 × 10⁻²
30Bare−0.5883.06 × 10−65.12 × 10⁻³
0−0.4416.48 × 10−510.83 × 10⁻²
3−0.4188.31 × 10−61.38 × 10⁻²
6−0.4121.17 × 10−51.95 10−2
9−0.3943.10 × 10−55.18 × 10⁻²
12−0.3991.02 × 10−51.70 × 10⁻²
40Bare−0.4594.55 × 10−67.61 × 10⁻³
0−0.4691.25 × 10−420.93 × 10⁻²
3−0.5644.18 × 10−66.99 × 10⁻³
6−0.4236.31 × 10−510.51 × 10⁻²
9−0.3651.56 × 10−426.14 × 10⁻²
12−0.3178.38 × 10−514.00 × 10⁻²
50Bare−0.4571.88 × 10−40.31
0−0.4531.82 × 10−53.04 × 10⁻²
3−0.3474.57 × 10−77.63 × 10⁻⁴
6−0.4019.18 × 10−61.54 × 10⁻²
9−0.4094.01 × 10−56.71 × 10⁻²
12−0.4141.76 × 10−52.94 × 10⁻²
Table 9. Distribution of the elements on P2 after 60 days of immersion in seawater.
ElementMass (%)
Na60.70
Cl31.86
Cr0.01
Ni7.43
Total100

