


ABSTRACT
We have investigated the evolutionary status of the visual binary 85 Peg (HD 224930) using a high-resolution spectroscopic analysis and the astrometric calibration of the stellar parameters. In spite of well-determined stellar parameters from HIPPARCOS astrometry and from spectroscopy, 85 Peg has for a long time revealed peculiar properties when attempts have been made to combine an evolutionary model with observation. There has been a chronic problem of the mass ratio of the two components when comparing 85 Peg's dynamical properties to the photometric magnitude difference. Moreover, 85 Peg has been suspected to have unique characteristics in its chemical composition. In order to determine accurate spectroscopic abundances, we have obtained high-resolution echelle spectra for 85 Peg. From our elemental analysis, we found that 85 Peg is α-enhanced with respect to the scaled solar abundance by a factor of 2. We then produced, within the framework of the standard stellar theory, grids of stellar model using the most recent observational results. To avoid many-fold degeneracy among physical quantities, a statistical minimization test was carried out between theoretical model grids. Enforcing consistency between the modeling and statistical constraints, we derived a reliable set of physical parameters and confirmed the trinarity of the system. In the context of asteroseismology, the theoretical frequency spectrum of 85 Peg was calculated. 85 Peg A is expected to have a first order spacing Δν ∼ 165 μHz at the reference frequency ν0 = 790 μHz.
Export citation and abstract BibTeX RIS
1. INTRODUCTION
85 Peg (HD 224930, HIP171) has been known to be a visual and single-lined spectroscopic binary system in the solar neighborhood. Since the first detection by Burham (1879), 85 Peg has been well studied for more than a century. Its proximity (∼12 pc) and brightness (MV∼ 5.75) permit a highly accurate determination of the orbital elements from HIPPARCOS parallax data (Söderhjelm 1999). Through a detailed spectrophotometric analysis, Griffin (2004) provides a comprehensive review of the physical properties and orbital elements of the system, including a well-defined distance, an orbital period (∼26.31 yr), and a total mass (∼1.49 M☉). The orbital elements and physical parameters of the 85 Peg system are compiled in Table 1.
Table 1. Astrometric Parameters and Physical Properties of 85 Peg
| Parameters | Values | |
|---|---|---|
| P (yr) | 26.31± 0.01 | |
| a | 0 83 ± 001 83 ± 001 | |
| i | −49° ± 1° | |
| e | 0.38 ± 0.01 | |
| π (mas) | 0.0796 ± 0.003 | |
| γ (km s−1) | −36.22 ± 0.03 | |
| K1 (km s−1) | 4.49 ± 0.05 | |
| a1sin i (au) | 3.68 ± 0.04 | |
| Mtot/M☉ | 1.49 ± 0.1 | |
| 85 Peg A | 85 Peg B | |
| Teff (K) | 5600 ± 50 | 4200 ± 200 |
| MV | 5.39 ± 0.04 | 8.47 ± 0.29 |
| L/L☉ | 0.617 ± 0.02 | 0.072 ± 0.03 |
| [M/H] | −0.7 ± 0.1 | |
| log g | 4.6 ± 0.1 | |
References. (1) Söderhjelm 1999; (2) Griffin 2004; (3) C. Van't Veer et al. 2005, private communication.
Download table as: ASCIITypeset image
In spite of a set of precisely observed parameters, 85 Peg presents the abnormal property that the fainter secondary is equally or slightly more massive than the primary (Hall 1948). Indeed, there has been a discrepancy between the mass ratio determined from the photometric magnitude difference (ΔMV∼ 3.08) and that from the spectroscopic orbit analysis. The value of the reduced mass (μ = m2/(m1+m2)) on the basis of the photometric magnitude difference is μ∼ 0.38. From astrometric and spectroscopic analysis, however, the reduced mass was confirmed to be μ∼ 0.48 (Griffin 2004). Moreover, the small angular separation (a∼ 083) makes it difficult to determine the accurate individual mass of each component. This disagreement has been ascribed to the existence of an undetected tertiary, that is, 85 Peg B itself is a binary system (Hall 1948).
Furthermore, 85 Peg has been a serious problem in the context of stellar evolution. In studies of solar neighborhood stars, Perrin et al. (1977) found 85 Peg to be anomalous in its chemical composition, especially in its helium abundance. The influence of the helium abundance on the mass determination is crucial, but it is not possible to measure helium directly from spectroscopy since helium lines cannot be detected in the spectrum of the 85 Peg stars.
In order to overcome these anomalies, a series of theoretical calibrations has been performed by modeling the stellar parameters of 85 Peg (Fernandes et al. 2002; D'Antona et al. 2005; Bach et al. 2007). In the study of nearby visual binary stars, Fernandes et al. (1998) have discussed the importance of the helium content and heavy element mixture of 85 Peg to derive its evolutionary status. Subsequently, Fernandes et al. (2002) found an evolutionary solution for the age (∼9.3 Gyr) and for the individual masses (mA, mB) ∼ (0.88 M☉, 0.55 M☉), assuming an initial chemical composition and mixing-length calibration. Recently in a detailed review, D'Antona et al. (2005) suggested appropriate constraints for the mass range (0.75 ∼ 0.84 M☉) and the age (8 ∼ 14 Gyr) by testing various models for 85 Peg. They also computed the p-mode oscillation frequencies from their possible models of the primary star. Bach et al. (2007) presented calibrated stellar parameters taking into account microscopic diffusion and updated opacities in their evolutionary model construction. All of these surveys strengthened the possibility that 85 Peg is a triple system (see Table 2).
Table 2. Previous Theoretical Models for 85 Peg A
| References | MA | MB | MBb | Age (Gyr) | Y0 | Z0 | αMLT |
|---|---|---|---|---|---|---|---|
| Fernandes et al. | 0.88 M☉ | 0.55 M☉ | 0.11 M☉ | 9.3 | 0.253 | 0.004 | 1.8 |
| D'antona et al. | 0.75 M☉ | 0.52 M☉ | 0.22 M☉ | 14 | 0.24 | 0.006 | 1.7 |
| 0.82 M☉ | 0.52 M☉ | 0.15 M☉ | 8 | 0.24 | 0.004 | 1.7 | |
| Bach et al. | 0.80 M☉ | 0.53 M☉ | 0.16 M☉ | 8.4 | 0.24 | 0.0045 | 1.4 |
References. (1) Fernandes et al. 2002; (2) D'Antona et al. 2005; (3) Bach et al. 2007.
Download table as: ASCIITypeset image
Spectroscopic analysis for elemental abundance determination is a crucial ingredient for stellar physics. Moreover, studies of chemical composition of late-type stars play a crucial role in improving our understanding of galactic and cosmic evolution. High-resolution spectroscopy permits the precise determination of relative abundances with respect to iron. In the case of the 85 Peg system, the α-element enhanced mixture is one of the main factor in its properties. Van't Veer et al. (1999) reported the probability of enhancement ([α/Fe] ∼ 0.3) through abundance analysis of the 3 α-elements (Ca, Si, and Ti). They derived the effective temperature (5600 K), surface gravity (log g ∼ 4.6), and the chemical composition of 85 Peg A by fitting the Balmer line wings. Among studies (Fernandes et al. 2002; D'Antona et al. 2005; Bach et al. 2007) in which the 85 Peg models were constructed, only Fernandes et al. (2002) took into account α-enhancement. In this paper, we have determined the full set of the chemical composition of 85 Peg using high-resolution spectroscopic observations made at the Bohyunsan Optical Astronomical Observatory (BOAO) in Korea.
Due to its trinarity and unusual chemical mixture, 85 Peg has been one of the most interesting stellar systems. It is listed as one of the main target of the MOST asteroseismology mission (Walker et al. 2003). The detection and interpretation of its p-mode oscillation frequencies will provide a good constraint on the mass of 85 Peg A and on its evolutionary status. Moreover, the well-defined stellar and atmospheric parameters will provide a deeper insight into stellar structure and evolution.
The aim of the present paper is (1) to determine the chemical abundances through a high-resolution spectroscopic observation, (2) to constrain the physical dimensions through a consistent modeling based on the stellar theory, and (3) to compute the possible spectrum of oscillation modes of 85 Peg A.
2. OBSERVATION AND REDUCTION
In order to determine the chemical composition of 85 Peg, we have obtained high-resolution echelle spectra for 85 Peg with Bohyunsan Optical Echelle Spectrograph (BOES; Kim et al. 2002b). BOES is a fiber-fed echelle spectrograph mounted on the 1.8 m telescope at the BOAO. The BOES detector is a EEV-CCD with 2048 × 4102 pixels with a size of 15 μm. There are three kinds of fiber sets with the aperture of 80 μm (11 in sky), 200 μm (29), and 300 μm (42), which corresponds to a spectral resolving power of R∼ 90,000, 44,000, and 30,000, respectively. We have observed 85 Peg with the largest aperture in order to minimize light loss and to get spectra with high signal-to-noise ratio (S/N). The resulting S/N ∼300 at 5000 Å with 900 s exposure.
The reductions were done following standard steps for echelle spectra using IRAF. Equivalent widths for most elements were measured by means of Gaussian fitting within IRAF/splot task. The local continuum for each line was defined by eye.
2.1. Atmospheric Parameters
Model atmospheres were constructed using the Kurucz model grids with a new opacity distribution function (ODF).4 Linux-ported ATLAS program (Sbordone et al. 2004) and MOOG (Sneden 1973) were used for model construction and for LTE abundance analysis, respectively. In the case of 85 Peg, an α-enhanced model ([α/Fe] = +0.4) was used as a starting model.
The weak Fe i and Fe ii lines with log(EW/λ) < −4.9 and EW ⩽100 mÅ were selected for the determination of atmospheric parameters and elemental analysis. For a self-consistent LTE line analysis, atmospheric parameters were determined through the following process: the value of effective temperature is adjusted so that there is no trend between the iron abundances from Fe i lines and from their lower level excitation potentials. Then the microturbulent velocity is determined to check out the correlation between Fe i line strengths and iron abundances derived from each line. Finally, the surface gravity is adjusted with respect to the iron abundances from Fe i and Fe ii. This process is iterated until the three parameters satisfy the above criteria simultaneously. The best-fit atmospheric parameters set for 85 Peg A were Teff = 5600 K; log g = 4.61; the microturbulence velocity, ξv = 1.79 km s−1; and the iron abundance, log εFe = 6.68.
2.2. Abundances
The newly determined relative abundances of each element are listed in Table 3. Elemental abundances were derived using LTE line analysis except carbon. The C abundance was derived through spectrum synthesis method using the CH molecular band near 4320 Å adopting molecular line data of Aoki et al. (2002). The oxygen abundance was derived from the O i triplet near 7770 Å and forbidden [O i] at 6300 Å. The forbidden [O i] lines are very weak (∼2 mÅ), but they are thought to be free from non-LTE (NLTE) effects.
Table 3. Chemical Abundances of 85 Peg
| Elements | [X/Fe] | log  |
Error | Lines |
|---|---|---|---|---|
| CH | −0.06 | 7.62 | 0.10 | ⋅⋅⋅ |
| O i | 0.34 | 8.49 | 0.03 | 3 |
| [O i] | 0.49 | 8.48 | 0.15 | 1 |
| Na i | 0.01 | 5.50 | 0.13 | 4 |
| Mg i | 0.31 | 7.04 | 0.13 | 2 |
| Al i | 0.07 | 5.73 | 0.06 | 2 |
| Si i | 0.24 | 6.99 | 0.06 | 19 |
| Ca i | 0.10 | 5.56 | 0.10 | 5 |
| Sc ii | 0.31 | 2.50 | 0.06 | 10 |
| Ti i | 0.18 | 4.04 | 0.14 | 7 |
| Ti ii | 0.36 | 4.30 | 0.14 | 13 |
| V i | 0.41 | 3.27 | 0.15 | 1 |
| V ii | 0.14 | 3.15 | 0.15 | 1 |
| Cr i | 0.07 | 4.67 | 0.13 | 2 |
| Mn i | −0.05 | 4.43 | 0.05 | 3 |
| Fe i | −0.76 | 6.68 | 0.08 | 112 |
| Co ii | −0.11 | 3.65 | 0.03 | 2 |
| Ni i | 0.03 | 5.44 | 0.08 | 6 |
Notes. The relative chemical abundances of 85 Peg are listed. The weak Fe i and Fe ii lines were used for determining atmospheric parameters, Teff = 5600 K, log g = 4.61, ξv = 1.79 km s−1, and log εFe = 6.68.
Download table as: ASCIITypeset image
Recent studies on NLTE effects have revealed that over-ionization by UV photons plays an important role in stellar atmospheres of metal-poor stars (Nissen et al. 1997; Fuhrmann 1998; Feltzing & Gustafsson 1998; Thévenin & Idiart 1999). According to Nissen et al. (1997), there is a discrepancy between spectroscopic log g deduced from LTE analysis and those from HIPPARCOS parallaxes. Surface gravities from HIPPARCOS were systematically overestimated. In their extensive calculation of statistical ionization equilibrium, Thévenin & Idiart (1999) quantitatively derived NLTE effects for late-type stars. In the case of metal-poor MS stars, Fe i line blocking decreases rapidly as the metal abundance decreases, and over-ionization becomes more important. Therefore, the over-ionization effect results in significantly underestimated metallicity and surface gravity. We followed his NLTE correction [Fe/H]NLTE ∼ [Fe/H]LTE + 0.15 dex and log gNLTE ∼ 4.58 for the 85 Peg system.
The derived abundance ratios of 85 Peg show typical features [α/Fe] = +0.3 of disk stars whose [Fe/H] = −0.6. Moreover, the relative enhancements of O, Mg, Si, Ca, and Ti are very similar to those of the standard stars HD 22879 and HD 76932 that were analyzed by Nissen et al. (1997). In Table 4, the relative abundance and atmospheric parameters of 85 Peg A were compared with nearby disk stars. Our analysis is in a good agreement with the previous work by Van't Veer et al. (1999) who derived three α-elements by using Hα and Hβ lines.
Table 4. Chemical Composition of Disk Stars and 85 Peg (HD 224930)
| [α/Fe] | |||||||||||
|---|---|---|---|---|---|---|---|---|---|---|---|
| Star | Teff (K) | log g | [Fe/H] | O | Mg | Si | Ca | Ti | Cr | Ni | Na |
| HD 17288 | 5714 | 4.44 | −0.88 | 0.28 | 0.24 | 0.17 | 0.17 | 0.16 | −0.03 | 0.01 | 0.08 |
| HD 17820 | 5807 | 4.24 | −0.67 | 0.25 | 0.25 | 0.19 | 0.19 | 0.20 | 0.03 | 0.03 | 0.17 |
| HD 22879 | 5851 | 4.36 | −0.82 | 0.30 | 0.29 | 0.20 | 0.19 | 0.19 | 0.00 | −0.01 | 0.09 |
| HD 76932 | 5914 | 4.23 | −0.85 | 0.30 | 0.30 | 0.20 | 0.20 | 0.21 | 0.00 | 0.00 | 0.11 |
| HD 106516 | 6269 | 4.51 | −0.61 | 0.25 | 0.29 | 0.19 | 0.17 | 0.18 | 0.02 | 0.00 | 0.09 |
| HD 224930a | 5600 | 4.61 | −0.76 | 0.34 | 0.31 | 0.24 | 0.10 | 0.18 | 0.07 | 0.03 | 0.01 |
Notes. Relative abundance of 85 Peg was compared with that of disk stars. Observational results of disk stars were obtained by Nissen et al. (1997). aDenotes the elemental analysis of the primary star in this work.
Download table as: ASCIITypeset image
3. MODELING AND CALIBRATION
3.1. Opacity, Equation of State, and Mixture
We have constructed model grids using the Yale stellar evolution code (YREC; Guenther et al. 1992). Input physics such as equation of state and opacities have been chosen according to the observed chemical composition of 85 Peg. In the interior, the OPAL opacity tables (Iglesias & Rogers 1996) were used. The Rosseland mean opacities were generated from the OPAL official Web site5 for the mixture shown in Table 3. For the outer region, low temperature opacities for the specific mixture were provided by Ferguson et al. (2005). Indeed, the two opacity sets are in a good agreement in the region of overlap.
Our models include diffusion processes due to gravitational settling and the thermal gradient. The microscopic diffusion of chemical elements significantly affects the internal structure by feeding helium into the core. Even for metal-poor low-mass stars, a small rate of diffusion can significantly modify surface constituents during their long lifetime. Therefore, we have considered microscopic metal diffusion as a standard prescription (Bahcall & Loeb 1990; Thoul et al. 1994) as well as helium diffusion. Because 85 Peg is a cool stellar system, radiative acceleration was practically negligible. Therefore, only gravitational settling of heavy elements is considered in modeling computation.
3.2. Mixing Length
In their outer envelope, the energy transport for late-type stars is mainly due to convection. Hitherto standard stellar evolution models have included the convective energy transport by using the classical mixing-length approximation of Böhm-Vitense (1958). This approximation was originally developed to describe convective efficiency of incompressible gas. The solar calibration suggests that the mixing-length parameter αMLT = l/Hp should be in the range between 1.5 and 2.0 (Cox & Giuli 1968). For a distant star, since the definite radius is not known, the mixing length itself is very uncertain. The super-adiabatic layers of the stellar atmosphere are very sensitive to the value of αMLT. A tiny change of mixing-length parameter causes a significant variation of the stellar thermal structure.
In spite of its extreme simplification of the convection phenomenon, the mixing-length approximation has proven to be a rather efficient scheme especially in one-dimensional stellar modeling and in the evolutionary context. A series of studies has revealed values of αMLT similar to those of the classical theory from the lower main-sequence slope of open clusters (VandenBerg & Bridges 1984), from the calibration of the well-observed detached binaries (VandenBerg & Hrivnak 1985; Kim 1999), and from the effective temperatures of red giant branch stars (Chieffi et al. 1995; VandenBerg et al. 2000; Alonso et al. 1999). There is no compelling observational evidence to support a variation of the mixing-length parameter with mass, chemical composition, or evolutionary state, though there is some support for modest variations in this parameter from recent theoretical work (see the next section). In our model grids for 85 Peg, convection was treated with MLT including αMLT calibration. The solar mixing-length parameter is calibrated to be α☉ ∼ 1.83 with the same input physics and the GS98 mixture (Grevesse & Sauval 1998).
3.3. Calibration of Stellar Parameters
The standard stellar evolution theory is based on the assumption that stars are single. In order to apply stellar evolutionary theory to binary stars, some kinds of conditions for guaranteeing the independent evolution are required. In the case of the 85 Peg system, each component is sufficiently separated (∼10 au), and remains in the hydrogen burning stage. Moreover, 85 Peg has a well-defined orbit, an accurate parallax, and a detailed spectrophotometric analysis. Based on this information, the 85 Peg system can be assumed to be coeval and of the same initial chemical composition.
The calibration of the stellar system is done by determining first the initial set of parameters for the primary star (m, Z/X, Y, αMLT, t)A, which satisfy present observations of the evolved parameter set (L, Teff, log g, [M/H]). Then, the set of parameters for the secondary star (m, αMLT)B is calculated. Because of the many-fold degeneracy among stellar physical parameters, there are many evolutionary tracks that are solutions at a given position in the H-R diagram. As an example, the conventional isochrone-fitting methods, which match only (L, Teff) as a function of age, cannot provide a proper calibration for single stars or for small stellar systems. In order to minimize uncertainties between parameters, we considered more stellar physical dimensions, such as log g and [M/H], including the calibration of αMLT. For a statistical evaluation of stellar models within the error domain, we used the χ2-minimization method introduced by Lastennet et al. (1999):
According to the study on kinematics and age of solar neighborhood stars from the HIPPARCOS data, the kinematical range of stars which have [Fe/H] ∼ −0.6 and space velocity V ∼ −30 km s−1 is statistically related to their age (Caloi et al. 1999). From the space velocity and the chemical composition, 85 Peg is categorized as a mid- to high-velocity stars with respect to the local standard of rest. We have therefore considered t ≳ 7 Gyr as the constraint for the age estimation. In an earlier study, Perrin et al. (1977) pointed out that 85 Peg does not have a normal chemical composition and that its helium abundance might be extremely low (Y ∼ 0.2). Later, Fernandes et al. (1998) could not find a main-sequence solution which has a Sun-like helium content. Therefore, we have regarded the helium abundance as a free parameter with the constraint Y ≳ Yp, where Yp is the primordial helium abundance.
We have found a consistent set of parameters for 85 Peg, which minimized the errors in the observational data. It is noticeable that 85 Peg has nearly primordial helium abundance Y0 ∼ 0.24. From its chemical composition and high space velocity, 85 Peg seems to be an old population star. The evolutionary status of 85 Peg must be on or near main-sequence stage, with an age of t ∼ 10 Gyr. The 85 Peg A models, which have a mass in the range 0.80 ∼ 0.83 M☉and a metal mass fraction in the range 0.004 ∼ 0.006, can be placed in the 85 Peg error box in the H-R diagram by adjusting other variables such as αMLT. Table 5 shows the calibrated stellar parameters and fundamental properties of our best-fit model with χ2 ≲ 1.
Table 5. Calibrated Parameters and Fundamental Properties of the Best-Fit Model for 85 Peg
| Parameters | 85 Peg A | 85 Peg B | 85 Peg Bb |
|---|---|---|---|
| M/M☉ | 0.82 ± 0.02 | 0.54 ± 0.05 | 0.14 |
| Age | 9 ∼ 11 Gyr | ||
| (X0, Z0; Y0) | (0.755, 0.005; 0.24) | ||
| Xs | 0.799 | 0.773 | 0.748 |
| Zs | 0.0042 | 0.0046 | 0.005 |
| Xc | 0.2698 | 0.6189 | 0.749 |
| Zc | 0.0055 | 0.0053 | 0.005 |
| αMLT | 1.6 ± 0.2 | 1.4 ± 0.4 | 1.83 |
| Teff (K) | 5600 | 4200 | 3330 |
| L/L☉ | 0.613 | 0.074 | 0.003 |
| R/R☉ | 0.834 | 0.512 | 0.155 |
| Mbol | 5.32 | 7.68 | 11.19 |
| [M/H] | −0.66 | −0.64 | −0.53 |
| log g | 4.51 | 4.77 | 5.18 |
Notes. α-enhanced mixture and microscopic diffusion were considered in our model construction. (X0, Z0), (Xs, Zs), and (Xc, Zc) denote initial, surface, and core chemical mass fraction, respectively. All tracks have been computed from the stellar birth line.
Download table as: ASCIITypeset image
To constrain the physical dimensions of stellar parameters, representative models for the primary star were compared with the best set (model 1; see Table 6). Models 2 and 3 have initial metal mass fraction Z0 = 0.004 and 0.006, respectively. Figure 1 shows the effect of varying metallicity while other parameters are fixed. All evolutionary tracks were computed from their stellar birth line to age of 18 Gyr. Z0 = 0.004 (model 2) and 0.006 (model 3) pass by just outside of observational error domain. Models 4 and 5 have the calibrated parameters with additional constraints: model 4 is the case of the initial helium abundance, Y0 = 0.25. Model 5 is set to have a constant mixing-length parameter αMLT = α☉. In Figure 2, evolutionary tracks of calibrated models are illustrated. Three calibrated models are in a good agreement with observation at least on the H-R diagram. To give a diagnosis between models, χ2-values at each evolutionary stage are represented in Figure 3. Taking into account the uncertainties, model 4 remains within the range of errors of the best model. In the case of model 5, its age (∼14 Gyr) seems to be too old as a solar neighborhood disk star whose metal abundance is [Fe/H] ∼ −0.7. It is noteworthy that the tracks of all models would intersect the error box if other relevant parameters were adjusted accordingly.
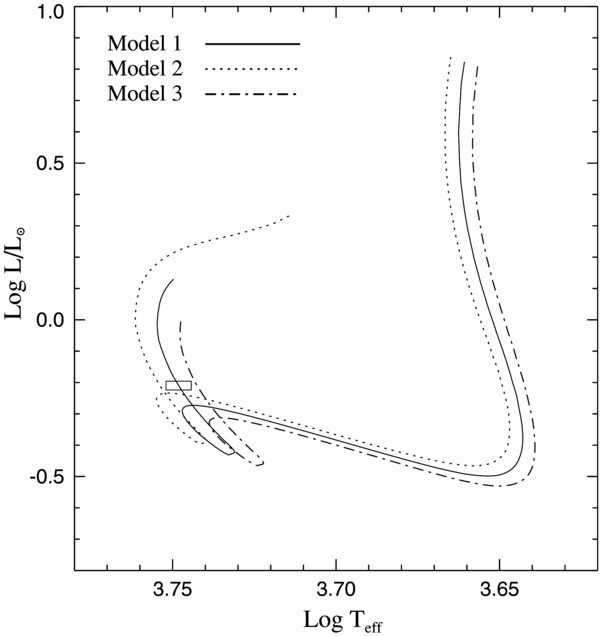
Figure 1. Evolutionary tracks of models of 85 Peg A are presented with the effect of varying initial metal abundance. Model 1 (Z0 = 0.005) is the best set with calibrated parameters. Models 2 and 3 have slightly different metallicities Z0 = 0.004 and 0.006, respectively. Box is denoted as an error domain of 85 Peg A.
Download figure:
Standard image High-resolution image
Figure 2. Evolutionary tracks of calibrated models of 85 Peg A are presented. Initial modeling parameters of each model were adjusted to minimize their observational error. Model 1 is the best set including the calibration of mixing-length parameter and helium abundance. Model 4 is calculated with the fixed initial helium abundance Y0 = 0.25. Model 5 is set to have solar mixing-length parameter αMLT = α☉.
Download figure:
Standard image High-resolution image
Figure 3. χ2 values of models for the primary star are calculated according to evolutionary steps.
Download figure:
Standard image High-resolution imageTable 6. Comparison of Models of 85 Peg A
| Model | M/M☉ | Z0 | Y0 | αMLT | Age (Gyr) |
|---|---|---|---|---|---|
| Model 1 | 0.82 | 0.005 | 0.24 | 1.6 | 10 |
| Model 2 | 0.82 | 0.004 | 0.24 | 1.6 | 8 |
| Model 3 | 0.82 | 0.006 | 0.24 | 1.6 | 12 |
| Model 4 | 0.80 | 0.005 | 0.25 | 1.6 | 11 |
| Model 5 | 0.79 | 0.005 | 0.24 | 1.8 | 14 |
Note. Various models were constructed with additional constraints and were compared with the best model for 85 Peg A (Model 1).
Download table as: ASCIITypeset image
In order to constrain age, detached binaries are often compared with the theoretical isochrones of well-studied globular clusters. As one of the closest and the most carefully studied globular clusters, 47 Tuc has been known to have its age 10 ∼ 12 Gyr(VandenBerg 2000; Gratton et al. 2003; Salaris et al. 2007; Dotter et al. 2009). Most of all, recent spectroscopic researches reveal that 47 Tuc have [Fe/H] ∼ −0.7 dex and [α/Fe] ∼ 0.3 dex (Koch & McWilliam 2008; McWilliam & Bernstein 2008). Similarity in chemical composition between 85 Peg and 47 Tuc leads to comparison with their theoretical isochrones. We have generated isochrones with the chemical composition (Y0, Z0) = (0.24, 0.005) and the α-enhancement, including microscopic Y and Z diffusions. In model construction, convection was treated with constant MLT parameter αMLT ∼ 1.8, and model atmosphere was calculated by incorporating Eddington T–τ relation.
Isochrones were computed with mass steps, 0.01 ∼ 0.001 M☉, and with mass ranges, 0.15 ∼ 1.5 M☉. Fits of isochrone with the Hubble Space Telescope (HST)/WFPC2 CMD of 47 Tuc (Piotto et al. 2002) are illustrated in Figure 4. From isochrone fits, we reconfirmed that age of 47 Tuc have the range of 10 ∼ 12 Gyr. For comparison purpose, theoretical properties (L, Teff) were transformed to colors−magnitudes using the semiempirical color transformation tables of Green et al. (1987). In Figure 5, two isochrones (10 and 12 Gyr) are represented with the evolutionary tracks of all components of 85 Peg on the H-R diagram. It is noticeable that all components lie so close to the isochrones which provide a good fit to the CMD of 47 Tuc. This means that the traditional idea of a constant mixing-length ratio cannot be ruled out.
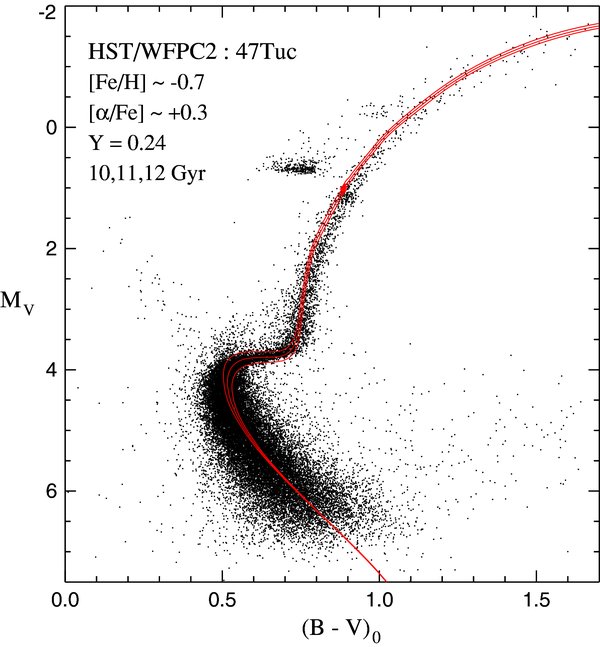
Figure 4. Theoretical isochrones fitted to the CMD of 47 Tuc are illustrated. Isochrones have been generated with the same physical inputs for model 1.
Download figure:
Standard image High-resolution image
Figure 5. Evolutionary tracks of all the components of 85 Peg are presented with isochrones (10 and 12 Gyr). Isochrones were constructed with the same initial condition and physical inputs including Y and Z diffusion. Theoretical masses are marked up on isochrones. Boxes denote the domains of observational errors.
Download figure:
Standard image High-resolution imageThe mixing-length ratio of our 85 Peg A models was determined to be αA ∼ 1.6 which is higher than the previous result (αA ∼ 1.4) without α-enhanced mixtures (Bach et al. 2007). The variation of opacity and mean molecular weight from the [α/Fe] enhancement affects the thermal structure and the energy generation. For super-solar metallicity stars, variations in relative abundances can have a serious influence on the evolutionary status. In the case of metal-poor stars, however, all changes result in milder effects on the model atmosphere when the metallicity is down by an order of magnitude (Weiss et al. 2006). Moreover, at lower Z, the α-enhancement effect can be mimicked by increasing metallicity in the overall feature of the isochrones (Chieffi et al. 1991; Kim et al. 2002a). The α-element enhancement would not affect seriously the age, especially for low mass MS stars. This is in contrast with the TO-masses and the position of red giant branch (RGB) stars. This last effect can be compensated in the H-R diagram location if a higher αMLT value is employed. The parameter αMLT is a measure of the efficiency of convective motions. For large values of αMLT, internal heat is efficiently transported outward, resulting in larger effective temperature for the stellar model. Models with larger opacity but with the same αMLT produce lower effective temperatures. Therefore, for the determination of accurate stellar parameters, including mass, metallicity, and mixing-length parameter, the consideration of elemental abundances is very essential.
In the case that 85 Peg A has the solar mixing-length ratio (αA = αB = α☉), there is also a main-sequence solution (model 5). This is the exactly same result as ordinary isochrones fits. Since efficient mixing makes a star hotter and brighter, this set of models were found to be slightly less massive than our best set (therefore, older and lower surface gravity). From two-dimensional hydrodynamic convection simulations, Ludwig et al. (1999) found that the αMLT of MS stars decreases with effective temperature, that is, with mass. More recently, in their three-dimensional radiation-hydrodynamic (RHD) models for M-type main-sequence stars, Ludwig et al. (2006) suggested that the rate of mixing increases with decreasing gravitational acceleration at a given effective temperature. Taking into account the differences in log g, Teff, and stellar mass, our new value is in good agreement with their prediction. The αMLT parameter is conventionally calibrated to the solar value, known with high precision. However, the envelopes of individual stars have different physical characteristics according to their stellar parameters and evolutionary status. Our αMLT value thus provides a clue for the calibration of the mixing-length parameter in different types of models. The three-dimensional RHD numerical simulations yield more detailed fundamental information on the physics of stellar convective motions in addition to the effective αMLT parameters (Ludwig et al. 2006).
3.4. Trinarity of the 85 Peg System
Recently, a series of studies (Fernandes et al. 2002; D'Antona et al. 2005; Bach et al. 2007) have predicted the presence of a third component in 85 Peg. As a multiple system, we basically assumed that its components have a common age and an identical initial chemical composition. Through the calibration of the relatively well-constrained primary 85 Peg A, we can find the age and the initial constituents of the system. From the masses of each components, we confirm the existence of a faint tertiary as a hidden mass (Bach et al. 2007). Therefore, the secondary 85 Peg B itself is the binary system. But the separation of 85 Peg Bab is very uncertain. If this hidden mass is considered as a faint tertiary, the mass ratio problem of the system can be naturally explained. Figure 5 shows the evolutionary tracks in the H-R diagram for the primary, the secondary, and the undetected tertiary, respectively. All tracks were computed from the pre-main-sequence to their theoretical age. From the location on the evolutionary track, 85 Peg Bb seems to be a fully convective star on its Hayashi track. In Figure 6, the detailed evolutionary tracks of each components are shown. 85 Peg Bb may be an M-type main-sequence star with the luminosity ∼ 0.003 L☉. Accordingly, 85 Peg Bb is expected not to contribute to the luminosity of the secondary component within the observational uncertainty.

Figure 6. Detailed evolutionary status of 85 Peg A and 85 Peg B. Evolutionary tracks of the primary (left) and the secondary (right) were computed with the calibrated stellar parameters.
Download figure:
Standard image High-resolution image3.5. Asteroseismology of the 85 Peg A
Asteroseismology has been a powerful tool for investigations of stellar interiors. Due to its detectable surface amplitude of oscillation, 85 Peg is considered favorable to seismological studies (D'Antona et al. 2005). In order to calculate the seismic p-mode frequencies of 85 Peg, we use the nonadiabatic stellar pulsation code by Guenther (1994). The seismic analysis of the acoustic eigen frequencies provide an important tool in investigating the stellar internal structure. The spectrum is characterized by the relation of the large frequency separation,
and reduced frequency modulo,
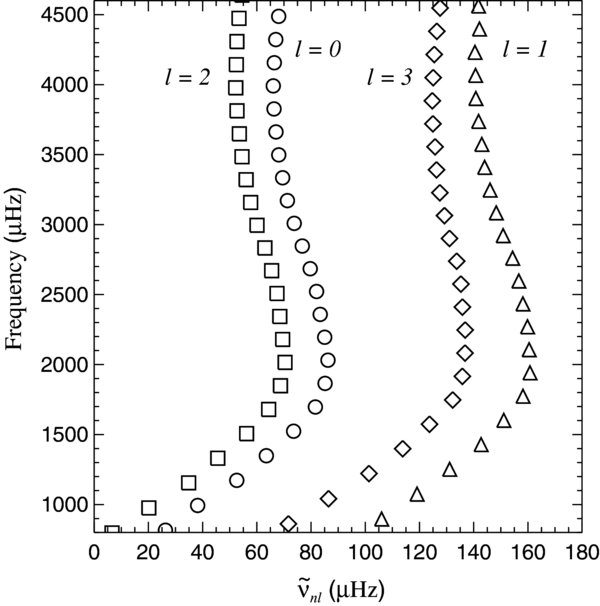
where ν0 is a suitably chosen reference, and k is an integer such that  lies between 0 and Δν. In Figure 7, the echelle diagram of the frequency spectrum for 85 Peg A model is presented. The theoretical frequency spectrum of 85 Peg A has been plotted with the first order spacing Δν = 165 μHz and the reference frequency ν0 = 790 μHz. This p-mode spacing are within the range (150–170 μHz) predicted by D'Antona et al. (2005). According to the scaling relation introduced by Kjeldsen & Bedding (1995), 85 Peg A model is estimated to be a solar-like star with the frequency maximum power, νmax ∼ 3.6 mHz.
Figure 7. Echelle diagram of the frequency spectrum for our model of 85 Peg A is presented. With our calibrated parameters, the theoretical frequency spectrum was calculated in the context of asteroseismology. Circles, triangles, squares, and diamonds correspond to modes l = 0, 1, 2, and 3, respectively. The approximated large separation is Δν ∼ 165 μHz at the reference frequency ν0 = 790 μHz.
Download figure:
Standard image High-resolution image
The calibration of stellar parameters would provide deeper insight into physical processes in stellar systems. If the p-mode oscillation spectrum of 85 Peg is detected by the MOST satellite, our work will contribute to the interpretation of the data. 85 Peg will cease to be a stellar physics puzzle, but rather a well-studied standard star. Moreover, as a well-observed representative of an old metal-poor population in the solar neighborhood, 85 Peg must be a valuable tracer of the evolution of the Galaxy.
4. SUMMARY
We have investigated the evolutionary status of 85 Peg system based on a high-resolution spectroscopic analysis and the calibration of the stellar parameters. Recent observational and theoretical studies reveal that 85 Peg is composed of three metal-poor stars. From our elemental analysis, the full set of chemical abundance has been determined, for the first time. The newly determined chemical abundances show that 85 Peg has an α-enhanced mixture by a factor of 2 with respect to the solar-scaled abundances.
Within the frame-work of the standard stellar theory, we have reproduced 85 Peg stellar models using the most recent observational results. We have fully considered the α-element enhancement in the computation of the related physical parameters such as the equation of state and opacities. To avoid many-fold degeneracy among physical quantities, we have performed a statistical minimization between theoretical model grids. Through a consistent modeling and statistical assessment, we found a reliable set of physical parameters and confirmed the trinarity of the system. From the calibrated parameters, the p-mode frequency spectrum was calculated. With the well-defined stellar model, frequency detection by the MOST mission will provide deeper insight of physical processes inside the low-mass stars.
The authors appreciate Jason W. Ferguson for computation of low-temperature opacities, and thank the anonymous referee for the helpful suggestions. K.B., J.L., and Y.C.K. are supported by the Astrophysical Center for the Structure and Evolution of the Cosmos (ARCSEC) of Korea Science and Engineering Foundation (KOSEF) through the Science Research Center (SRC) Program.