

Abstract
Diffusion tensor imaging (DTI) is a non-invasive technique used to obtain the 3D fiber structure of whole human hearts, for both in vivo and ex vivo cases. However, by essence, DTI does not measure directly the orientations of myocardial fibers. In contrast, polarized light imaging (PLI) allows for physical measurements of fiber orientations, but only for ex vivo case. This work aims at quantitatively comparing the myocardial fiber orientations of whole human hearts obtained from cardiac DTI with those measured by PLI. Whole human neonatal and infant hearts were first imaged using DTI. The same whole hearts were then imaged using PLI. After DTI and PLI data are registered, the orientations of fibers from the two imaging modalities were finally quantitatively compared. The results show that DTI and PLI have similar variation patterns of elevation and azimuth angles, with some differences in transmural elevation angle range. DTI itself induces an underestimation of the range of transmural elevation angles by a factor of about 25° at the basal and equatorial slices and the reduction of spatial resolution further decreases this range. PLI data exhibit a 15° ± 5° (P < 0.01) narrower transmural elevation angle range at apical slices than in basal or equatorial slices. This phenomenon is not observed in DTI data. In both modalities, the azimuth angle maps exhibit curved or twisting boundaries at the basal and apical slices. The experimental results globally enforce DTI as a valid imaging technique to reasonably characterize fiber orientations of the human heart noninvasively.
Export citation and abstract BibTeX RIS
Abbreviations used
| DTI | Diffusion tensor imaging |
| PLI | Polarized light imaging |
| dMRI | diffusion magnetic resonance imaging |
| MDDW | Multi directional diffusion weighting |
| MMA | methacrylate |
| MRI | Magnetic resonance imaging |
| ADC | Apparent diffusion coefficient |
| FFD | Free form deformation |
| SSD | Sum of squared differences |
| FS | Finite strain |
| LV | Left ventricle |
| RV | Right ventricle |
| ODF | Orientation distributions functions |
| HARDI | high angular resolution diffusion-weighted imaging |
1. Introduction
The myocardium is a complex tissue composed of various elements such as myocytes, collagen fibers, blood vessels, and other connective tissue elements (Caulfield and Borg 1979 and Weber 1989). Among these, myocytes play a central role in the cardiac contractile function. Since the myocytes have approximately 25 µm in diameter and 100 µm in length, current imaging systems (e.g. magnetic resonance imaging—MRI) do not enable to observe the individual myocytes of a whole myocardium. Instead, only an aggregate of individual myocytes is observed in an image voxel. Nevertheless, the myocyte aggregate is highly structured and oriented. When tracking the orientation of the myocyte aggregate at each voxel, the voxels form preferential patterns in three-dimensional (3D) space and give rise to the so-called myocardial fibers. Such fibers however should not be understood in the same sense as in brain or musculo-skeletal tissue, because they are actually the image representation of a set of individual myocytes having some privileged orientations in 3D space and the term 'fiber' is employed just for simplicity. Myocardial fibers have a fundamental role in the heart's function in health and disease (Weber 1989). For instance, the propagation of electrical activity is faster along the direction of the fibers and slower across the sheet plane (Jouk et al 2007), and at the cellular level, the contraction occurs along the long axis direction of the myocytes bundles and leads to transmural thickening and apex-base shortening after rearrangements through interactions with the collagen extracellular matrix. Moreover, fibers throughout the ventricles could be a substrate for arrhythmias, including ventricular tachycardia and fibrillation, and sudden cardiac death, as suggested in both experimental and theoretical studies (Collin 2006, Delon et al 2006, Wu et al 2006). A number of methods have been reported in the literature for the study of myocardial fiber architecture in a whole human heart. We can cite three main ones: histological techniques (Torrent-Guasp 1973, Ross and Streeter 1979, Streeter 1979), diffusion magnetic resonance imaging (dMRI) (Basser and Pierpaoli 2011 and Wu et al 2006), and polarized light imaging (PLI) (Usson et al 1994, Jouk et al 1995, 2000, 2007). Histological techniques are known to suffer from distortion and misalignment and do not allow the 3D reconstruction of fiber structures. To cope with these problems, PLI was proposed to get fiber orientations in ex vivo human hearts. Owing to its high spatial resolution (90 × 90 × 500 µm3) and ability to measure physically the 3D orientations of the myocytes of a whole human heart, PLI appears a privileged technique for obtaining the ground-truth of the myocardial cell architecture of ex vivo human hearts (Whittaker et al 1989, Usson et al 1994, Jouk et al 2000). Indeed, PLI is founded on myosin orientation, a well-characterized component of the contractile apparatus constitutively coaxial with myocardial cells. However, PLI can only be applied to ex vivo hearts.
In contrast, dMRI can be used for both ex vivo and in vivo hearts, which makes it a novel promising imaging technique for both basic and clinical studies of cardiac diseases. dMRI produces diffusion-weighted (DW) images, by sensitizing magnetic resonance signals to the random motion (i.e. Brownian motion) of water molecules. The motion in the 3D space of water molecules can be free or hindered by obstacles, depending on their environment. In the case of the myocardium, the water molecules diffuse in a complex tissue structure but globally they move more rapidly in the direction where the structure has privileged orientations (e.g. fibrous structures), along the elongated direction of myocytes or bundles of myocytes (i.e. along the long-axis of the myocytes or myocardial fibers), and more slowly in the perpendicular direction. Water molecules then diffuse in an anisotropic manner in the myocardium. Capturing such 3D diffusion anisotropy will then enable to infer the fiber orientations of the tissue. To this end, magnetic field gradient pulses in different diffusion gradient directions (at least six) are used; each gradient direction accounts for water molecule displacement in that direction (Le Bihan 1991). When a sufficient number of diffusion gradient directions (>6) are used, diffusion tensor imaging (DTI) model (Basser et al 1994 and Kingsley 2006) provides an estimate of the main directions of diffusion. DTI has been shown to be an promising means to noninvasively image the fiber orientation of both ex vivo (Yang et al 2011, 2012, 2014, 2017, Eggen et al 2012, Lombaert et al 2012) and, more recently, in vivo human hearts (Wu et al 2006, Scott et al 2014, 2016, Wei et al 2015, McGill et al 2016, Moulin et al 2016).
However, DTI does not measure directly the orientations of myocardial fibers. Instead, it infers fiber orientations through tracking the motion of water molecules in the myocardium. The question then arises as to how the DTI-obtained fiber orientations reflect the reality. An attempt of answering this question was reported in Scollan et al (1998), Holmes et al (2000), Mekkaoui et al (2012) and Nielles-Vallespin et al (2017) on rabbit or sheep hearts using histological techniques. Scollan et al (1998) and Holmes et al (2000) compared the myofiber angulation at five corresponding locations from histology and DTI in rabbit hearts. Mekkaoui et al (2012) performed histological validation on six sections corresponding to six transmural depths in the lateral wall from endocardium to epicardium on 20 hearts of human, rat and sheep. Nielles-Vallespin et al (2017) compared the eigenvector angles from in vivo DTI and histology of a 1 cm × 1 cm block in the lateral left ventricle (LV) wall of the mid-ventricular level in swine hearts. More recent works on the evaluation of dMRI-derived fiber orientations in the human heart (Yang et al 2017) and in the human brains (Mollink et al 2017) were also reported, both of which take PLI as reference measures.
With respect to our previous conference abstract (Yang et al 2017), in this paper, we propose to thoroughly and quantitatively compare the myocardial fiber orientations of whole human neonatal and infant hearts obtained from cardiac DTI with those measured by PLI. The method consists of first imaging the same whole human hearts using both DTI and PLI, then registering the DTI data to the PLI data, and finally comparing the fiber orientations of the whole hearts from both the imaging modalities. To the best of our knowledge, this is the first work to examine the whole-heart fiber orientations indirectly obtained from DTI with respect to those directly (physically) obtained from PLI, based on the imaging of the same whole human hearts.
2. Materials and methods
2.1. Human heart samples
In this study, nine human hearts were obtained and processed in compliance with French legal and ethical guidelines. The investigations are conformed to the principles outlined in the declaration of Helsinki (Anon n.d., Carlson et al 2004). They relate to infants who died after birth up to 14 months of life. After medically pronounced death, cadavers are conserved for a minimum of 24 h at the mortuary at 4 °C, in order to give time to the administration to verify there are no contra-indications to the necropsy and to the heirs of the deceased to give the authorization for the autopsy. Those legal formalities being done, the autopsy is performed; the heart are extracted and fixed in a formalin solution to ensure good preservation of cells and tissue as close as possible as living structure. The average weight of their ventricular masses ranged from 12 g to 32 g, and the average thickness of their interventricular septum at the equatorial level ranged from 3 to 8 mm. An example of the studied neonatal hearts is shown in figure 1.

Figure 1. (a) An example of the studied human infant hearts, (b) definition of the west–east axis and (c) elevation and azimuth angles of a fiber. LV and RV indicate the left ventricle and the right ventricle, respectively. IVA represents the anterior part of interventricular septum and LVI the inferior part of the left ventricular wall.
Download figure:
Standard image High-resolution imageThe nine human neonatal and infant hearts were first imaged using DTI and then imaged using PLI.
2.2. Heart preparation and DTI
Each heart was placed in a plastic container and held by hydrophilic gel to maintain a diastolic shape. This setup has a low dielectric effect and also eliminates unwanted susceptibility artifacts near the boundaries of the heart. The DTI acquisitions of the nine ex vivo human neonatal and infant hearts were performed on a 3 T clinical scanner (MAGNETOM Verio, Siemens AG, Healthcare Sector, Erlangen, Germany). The 12 channels head matrix coil was used. The used DTI-sequence was a Siemens MDDW (Multi-Directional Diffusion Weighting) sequence with the following parameters: TE = 70 ms, TR = 5100–7900 ms, FOV = 144 × 144 mm2, slice spacing = 1.4 mm, slice thickness = 1.4 mm, slice duration (average acquisition time for one slice) = 170–230 ms, number of slices = 30–40, size = 104 × 104 pixels, imaging voxel = 1.38 × 1.38 × 1.4 mm3, diffusion sensitivity b = 700 s mm−2, gradient directions = 12, 32 or 192. For the 12 directions with ten averages (Heart 1) and 192 directions with 6 averages (for the other hearts), the acquisition times were 11.1 min and 148.7 to 177.7 min, respectively. Diffusion tensor calculation and analysis of fiber structure characteristics were carried out with MATLAB (The Mathworks Inc. 2016).
Although the present paper focuses on the comparison of fiber orientations derived from DTI and PLI, it would be useful to have some ideas on the values of fractional anisotropy (FA) and mean diffusivity (MD), two most popular DTI indices, obtained in the present study. Thus, the calculated mean FA and MD values and their standard deviations for the nine hearts were recorded in table 1.
Table 1. DTI FA and MD mean and standard deviation values for the nine hearts.
| FA | MD (10−3 mm2 s−1) | Age | |
|---|---|---|---|
| Heart 1 | 0.32 ± 0.17 | 0.61 ± 0.33 | 14 months |
| Heart 2 | 0.13 ± 0.07 | 1.38 ± 0.40 | 2 months |
| Heart 3 | 0.18 ± 0.06 | 1.40 ± 0.26 | 0 |
| Heart 4 | 0.32 ± 0.23 | 0.86 ± 0.55 | 2 months |
| Heart 5 | 0.24 ± 0.10 | 1.22 ± 0.33 | 2 months |
| Heart 6 | 0.23 ± 0.12 | 1.03 ± 0.41 | 8 d |
| Heart 7 | 0.22 ± 0.11 | 0.82 ± 0.22 | 5 d |
| Heart 8 | 0.36 ± 0.13 | 0.70 ± 0.21 | 2 d |
| Heart 9 | 0.13 ± 0.07 | 1.32 ± 0.33 | 3 months |
| Average | 0.24 ± 0.12 | 1.04 ± 0.34 | 2.61 months |
2.3. Heart preparation and PLI
After DTI acquisitions, the nine hearts were imaged using PLI. The samples were rinsed in neutral buffer solution then immerged in a formalin solution to wait for PLI. The whole PLI imaging involves a series of operations that include in particular:
- (a)Tissue handling: the preserved heart samples were dissected and the ventricular masses were isolated by cutting the atria 1 mm upper from atrio-ventricular groove, and the great arteries 3 mm from the semi-lunar valves.
- (b)Embedding: The hearts (ventricular masses) were embedded in methyl methacrylate (MMA) resin using a protocol composed of eight successive baths (one week for each of them): one bath for eliminating formalin, four baths for dehydration, three baths for immersion in three different and successive solutions of MMA liquid resin. The samples were embedded in acrylic hard bocks resin by polymerization of the MMA. The chemical reactions took place in a controlled way and required one up to three weeks, to avoid shrinkage and production of artefacts.
- (c)Sectioning: before sectioning, three fiducial markers were drilled perpendicular to the coronal plane on the faces of the MMA resin block. A series of thick sections (thickness 500 µm) were cut with a diamond wire saw (ESCILR) in the heart short axis plane. Due to the thickness of the wire saw, 500 µm were lost and consequently the spacing of section was 1 mm. The rate of penetration of the saw was set at a low speed in order to avoid mechanical stress and distortions. Sectioning time was 30 to 45 min per section with 35 to 45 sections per heart.
- (d)PLI acquisition: The birefringence of the myocardium is essentially due to the crystalline uni-axial positive birefringence of myosin (Usson et al 1994, Jouk et al 1995, 2000, 2007)) and it is possible to cancel the intrinsic birefringence of collagen due to the good match of MMA and collagen refraction indices. The extraction of orientation information (Usson et al 1994, Jouk et al 2007) (in terms of elevation and azimuth angles) at each voxel (90 × 90 × 500 µm3) is then possible with the classical technique of PLI on a 3-axis rotation stage adapted to biology, particularly at the low value of birefringence (10−4) and the size of our specimen samples. The experimental PLI system is illustrated in figure 2. It consists of an optical bench with a polychromatic LED illuminator (White LED 5 W) source, a motorized rotating polarizer, a tiltable stage for holding the specimen, a motorized full wave plate (510 nm), a motorized rotating analyzer (crossed axis with reference to polarizer), a long-pass (590 nm) filter and a CCD camera. More details about heart preparation and imaging can be found in references (Jouk 1994, Jouk et al 1995, 2000, 2007). Each section requires recording 32 PLI images corresponding to various configurations of the optical pieces; each image requires an exposure time of half a second. The acquisition of each section lasted between 20 and 30 min or more, including the time for preliminary adjustments, setting of different filters, cleaning of artefacts such as blood clots, etc.
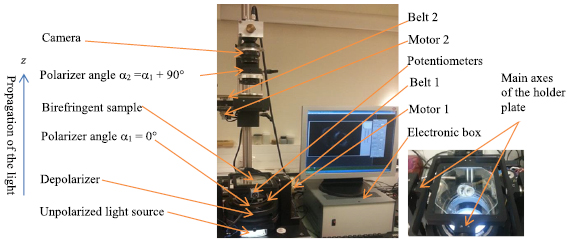
Figure 2. The experimental PLI system used to image human hearts. The right side zooms in on the holder plate.
Download figure:
Standard image High-resolution imageSo, globally, about five to six months were needed to obtain the final elevation and azimuth maps of a single heart.
As mentioned above, the raw data provided by PLI are the values of elevation and azimuth angles physically measured by PLI in the reference system illustrated in figure 1. Therefore, we use elevation and azimuth angles in the following comparisons (instead of recalculating the helix and transverse angles under a cylindrical coordinate system).
2.4. Comparison scheme
The comparison scheme is illustrated in figure 3. It consists of five steps detailed in the following subsections. Since the raw data acquired by PLI and DTI represent different quantities (respectively fiber angle maps and DW images), their intensity values differ. Therefore, the myocardium masks of the same type of information from both modalities are generated. More precisely, elevation angle volumes from PLI and DTI are chosen as the mask for registration since the initially acquired PLI data are elevation and azimuth angles but the elevation angle map generally presents simpler variation pattern than azimuth angle map. To reduce registration computational cost, a reduction of the initial PLI volume size is performed by downsampling. The downsampling is in-plane with a downsampling factor of 4, which means that a 4 × 4 pixel array is replaced by a single value from a median filter.
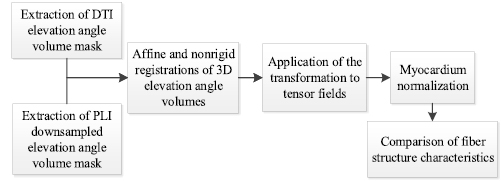
Figure 3. Flowchart for the comparison between DTI and PLI angle maps.
Download figure:
Standard image High-resolution image2.4.1. Myocardium mask extraction
Due to the noisy nature of DTI data, the boundary between the myocardium and the fixation gel is not clear enough to be captured with a simple threshold-based segmentation of b0 images. We therefore extracted myocardium mask in the apparent diffusion coefficient (ADC) images that were calculated from the DW images. First, the ADC maps were thresholded using an upper threshold of 2 × 10⁻³ mm2 s−1, yielding the myocardium mask. Then, the myocardium in DTI elevation angle volume was extracted by the ADC myocardium mask. For the acquired PLI elevation angle volume, the papillary muscles were removed before registration for more accurate registration.
2.4.2. Affine and nonrigid registrations of DTI and PLI elevation angle volumes
Landmark-based 3D affine registration is first applied to cope with the problem in which the orientation of the same heart in the two imaging modalities differs a lot. Three landmarks at the equatorial slice and one landmark at the apical slice of LV are selected to reorient and resize the heart in both x-y plane and apex-base axis. After the affine registration, a bi-pyramidal free form deformation (FFD)-based registration (Sarrut et al 2007) is used to register the hearts in both modalities to the same shape. The affine and nonrigid registrations of DTI elevation angle volume to PLI elevation angle volume are schematized in figure 4. The term bi-pyramidal refers to the two multi-level pyramidal representations applied respectively to the images and the FFD transformation. The first pyramid achieves the multiresolution decomposition of the original images by applying independently a low-pass Gaussian filter to each of them and then decimating the number of voxels. The second pyramid realizes the multiresolution decomposition of the FFD transformation. The sum of squared differences (SSD) is used as the registration similarity criterion, and the optimization is achieved through a gradient descent search based on the first derivative of the SSD metrics (Sarrut et al 2007). In our experiments, the number of image pyramid levels and transformation pyramid levels were respectively set to 3 and 4.
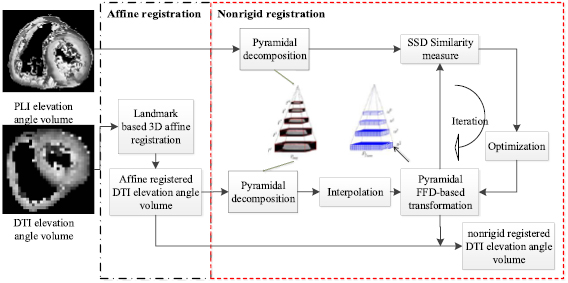
Figure 4. Scheme of the affine and nonrigid registrations of DTI volume to PLI volume.
Download figure:
Standard image High-resolution image2.4.3. Tensor field transformation and reorientation
By registering the DTI elevation angle volume to PLI elevation angle volume as described in Step ii), we obtain the affine and nonrigid transformations, which are then applied to the original tensor fields (that are calculated from DW images). That finally amounts to registering the original tensor fields to PLI data. The diffusion tensor at each voxel contains orientation information related to its local reference coordinate system, whereas the transformation refers to the relocation of each voxel in a global coordinate system. Therefore, a reorientation of the tensors based on the affine and nonrigid registrations must be performed to conserve the tensor size and shape in the image and to preserve the microstructure properties of tissues (Alexander et al 2001). In the present study, the finite strain (FS) strategy (Malvern 1969) was preferred since it preserves geometric features of diffusion tensors.
2.4.4. Myocardium normalization
The normalization of myocardium is achieved for both elevation and azimuth angle maps derived from PLI and registered DTI tensor fields in the same coordinate system. The transmural position within myocardium is normalized in a manner similar to that in Geerts et al (2002) in order to redefine a common coordinate system and locate relative transmural positions in the myocardium. To achieve this, an estimated radius of the midwall position is first determined and then used as a reference radius to which all transmural positions are normalized.
2.4.5. Comparison of fiber structure characteristics
The comparison of fiber structure characteristics between DTI and PLI is based on the elevation and azimuth angle maps, transmural elevation angle distribution, transmural elevation angle range, and histogram of elevation angles. Note that papillary muscles are excluded for the quantitative comparison of elevation and azimuth angles and transmural elevation angle ranges, to focus on the fiber characteristics within the myocardial wall only. The transmural elevation angle range of the whole LV myocardium of a given slice is calculated by subtracting the mean elevation angle at free wall epicardium (or RV septum endocardium) from that at LV free wall endocardium (or LV septum endocardium).
3. Results
Figure 5 shows the comparison between the downsampled PLI angle map and the corresponding registered DTI angle map for three of the nine neonatal and infant hearts. Taking Heart 1 as an example, the left two columns in figure 5 represent the PLI and DTI elevation angle maps and the right two columns the PLI and DTI azimuth angle maps. The PLI angle maps were obtained after downsampling the original angle maps derived from the redirected vector fields of the equatorial slice in PLI, while the DTI angle maps were obtained from the non-rigidly registered tensor fields of the same slice in DTI. From the PLI maps, it is observed that most elevation angles in the LV myocardium (1st image, figure 5(a)) vary continuously from about −60° to +60° from epicardium to endocardium in the free wall or from RV septum endocardium to LV septum endocardium. The azimuth angle map (3rd image, figure 5(a)) exhibits a circularly periodic variation pattern in the LV myocardium, with a whole range of angles (0°–180°) being experienced twice. The variations of both elevation and azimuth angles reflect the helical structure of cardiac fibers.
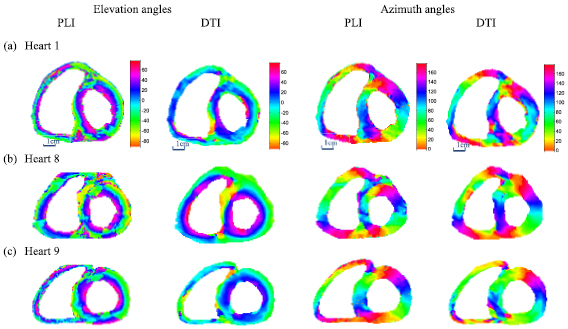
Figure 5. Comparison of the registered DTI and the downsampled PLI angle maps (degrees) at the corresponding equatorial slices for 3 neonatal and infant hearts. The left two columns represent the PLI (1st column) and DTI (2nd column) elevation angle maps. The right two columns represent the PLI (3rd column) and DTI (4th column) azimuth angle maps.
Download figure:
Standard image High-resolution imageFrom the registered DTI (the 2nd and 4th images, figure 5(a)), we observe that the regular variation pattern of elevation and azimuth angles is preserved. However, the DTI elevation angle presents a reduced range of variations, varying from about −45° to +45° from epicardium to endocardium of the free wall or from RV septum endocardium to LV septum endocardium; the azimuth angle map presents a circularly periodic variation similar to that of the downsampled PLI, but with some singular values appearing in the IVA area (illustrated in figure 1(b)). Singular values in the angle maps from the registered DTI are observed along the RV septum endocardium and the LV endocardium, which correspond to residual papillary muscles; but they are much less numerous than those in the PLI angle maps. This is because the values of the DW signals of papillary muscles are close to those of gel, and have been discarded in the registration process. In the following comparison based on registration, Heart 1 was again taken as a representative example.
Figure 6 shows the distribution of elevation angles along a radial profile (Heart 1) at an equatorial slice (figure 6(a)) from downsampled PLI data (figure 6(b)) and registered DTI data (figure 6(c)). It is observed that along this profile the elevation angles vary from −60° to +60° in downsampled PLI data (figure 6(b)) and from −65° to +50° in registered DTI data (figure 6(c)).
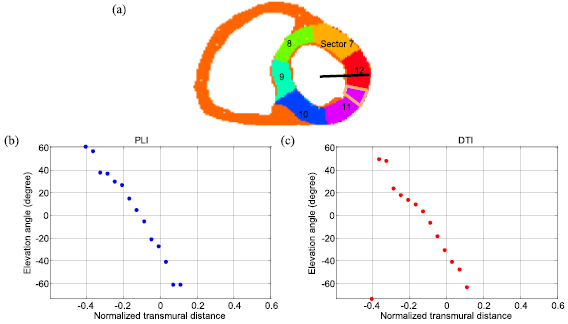
Figure 6. LV AHA myocardial segmentation model and distribution of elevation angle values along a transmural profile (Heart 1). (a) Mid sectors of AHA 17-segment model and the transmural profile (black line). (b) Elevation angle values from downsampled PLI data. (c) Elevation angle values from DTI data. The circle points represent experimental data. The normalized transmural distance represents the distance from the LV center to the current position, while negative (or positive) values indicate the distance between estimated mid-wall to endocardium (or epicardium). AHA: American Heart Association.
Download figure:
Standard image High-resolution imageFigure 7 gives the distribution of elevation angles in the orange-delimited sub-area of Sector 11 (figure 6(a)) for downsampled PLI and registered DTI data. The elevation angle varies from positive to negative values when going from endocardium to epicardium of the free wall or from LV septum endocardium to RV septum endocardium. More singular elevation angle values are observed at the endocardium in PLI than in registered DTI, due to the presence of residual papillary muscles in PLI data.
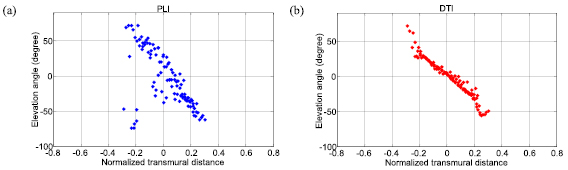
Figure 7. Transmural variation of elevation angles in the orange-colored sub-area of sector 11 in figure 6 at the level of the equatorial slice (Heart 1). (a) From downsampled PLI data. (b) From registered DTI data. The circle points represent experimental data.
Download figure:
Standard image High-resolution imageIn a more global manner, figure 8 shows the histograms of elevation angles at all pixels at basal, equatorial and apical slices. Clearly, the elevation angle histogram of PLI is much broader than that of DTI. The elevation angle histograms of both PLI and DTI exhibit coarsely a bimodal shape. Near the zero elevation angle, there is a rather abrupt change in amplitude of the histograms. It seems that the zero elevation angle value separates the histogram into two parts. For the three slices, the main energy of the PLI histogram is concentrated between the elevation angles −60° and +60° whereas that of the DTI histogram between −30° and +30°.
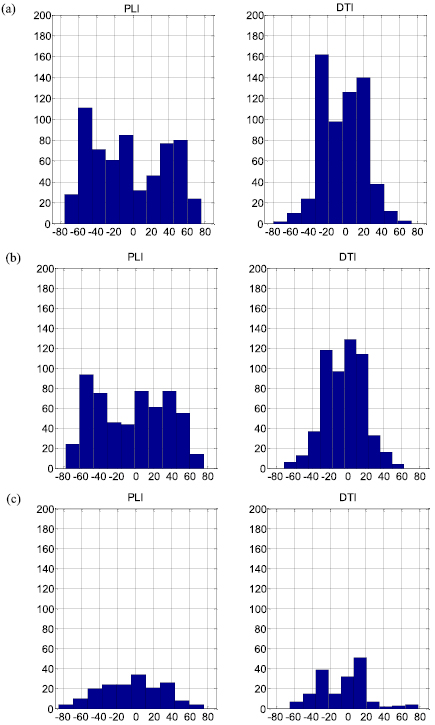
Figure 8. Elevation angle histograms of downsampled PLI (left column) and registered DTI (right column) at basal (a), equatorial (b) and apical (c) slices (Heart 1).
Download figure:
Standard image High-resolution imageThe experiments on the nine neonatal and infant hearts showed similar results on both elevation and azimuth angles. To more clearly compare the difference of the nine hearts for the two modalities and different resolutions, the transmural elevation angle ranges of the LV myocardium at basal, equatorial and apical slices for all the nine hearts are illustrated in figures 9(a)–(c) by box-and-whisker plots. The original DTI shows an obvious reduction (85° ± 11°, p < 0.001 at the basal and equatorial slices) in the transmural elevation angle range, compared to the original PLI. The registered DTI exhibits, at the basal and equatorial slices, a transmural elevation angle range about 25° (25° ± 14°, p < 0.005) smaller than that of the downsampled PLI that in turn presents a decrease of about 35° (35° ± 6°, p < 0.001) with respect to the original PLI. The transmural elevation angle range is significantly smaller at the apical slice than at the basal or equatorial slice in both the original PLI (15° ± 5°, p < 0.01) and the downsampled PLI (19° ± 13°, p < 0.05). Significant differences between apical and basal (or equatorial) slices were observed neither in the original DTI nor in the registered DTI within the nine hearts. Since the azimuth angle range remains very close at different slices, we illustrate in figure 9(d) the average azimuth angle range of basal, equatorial and apical slices for the nine hearts. The original PLI keeps an azimuth angle range of 179°, while the original DTI, the downsampled PLI and the registered DTI exhibit an azimuth angle range around 178°.
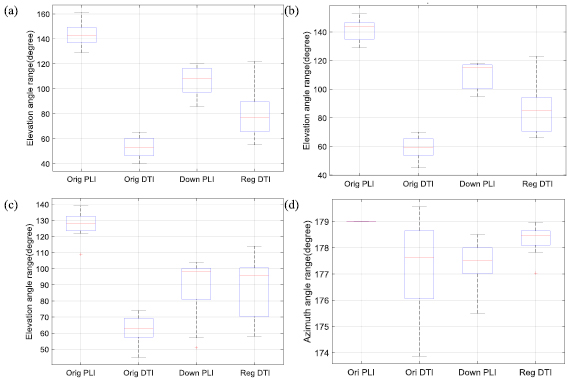
Figure 9. Transmural elevation angle ranges (degrees) at basal (a), equatorial (b) and apical (c) slices and azimuth angle ranges (degrees) (d) for nine human hearts. Orig PLI, Orig DTI, Down PLI and Reg DTI represent the original PLI, original DTI, downsampled PLI and registered DTI, respectively. The azimuth angle range represents the average value for the basal, equatorial and apical slices.
Download figure:
Standard image High-resolution imageConcerning azimuth angle characteristics, all the nine hearts exhibit boundaries (defined as borders between two colored regions in figure 10) in their azimuth angle maps derived from both DTI and PLI. In all the nine PLI azimuth angle maps, the boundaries are parallel to the rays from the LV center at equatorial slices, but present a clockwise twisting at basal slices and counter clockwise twisting at apical slices (figure 10(a)). Similar curved or twisting boundaries in the azimuth angle maps at basal and apical slices are observed in DTI (figure 10(b)) of the nine hearts, but less regular as compared to PLI.

Download figure:
Standard image High-resolution image
Figure 10. Azimuth angle maps of the nine hearts at the basal slice (left column), equatorial slice (middle column) and apical slice (right column) from downsampled PLI data (a) and registered DTI data (b). The thick black line or curves in (a) indicate the angle boundaries.
Download figure:
Standard image High-resolution image
4. Discussion
Similar variation patterns of elevation and azimuth angles were globally observed in both DTI and PLI. However, some differences are observed between the measurements from these two imaging modalities. Compared to the original PLI, the original DTI exhibits substantially reduced transmural elevation angle range. Also, elevation angle range is influenced by segmentation and/or registration involved in quantitative comparison. In contrast, the azimuth angle range remains almost unchanged whatever the imaging modality or processing (downsampling and registration) performed.
4.1. Influence of registration
As observed in the above results, registration has widened the range of transmural elevation angles. This can be explained as follows. The involved DTI registration is a relatively complex nonlinear process that aims to register the low-resolution DTI data to the high-resolution PLI data. In such nonlinear process are involved a few operations such as interpolation. After such nonlinear process, the original DTI is registered to the downsampled PLI, with the consequence that the registration produces at the same time the effect of increasing the low-resolution of the original DTI data roughly to the higher-resolution of the downsampled PLI data. In other words, the involved registration reconstructs by essence a new high-resolution DTI data that have comparable resolution to that of the downsampled PLI. Such increase in spatial resolution of the registered DTI would be mostly responsible for the widening of its elevation angle range. Note that the spatial resolution increase was not simply due to the involved interpolation. This is because simple interpolation alone does not allow for the improvement of the spatial resolution.
In addition to the fact that registration widens the transmural elevation angle range as just mentioned above, registration also has the effect of smoothing local variations of elevation angles, due to the involved interpolation.
In the present study, the elevation angle maps were chosen as the mask for registration instead of b0 (i.e. b = 0 or not DW) or trace (the average of the three eigenvalues of the diffusion tensor) images that are often used in DTI registration. This approach has been taken because no corresponding b0 or trace images exist in PLI.
4.2. Reduction of transmural elevation angle range
When passing from high spatial resolution to lower spatial resolution, the transmural elevation angle range of the downsampled PLI was reduced by about 35° in average (under the downsampling factor 4), as compared to the original PLI. Such reduction is obviously caused by the decrease in spatial resolution of downsampled PLI with respect to the original PLI.
A net reduction of transmural elevation angle range was observed in registered DTI with the downsampled PLI as the reference (25° ± 14°). These two sets of data are comparable in the sense that they have been aligned and can be considered in anatomical correspondence. The reduction of 25° in average is perhaps due to the DTI itself. In fact, the reduction caused by (original) DTI itself is even greater than 25°, because the registered DTI has widened the transmural elevation angle range with respect to the original DTI due to the spatial resolution increase.
4.3. Influence of papillary muscles
The presence of residual papillary muscles after segmentation of the images generated outliers in elevation angle maps, which can artificially increase the range of elevation angles. Our experiments showed that, after removing the outliers, a decrease of 6° ± 1° and 14° ± 8° on the transmural elevation angle range was observed respectively for original PLI and original DTI, and about 15° ± 4° and 13° ± 4° decreases respectively for downsampled PLI and registered DTI. The relatively small difference (6° ± 1°) between with and without removing outliers in original PLI is due to the fact that original PLI has a much higher spatial resolution with very smooth transitions at epi- and endocardial borders. As a result, removing one or two pixels will not induce a great change on the angle distributions. In contrast, abrupt variation of elevation angles between neighboring pixels was observed for original DTI that has a much lower resolution (about one twentieth of the original PLI, with less than 10 pixels transmurally).
4.4. Twisting boundary of azimuth angles
By comparing the variations in azimuth angle at different slice levels from both DTI and PLI, we observed that the circular visiting pattern of azimuth angles was very similar from basal to apical slices including equatorial slice, except that the twisting of the boundaries diminished when going from the basal or apical slice to the equatorial slice. This is due to the fact that the parallel or twisting boundary reflects the 2D projection characteristic of the 3D helical structure of fibers.
4.5. Characterization of azimuth angle maps
We observe that the variation of azimuth angle ranges is on the order of a few degrees while the variation of elevation angle ranges is on the order of several tens of degrees. In other words, the difference in azimuth angle range between DTI and PLI is small. Such small difference in azimuth angle range however does not allow us to conclude that the azimuth angle map of DTI is the same as that of PLI. Indeed, difference between DTI and PLI azimuth angle maps is clearly visible in figures 5 and 10. That can be explained by the fact that, as a global quantitative metric, the azimuth angle range can only describe some limited characteristics of azimuth angle maps. Then, the question raises how to quantify in a pertinent manner the characteristics of azimuth angle maps of the myocardium. To our knowledge, there is still no standard metric for characterizing azimuth angle maps, the azimuth angle range we used being one metric among other possible ones. Further study on this issue may be worth pursuing.
4.6. Influence of formalin fixation
Previous results on animals (rats) suggest that cardiac tissues preserved in formalin prior to DTI imaging clearly showed an increase in water diffusivity and a decrease in the anisotropy degree, but there is some concern about the change in myocyte orientation. Indeed, Gilbert et al found that there is a low sensitivity of DTI-derived myocardial orientations in a rat to time post-fixation (Gilbert et al 2013), while, always on rats, Giannakidis et al showed that the cardiac tissue immersion in formalin caused the loss of the primary water diffusion orientation integrity in terms of the inter-voxel diffusion coherence index (IVDC) (Giannakidis et al 2016). Nevertheless, both the studies led to the same finding that the formalin fixation did not change the classic transmural variation of helical angles, from negative values at the epicardium to zero degree at the mesocardium (or midmyocardium) to positive values at the endocardium. Both our DTI and PLI results further confirmed that formalin fixation does not hamper the property of such helical angle transmural variation. Furthermore, since orientation from PLI represents the mean value of the orientations of all myosin filaments contained in a pixel while the myosin filaments are not degraded by formalin (Jouk 1994), that implies that the reduction in transmural elevation angle range observed in DTI really exists with respect to PLI. We (and other prior works) were however not able to determine whether such reduction is due to DTI itself or to formalin (or even to both of them) since we had not, for the same hearts, experimented with different formalin immersion durations. Also, we are not able to determine whether such reduction is due to noise or anything else because it concerns real cardiac tissues and we do not know the ground-truth.
4.7. Correlation between FA, MD and age
FA and MD are two different DTI indices that represent different aspects of the same phenomenon. FA is more related to the notion of 'direction' while MD reflects more the notion of 'extent, intensity, fluency'. In principle, we cannot establish any theoretical correlation between them because FA and MD are affected not only by tissue microstructure (which is highly complex and variable in the case of myocardium) but also by acquisition parameters (Barrio-Arranz et al 2015). Nevertheless, for our experimental results (table 1), by reporting the FA and MD values on the same plot, we observed a negative correlation between FA and MD values (correlation coefficient = −0.87) for the nine hearts. Concerning the correlation between FA (or MD) and age, by reporting FA (or MD) and age values on the same plot, we did not find any obvious relationship between them (correlation coefficients for FA versus Age and MD versus Age were 0.26 and −0.42, respectively).
4.8. Difference between ex vivo and in vivo cardiac DTI
The main difference between ex vivo and in vivo cardiac DTI is that we need not to consider motion effects (respiratory and cardiac motions) during ex vivo cardiac DTI. As a result, in ex vivo cardiac DTI, we can have higher SNR, better spatial resolution and no artifacts, which leads to wider helix angle ranges with respect to in vivo cardiac DTI (Nielles-Vallespin et al 2013, Toussaint et al 2013, Wei et al 2015). In addition, the fact that in vivo data are acquired at different cardiac phases may make it difficult to compare ex vivo and in vivo cardiac DTI in an accurate manner. Finally, in the present study, we used elevation angle (in order to compare with PLI) while in existing in vivo cardiac DTI, the results were expressed in terms of helix angle. So, to be able to compare the fiber orientations obtained in the present ex vivo cardiac DTI with those of in vivo cardiac DTI, we first need to do conversions between the elevation angle-azimuth angle system and the helix angle-transverse angle system. This may be an interesting topic of further investigation.
A last but very interesting point is related to the finding of Giannakidis et al on rodents (Giannakidis et al 2016), which demonstrates that the prolonged exposure to fixative resulted in a flatter probability density of helical angles with heavier tails. In reality, their helical angle probability densities, flatter or not, always exhibit a bimodal shape, namely they have two peaks, between which there is a valley near zero degree. Our results on human hearts appear comparable to this finding on rat hearts. Indeed, all our elevation angle histograms (equivalent to probability density for discrete case) from both DTI and PLI exhibit a bimodal shape. All these findings demonstrate that one of the most pertinent features of myocardial tissues (for human or animals) would be the bimodal shape distributions of their elevation or helical angle maps.
In conclusion, we have performed a thorough and quantitative comparison of DTI-derived and PLI-derived fiber orientations in human neonatal and infant hearts. Similar variation patterns of elevation and azimuth angles were found in DTI and PLI, but clear differences in transmural elevation angle range were observed. In particular, DTI introduced an underestimation of about 25° ± 8° in average in transmural elevation angle range at the basal and equatorial slices. The reduction of spatial resolution also decreased the transmural elevation angle range. PLI data exhibited a 15° ± 5° (P < 0.01) narrower transmural elevation angle range at apical slices as compared to basal and equatorial slices. This phenomenon was not found in DTI data. Both modalities showed that their azimuth angle maps have twisting boundaries at the basal and apical slices. This study globally enforces DTI as a valid imaging technique to reasonably characterize fiber orientations of the human heart non-invasively while showing that the imaging modality causes obvious underestimation of transmural elevation angle range and the disappearance of some features in azimuth angle maps. In addition, the framework proposed in this work can be applied to investigate the brain fiber microstructure such as fiber crossing by comparing PLI data with orientation distributions functions (ODFs) (Axer et al 2016) in high angular resolution DW imaging (HARDI). In the present study, we have used the elevation angle range and the azimuth angle range as metrics to analyze and characterize the elevation and azimuth angle maps of the myocardium. In the future, it would be interesting to seek for other metrics to more adequately characterize individual myocardial fiber arrangements.
Acknowledgment
This work was supported by the National Basic Research Program of China under Grant No. 61671049, 61301002, the National Key R&D Plan of China under Grant No. 2017YFB1400100, the French ANR (under MOSIFAH ANR-13-MONU-0009-01) and the program PHC-Cai Yuan Pei 2016 (No. 36702XD). This work was also performed within the framework of the LABEX PRIMES (ANR-11-LABX-0063) of Université de Lyon, within the program 'Investissements d'Avenir' (ANR-11-IDEX-0007) operated by the French National Research Agency (ANR).