On a Flood-Producing Coastal Mesoscale Convective Storm Associated with the Kor’easterlies: Multi-Data Analyses Using Remotely-Sensed and In-Situ Observations and Storm-Scale Model Simulations


Abstract
:
1. Introduction
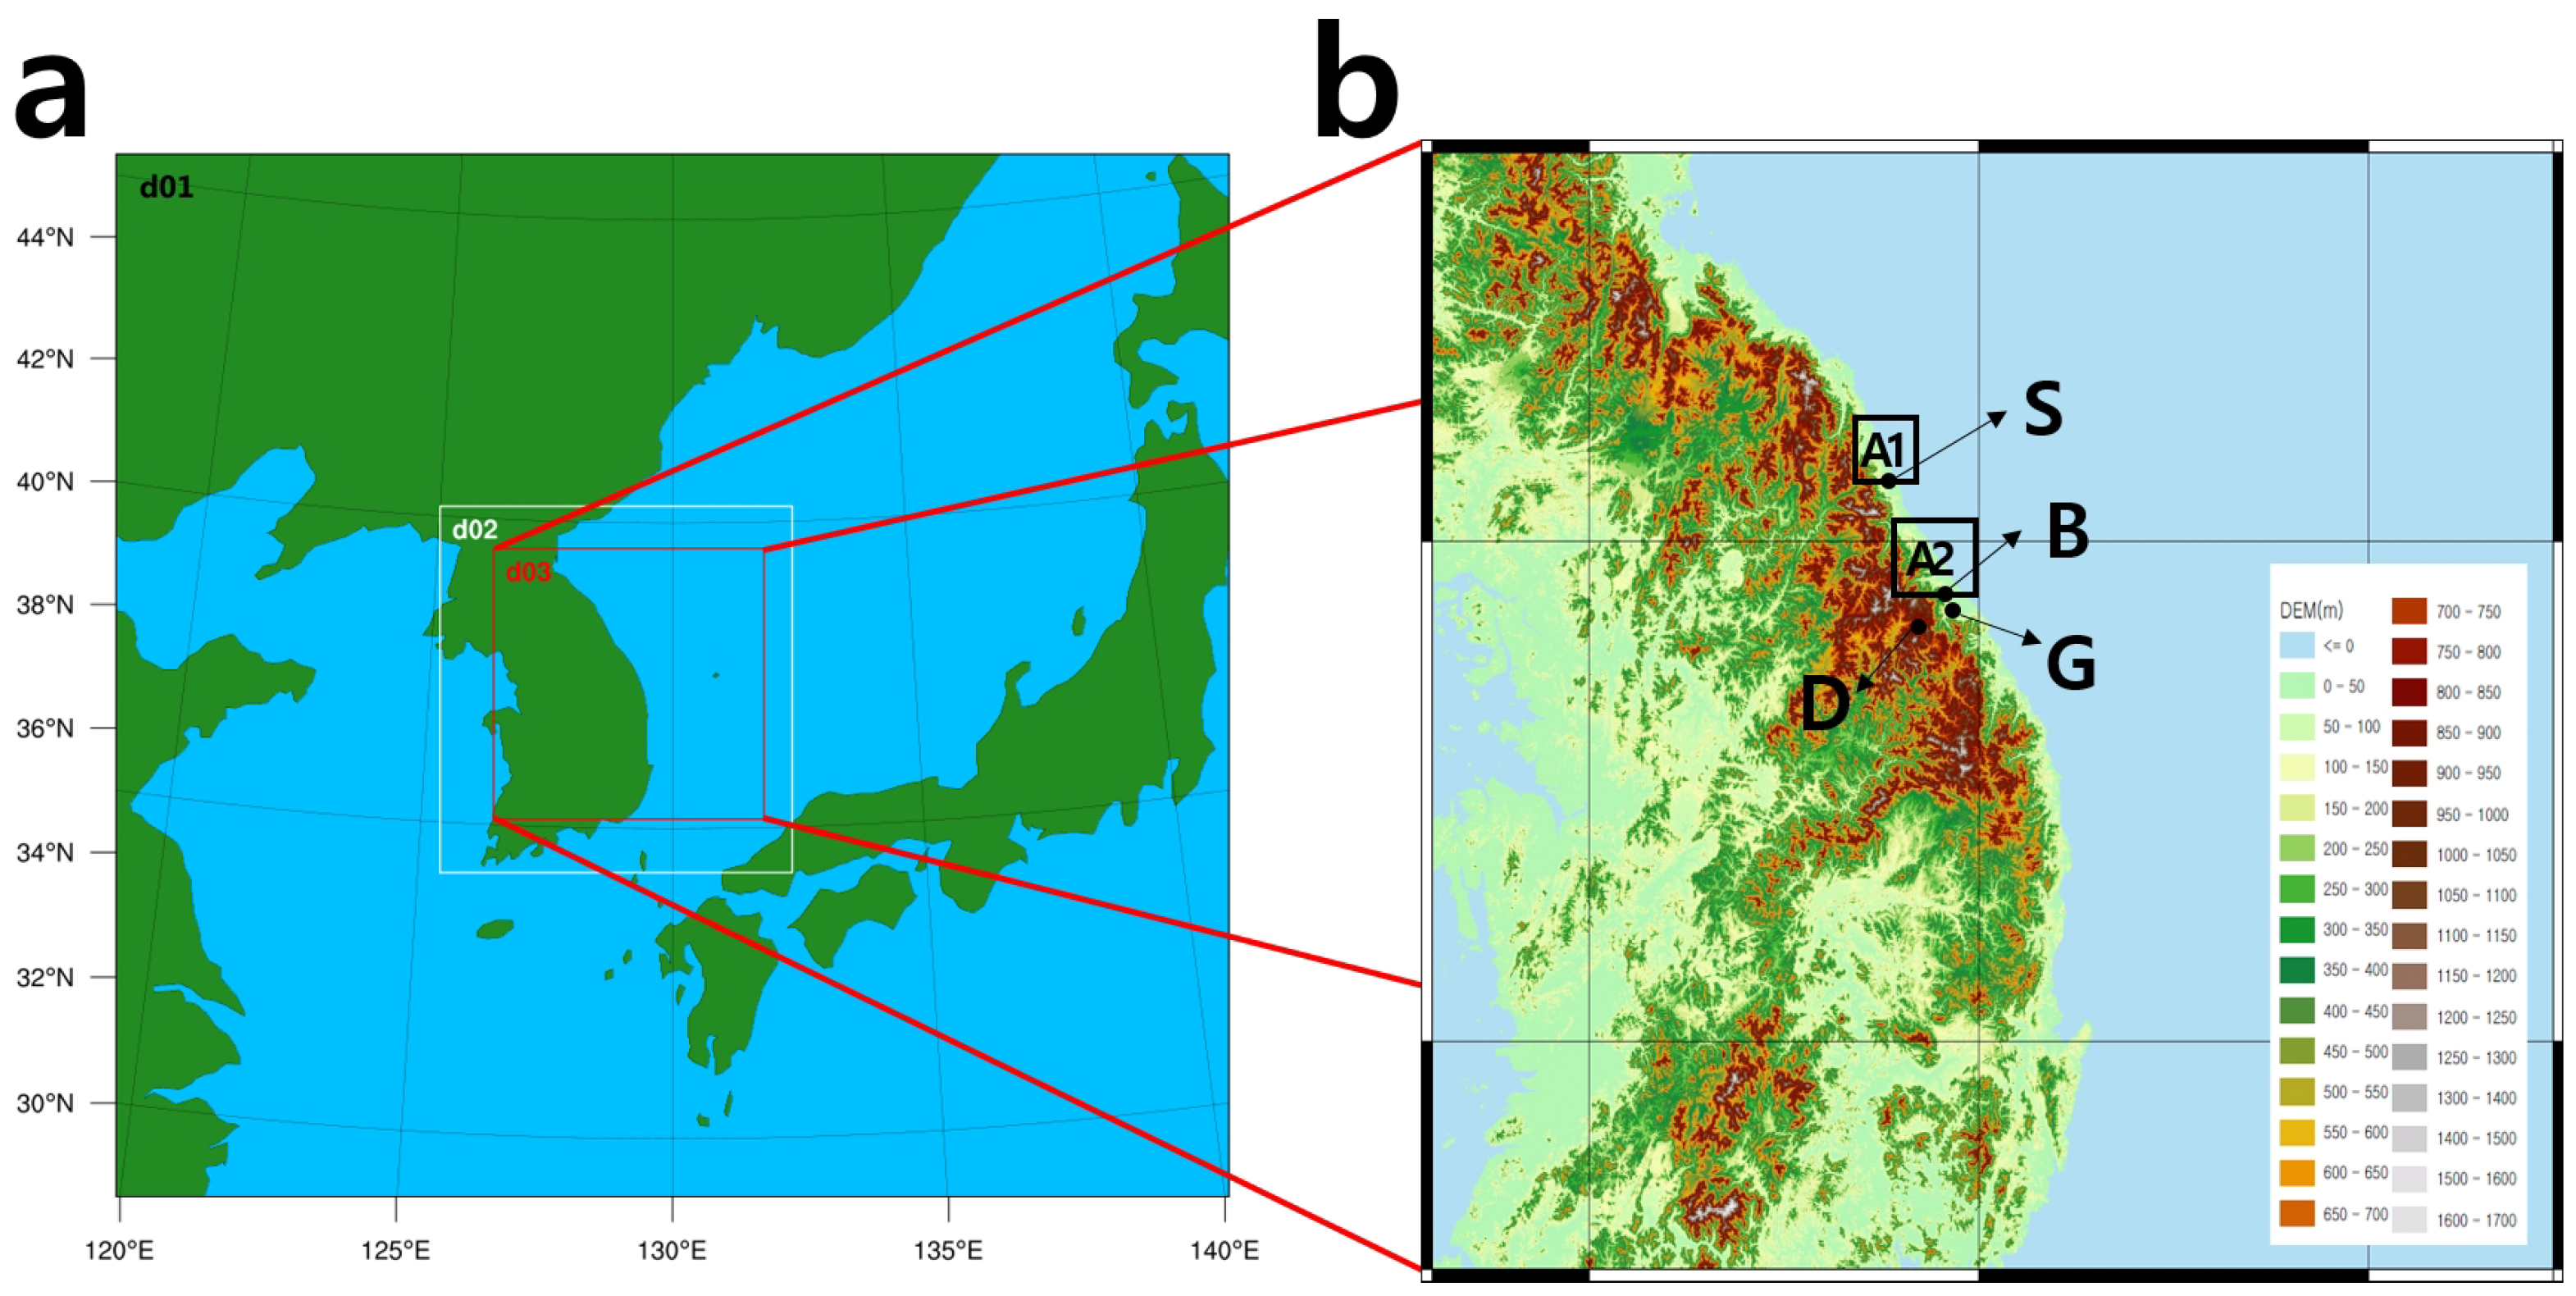
2. Method and Data
2.1. Numerical Simulation
2.2. Observation Data
2.3. Parameters for Thunderstorm Potential and Lifting Forcing
3. Case Description and Model Validation
4. Results
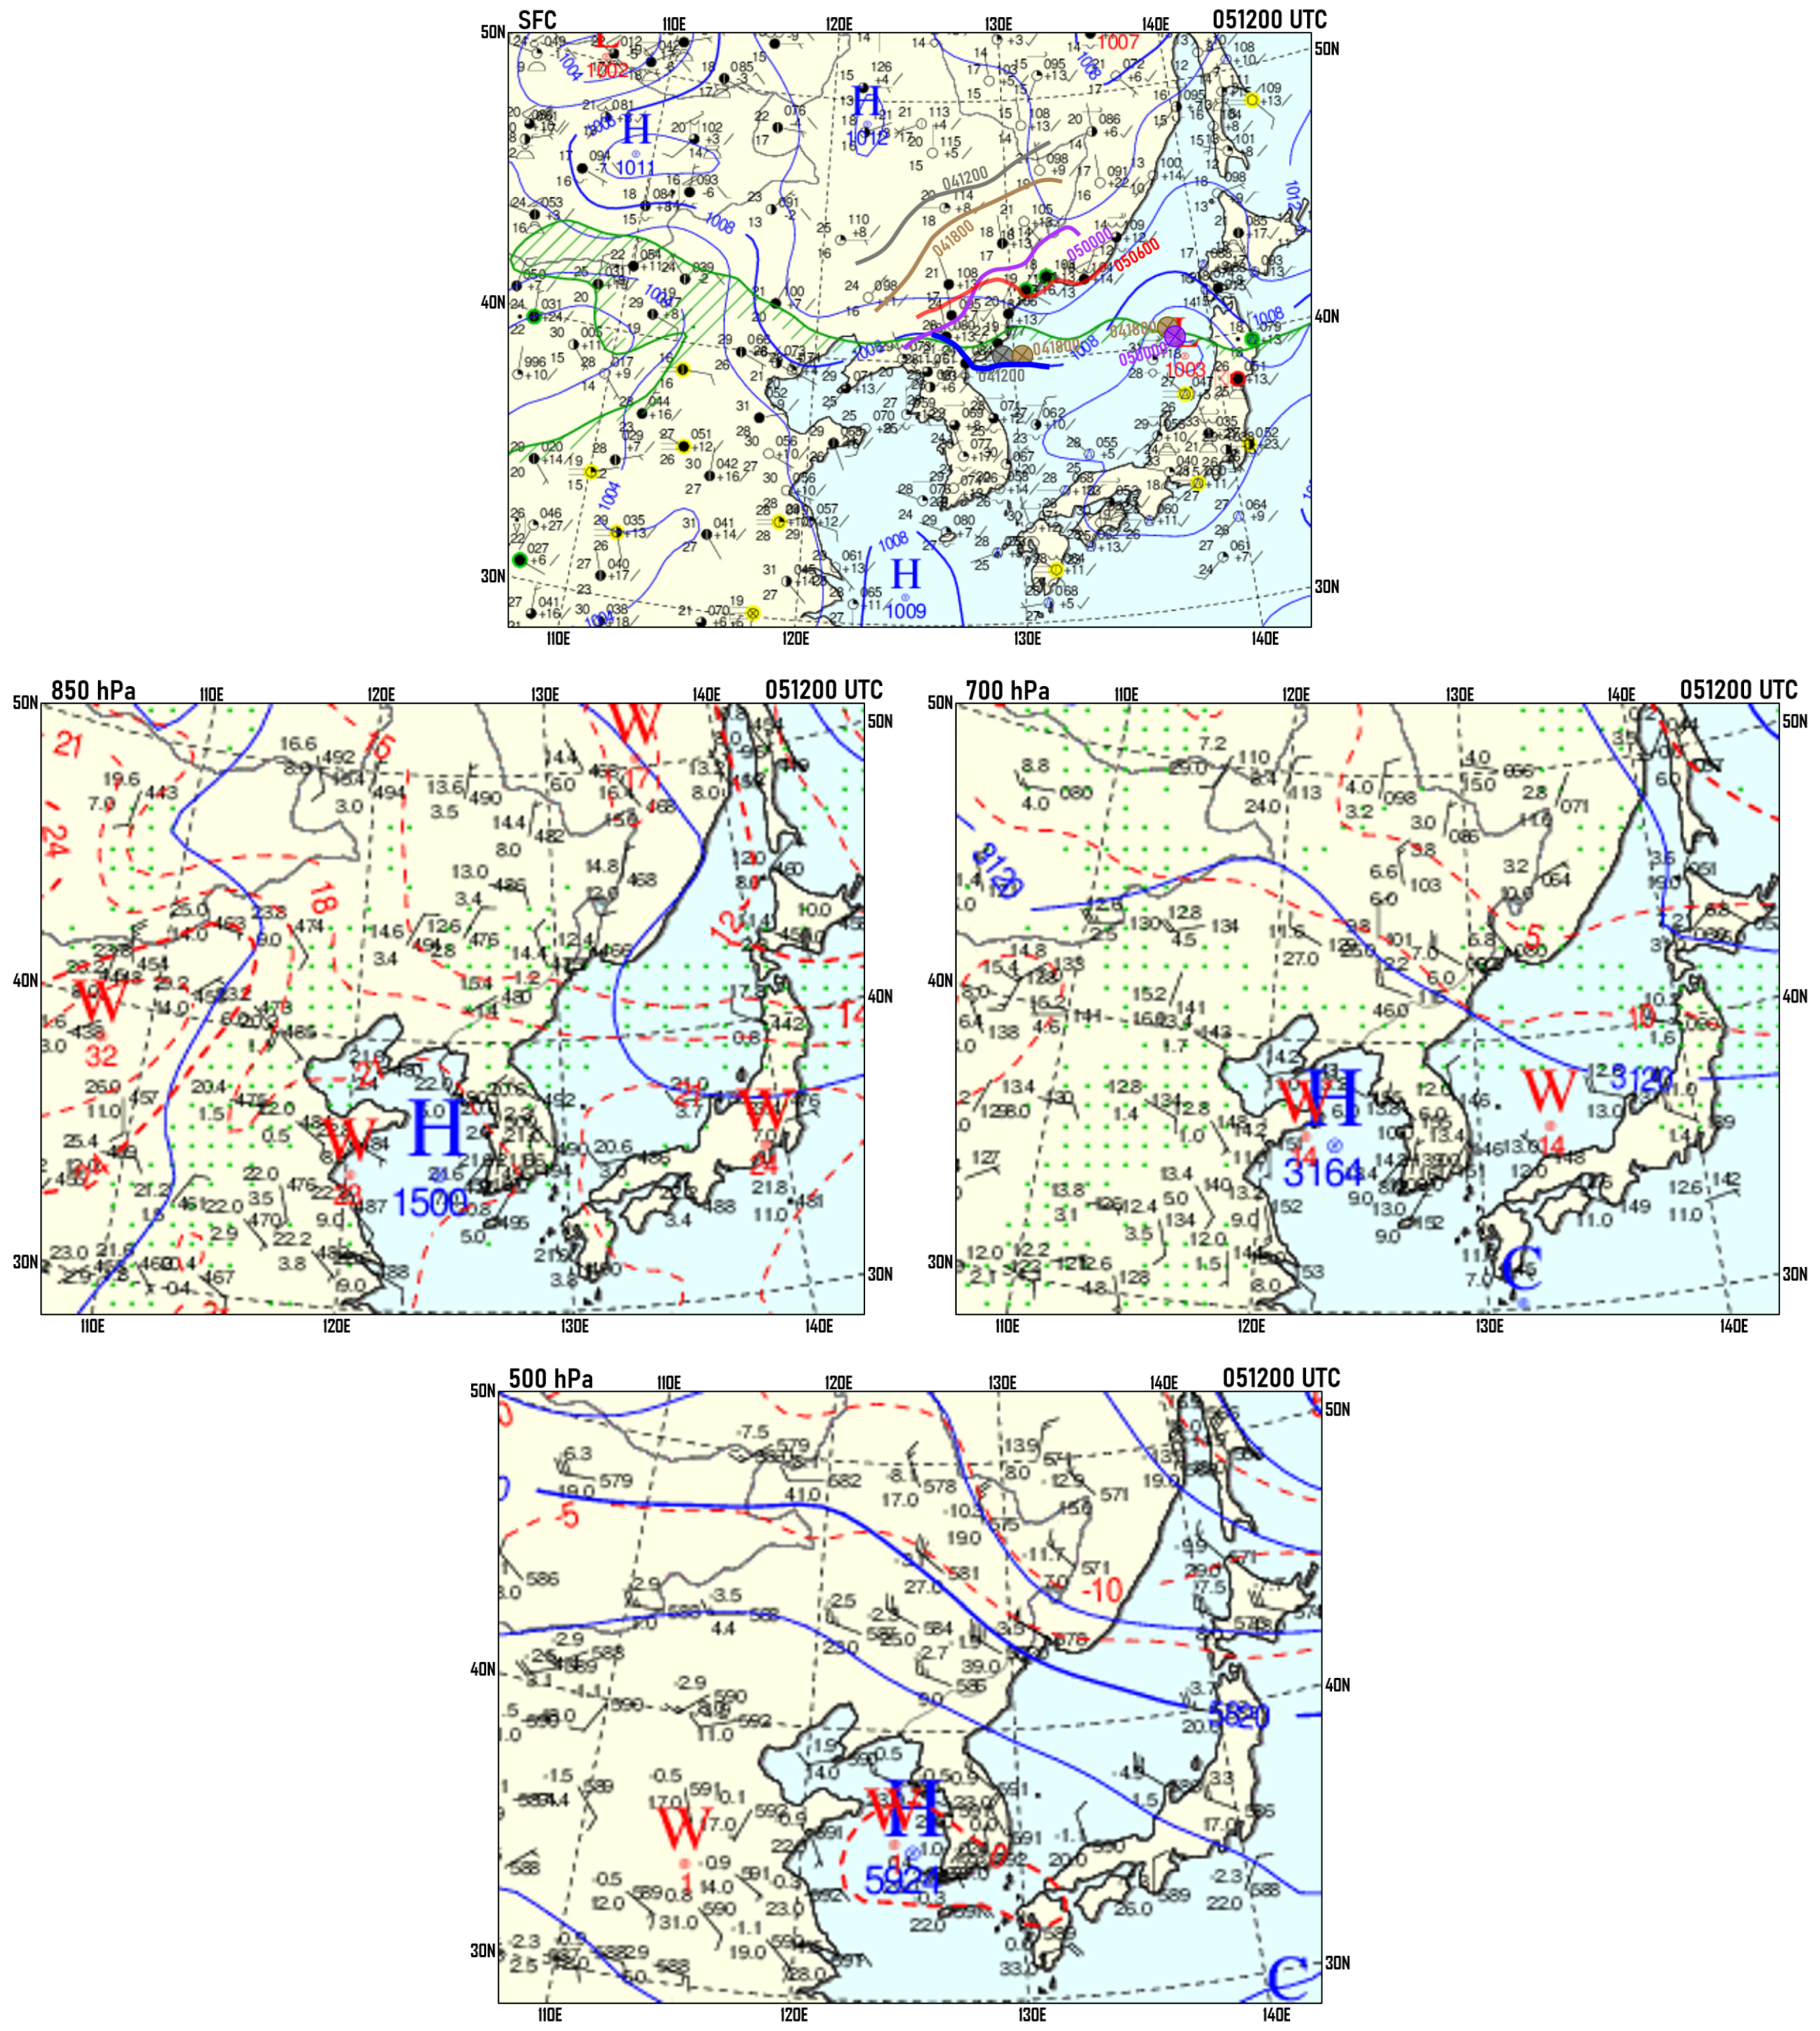
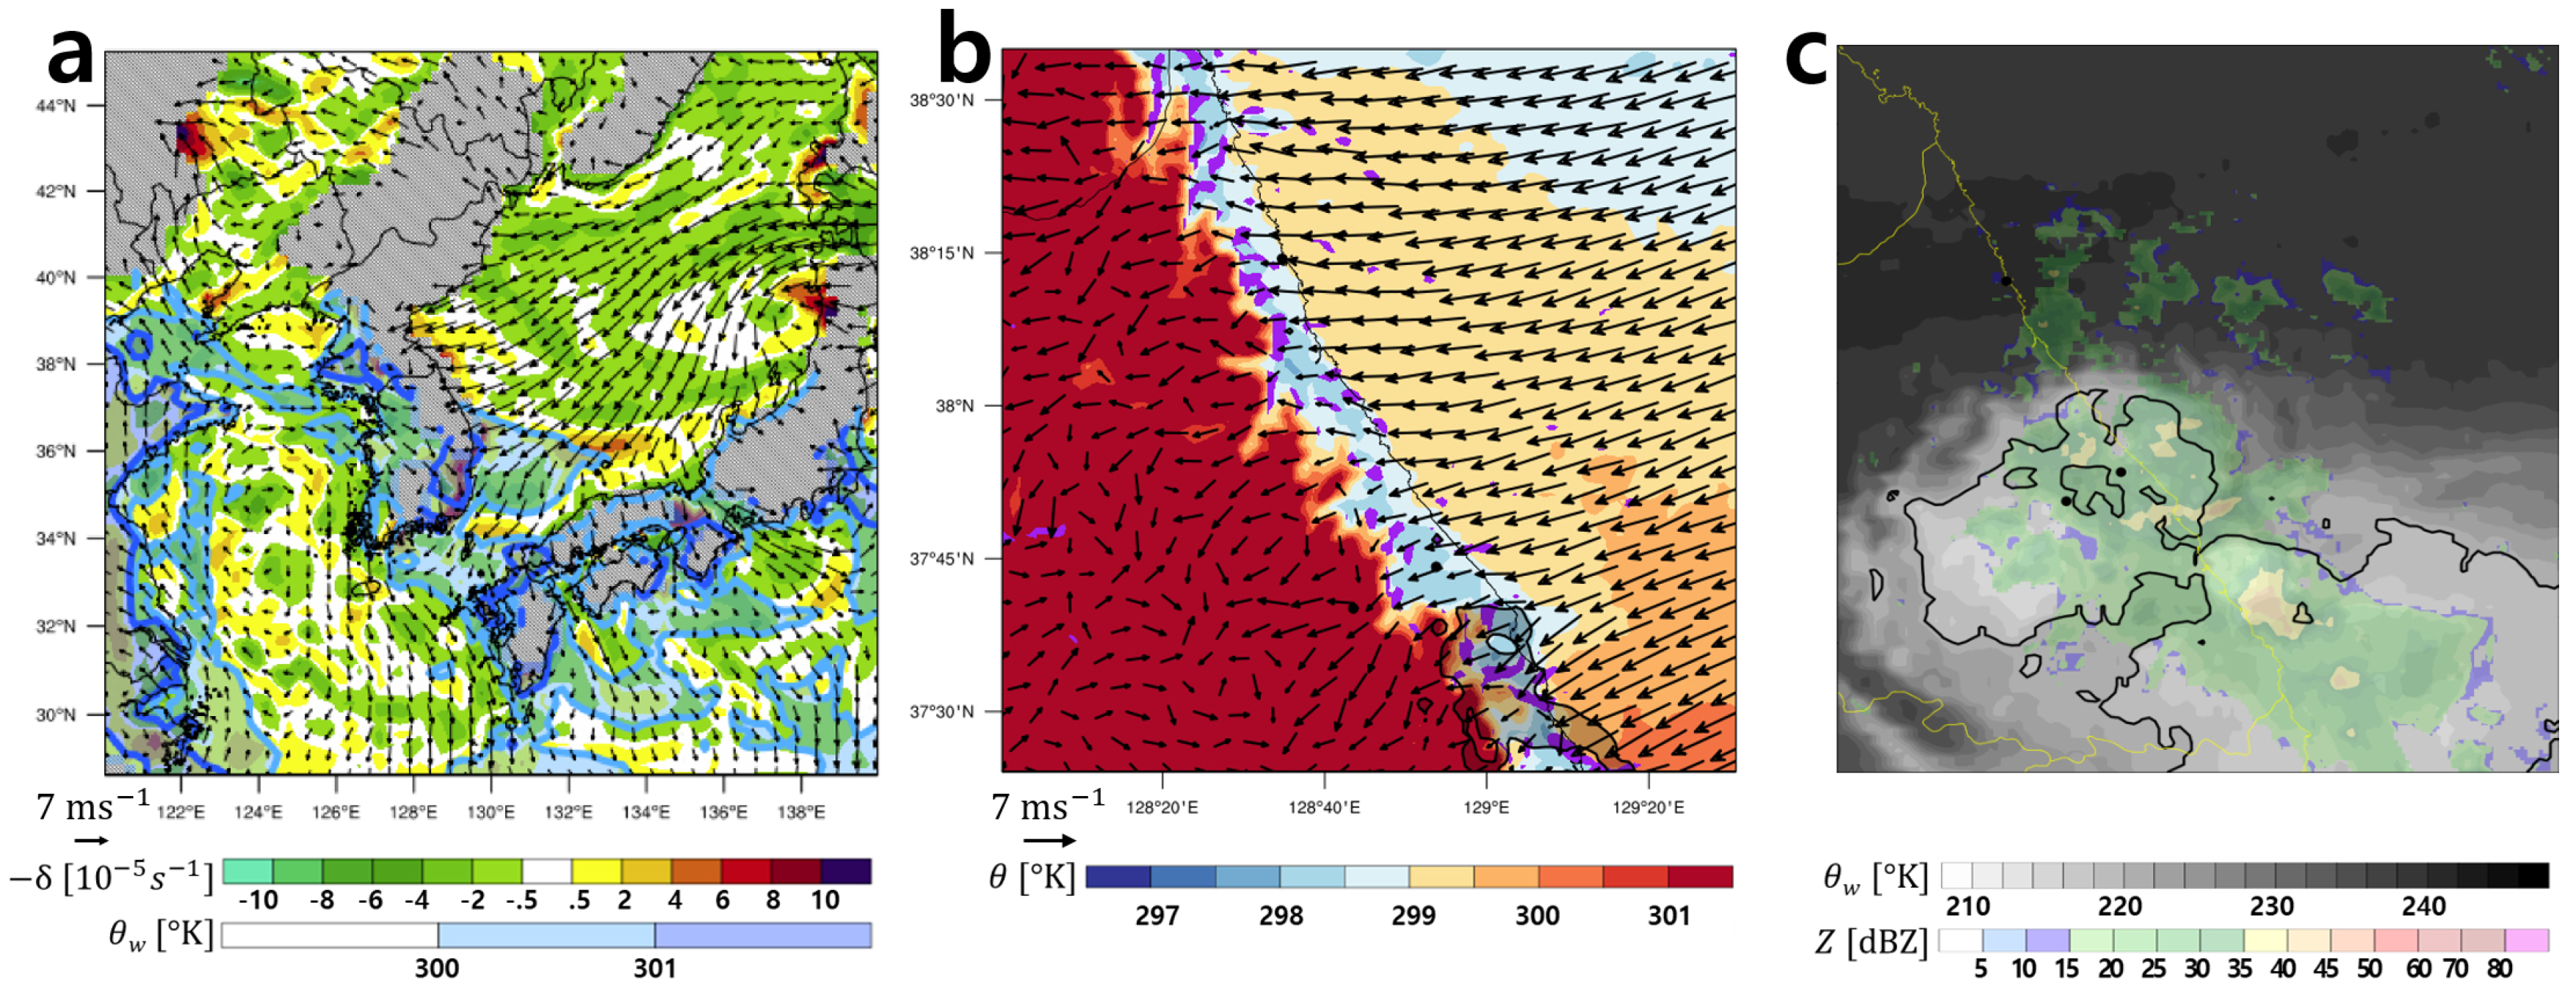
4.1. Synoptic Environment
4.2. Mesoscale Features of the Heavy Rainfall System
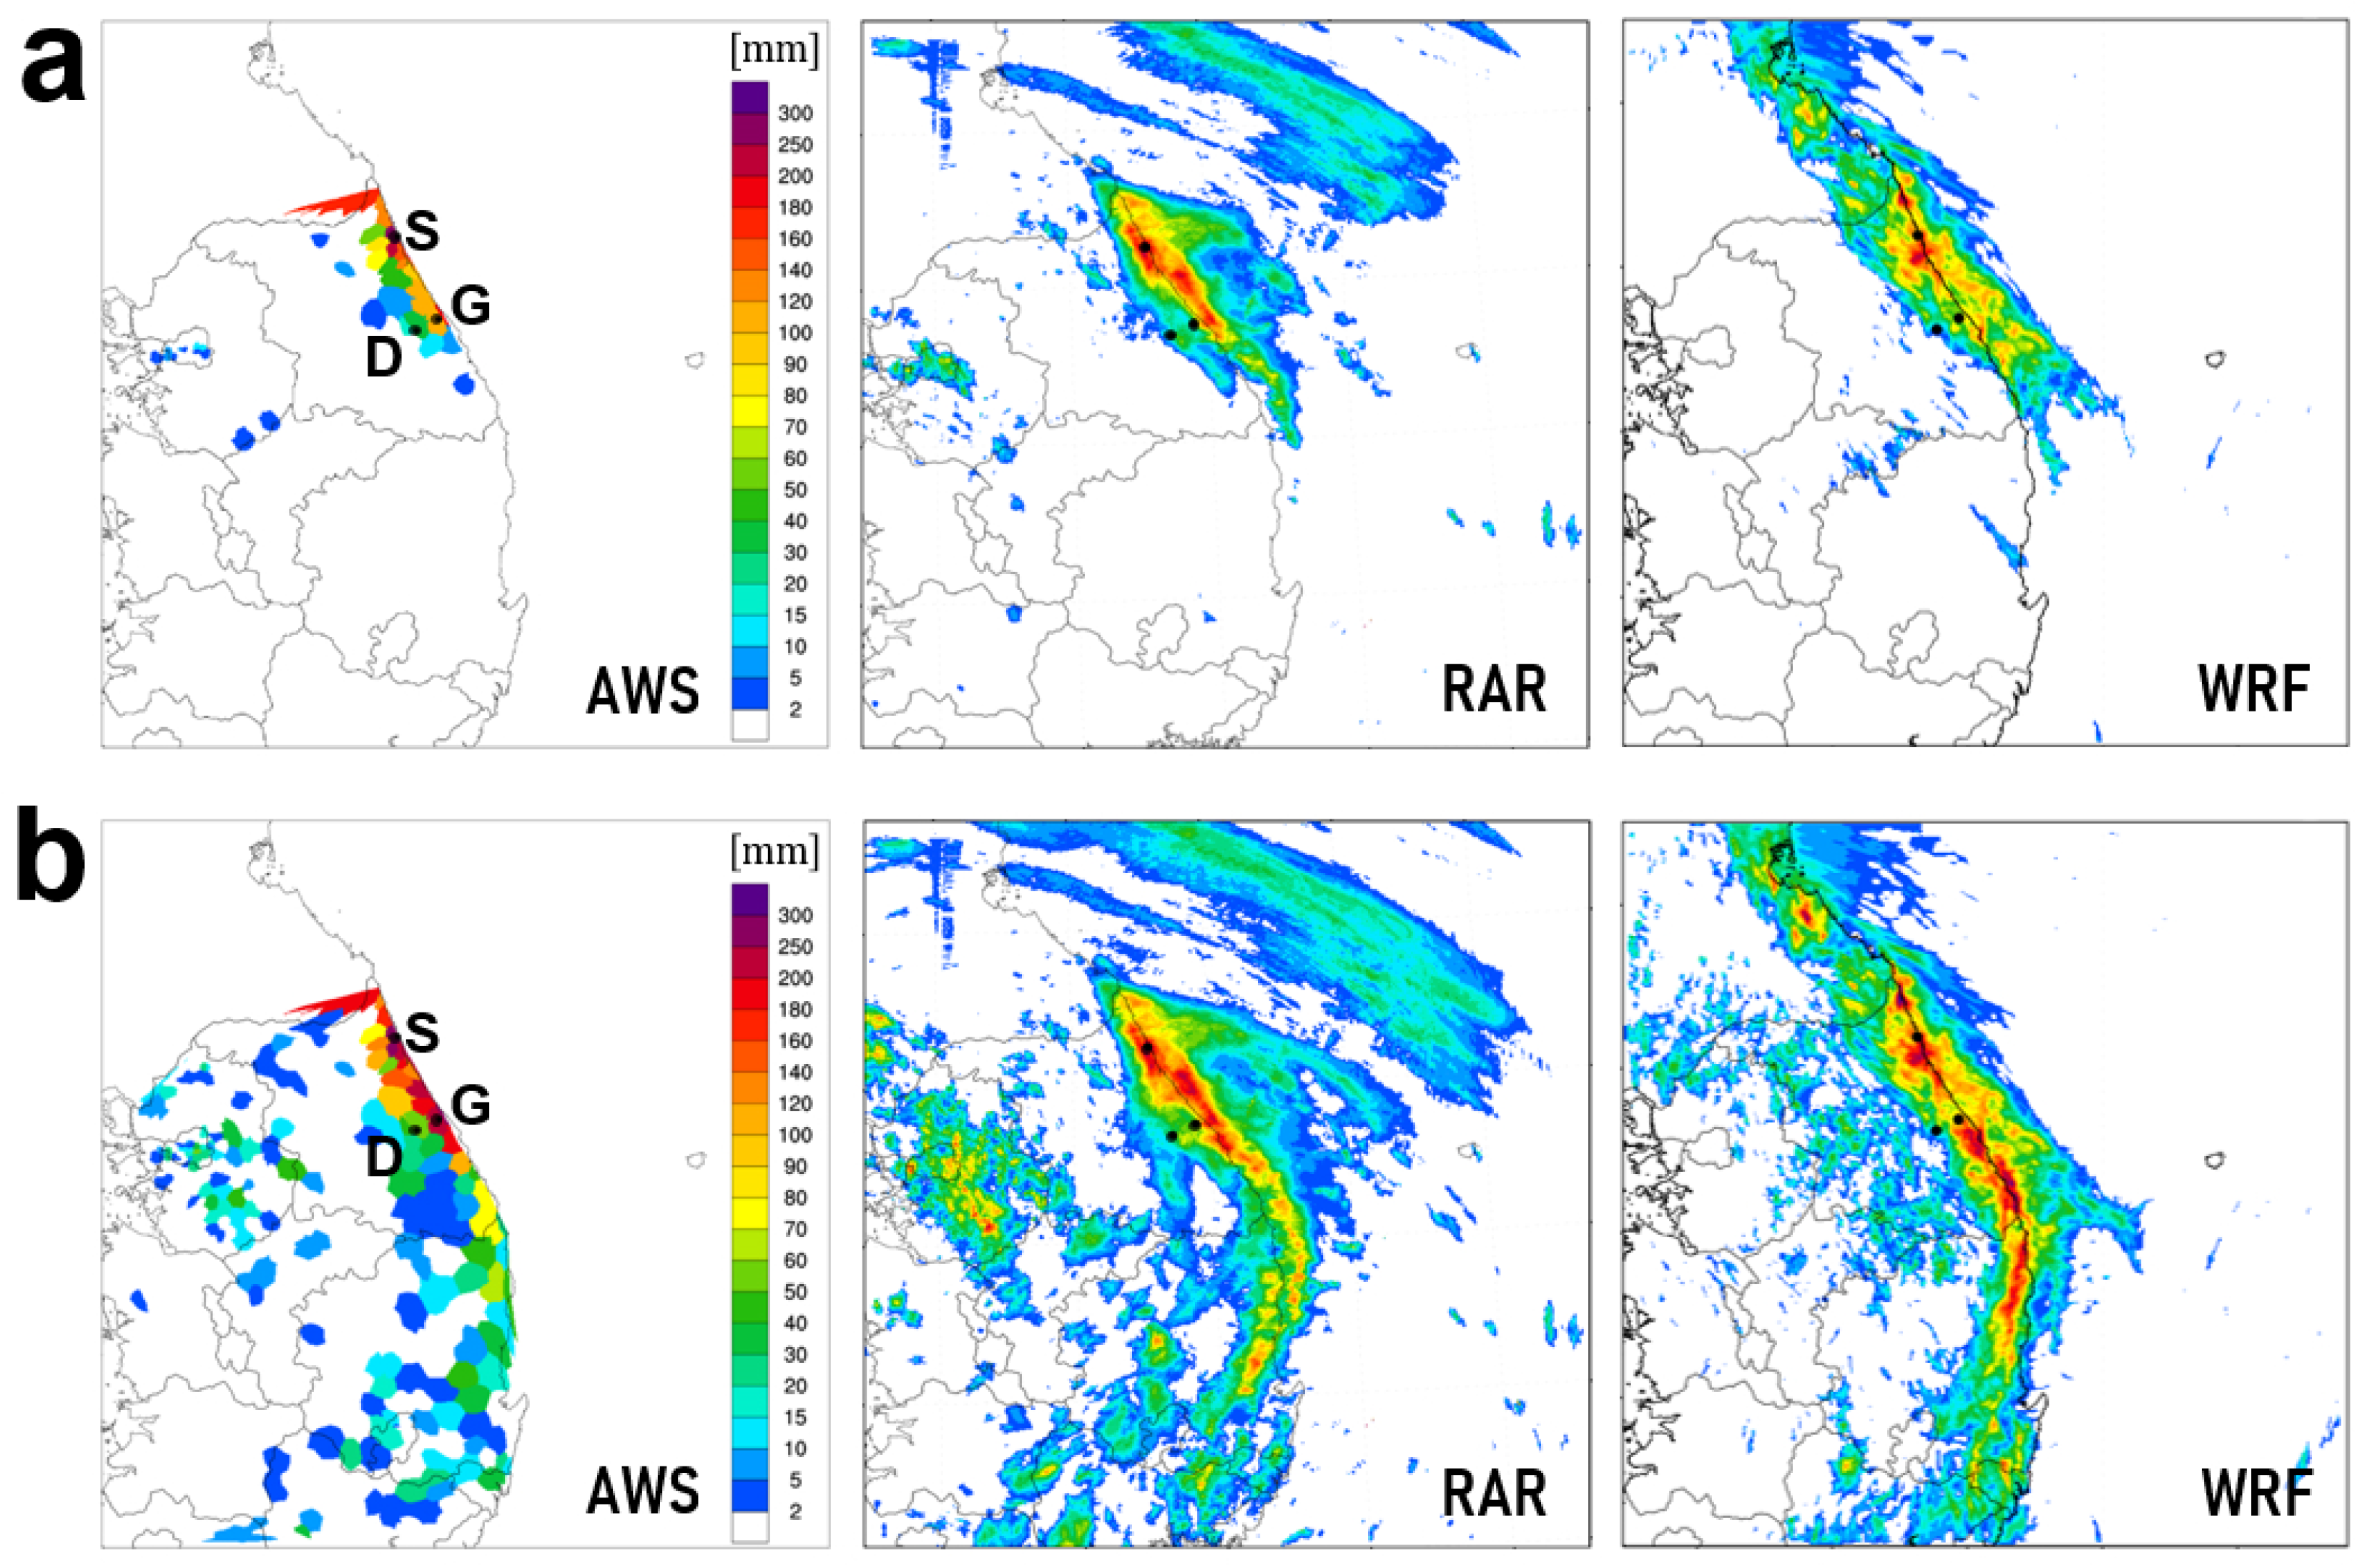
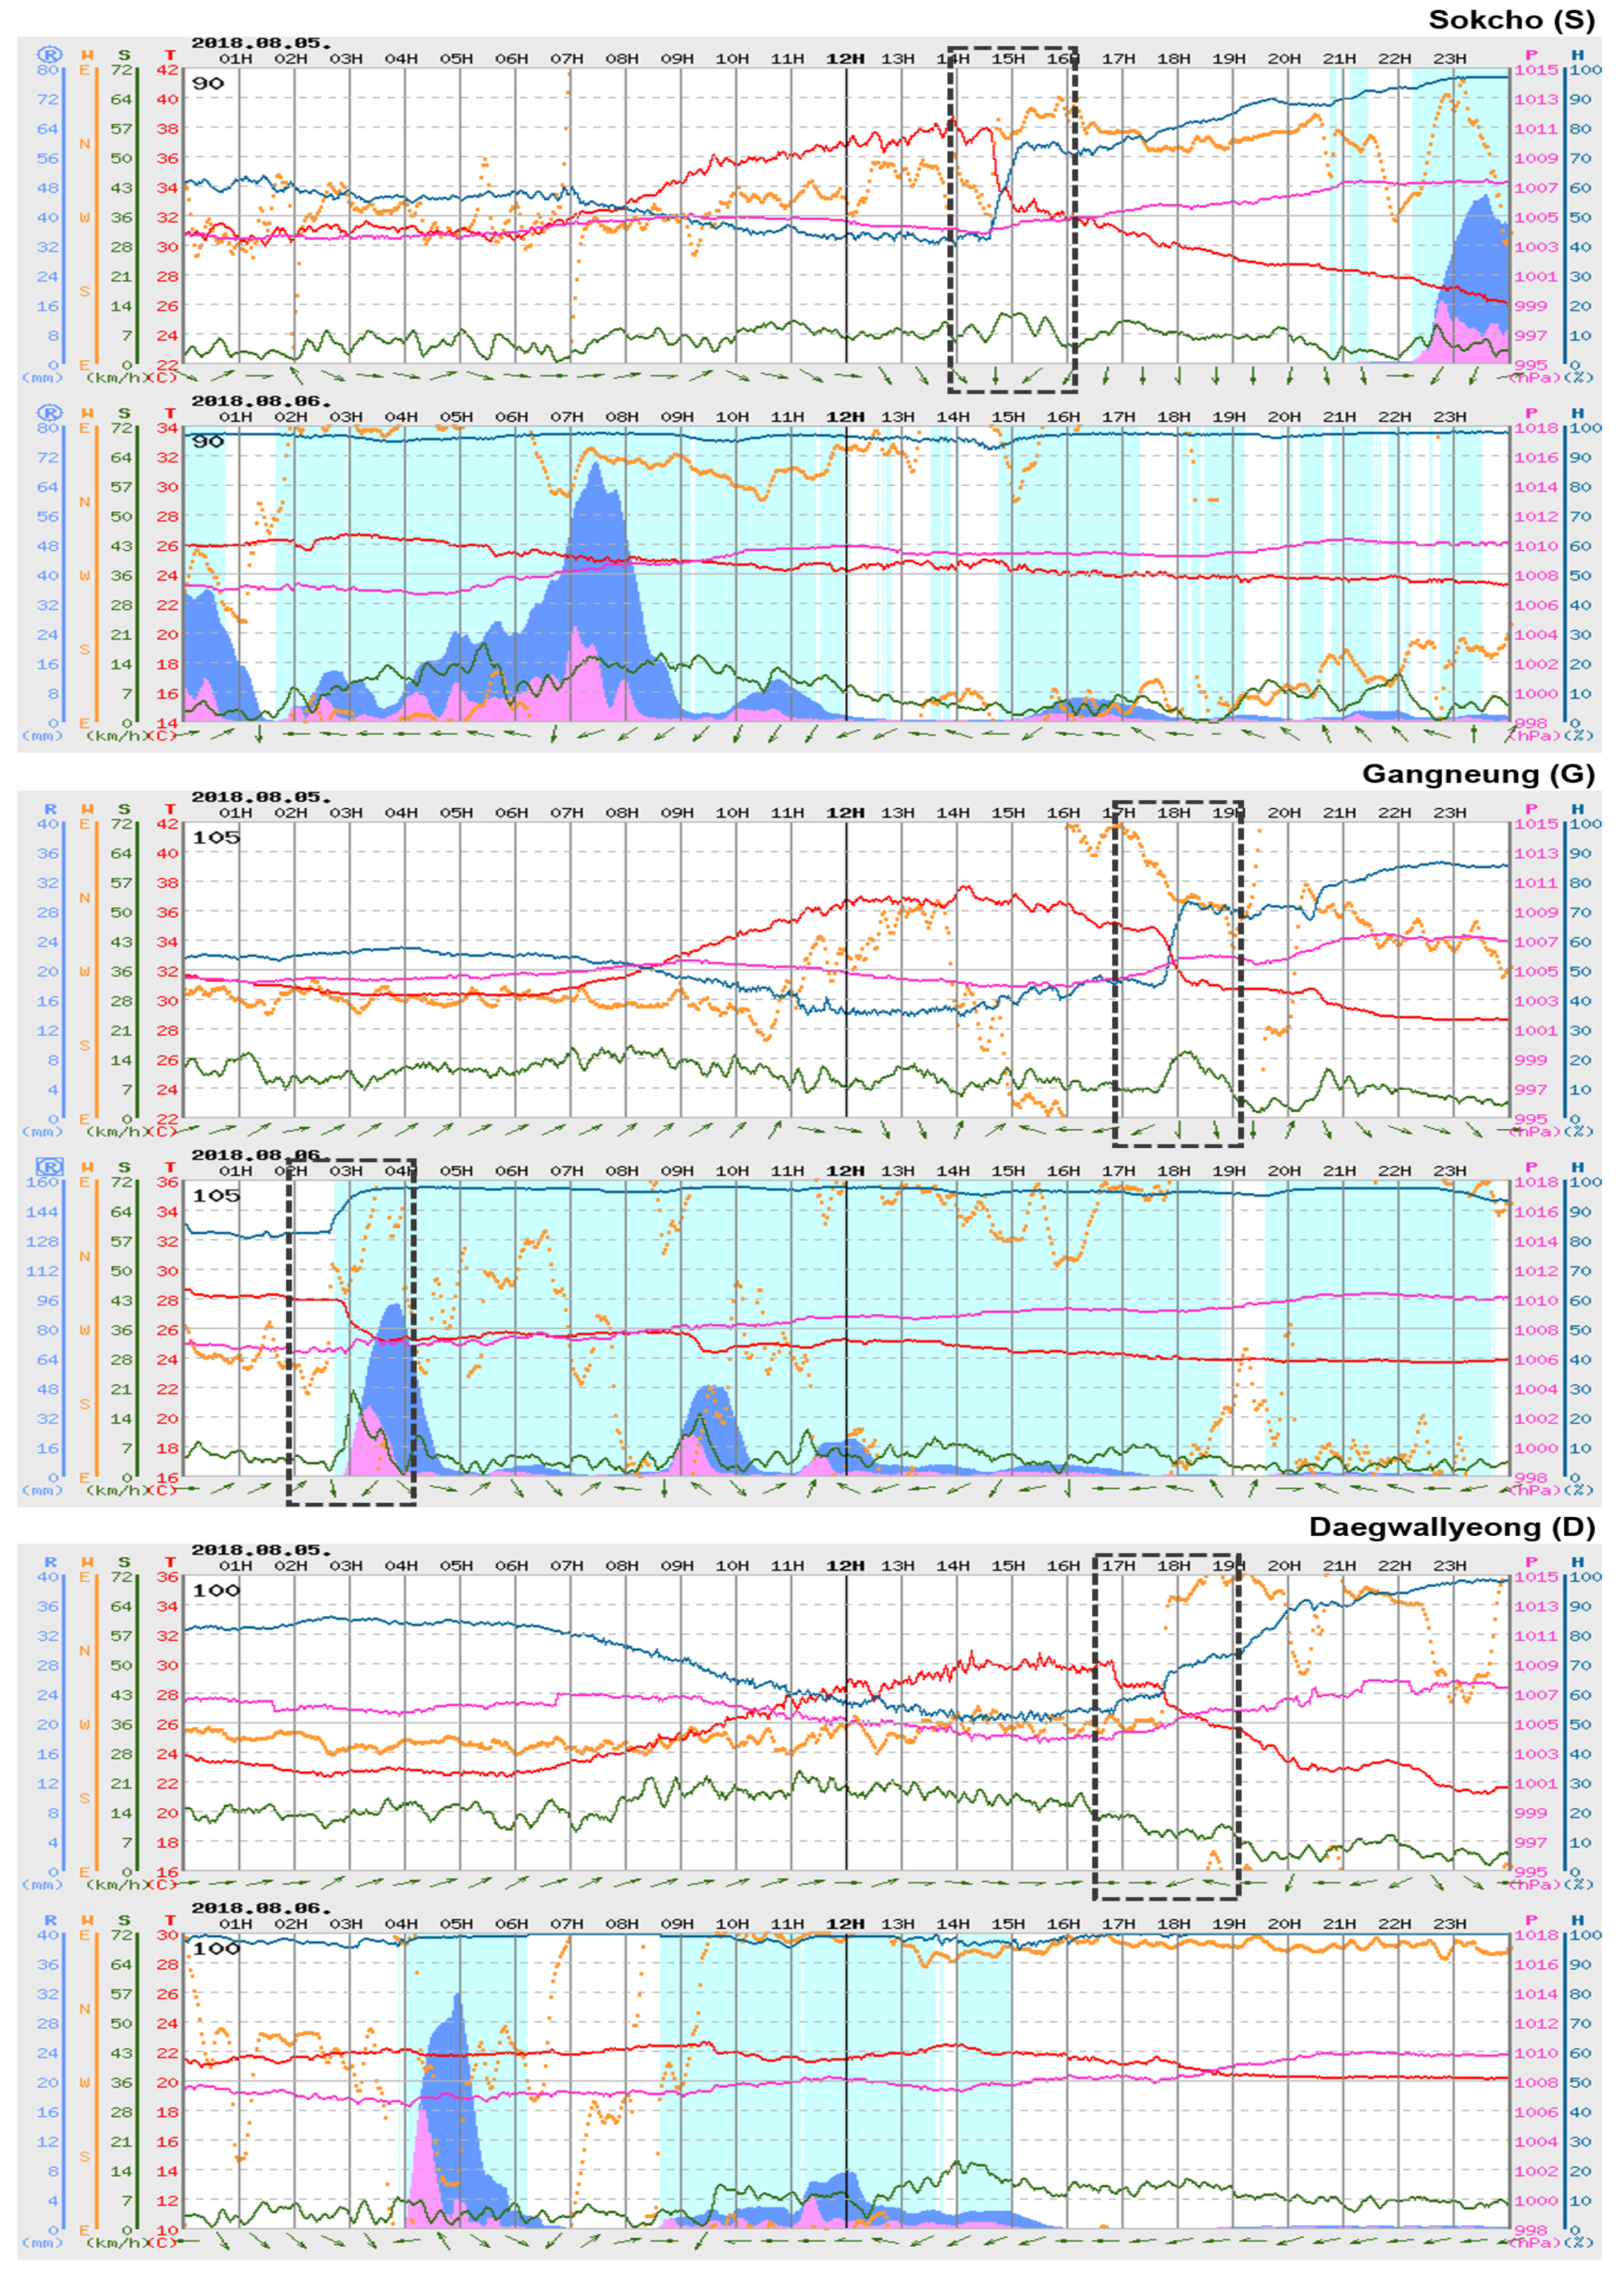
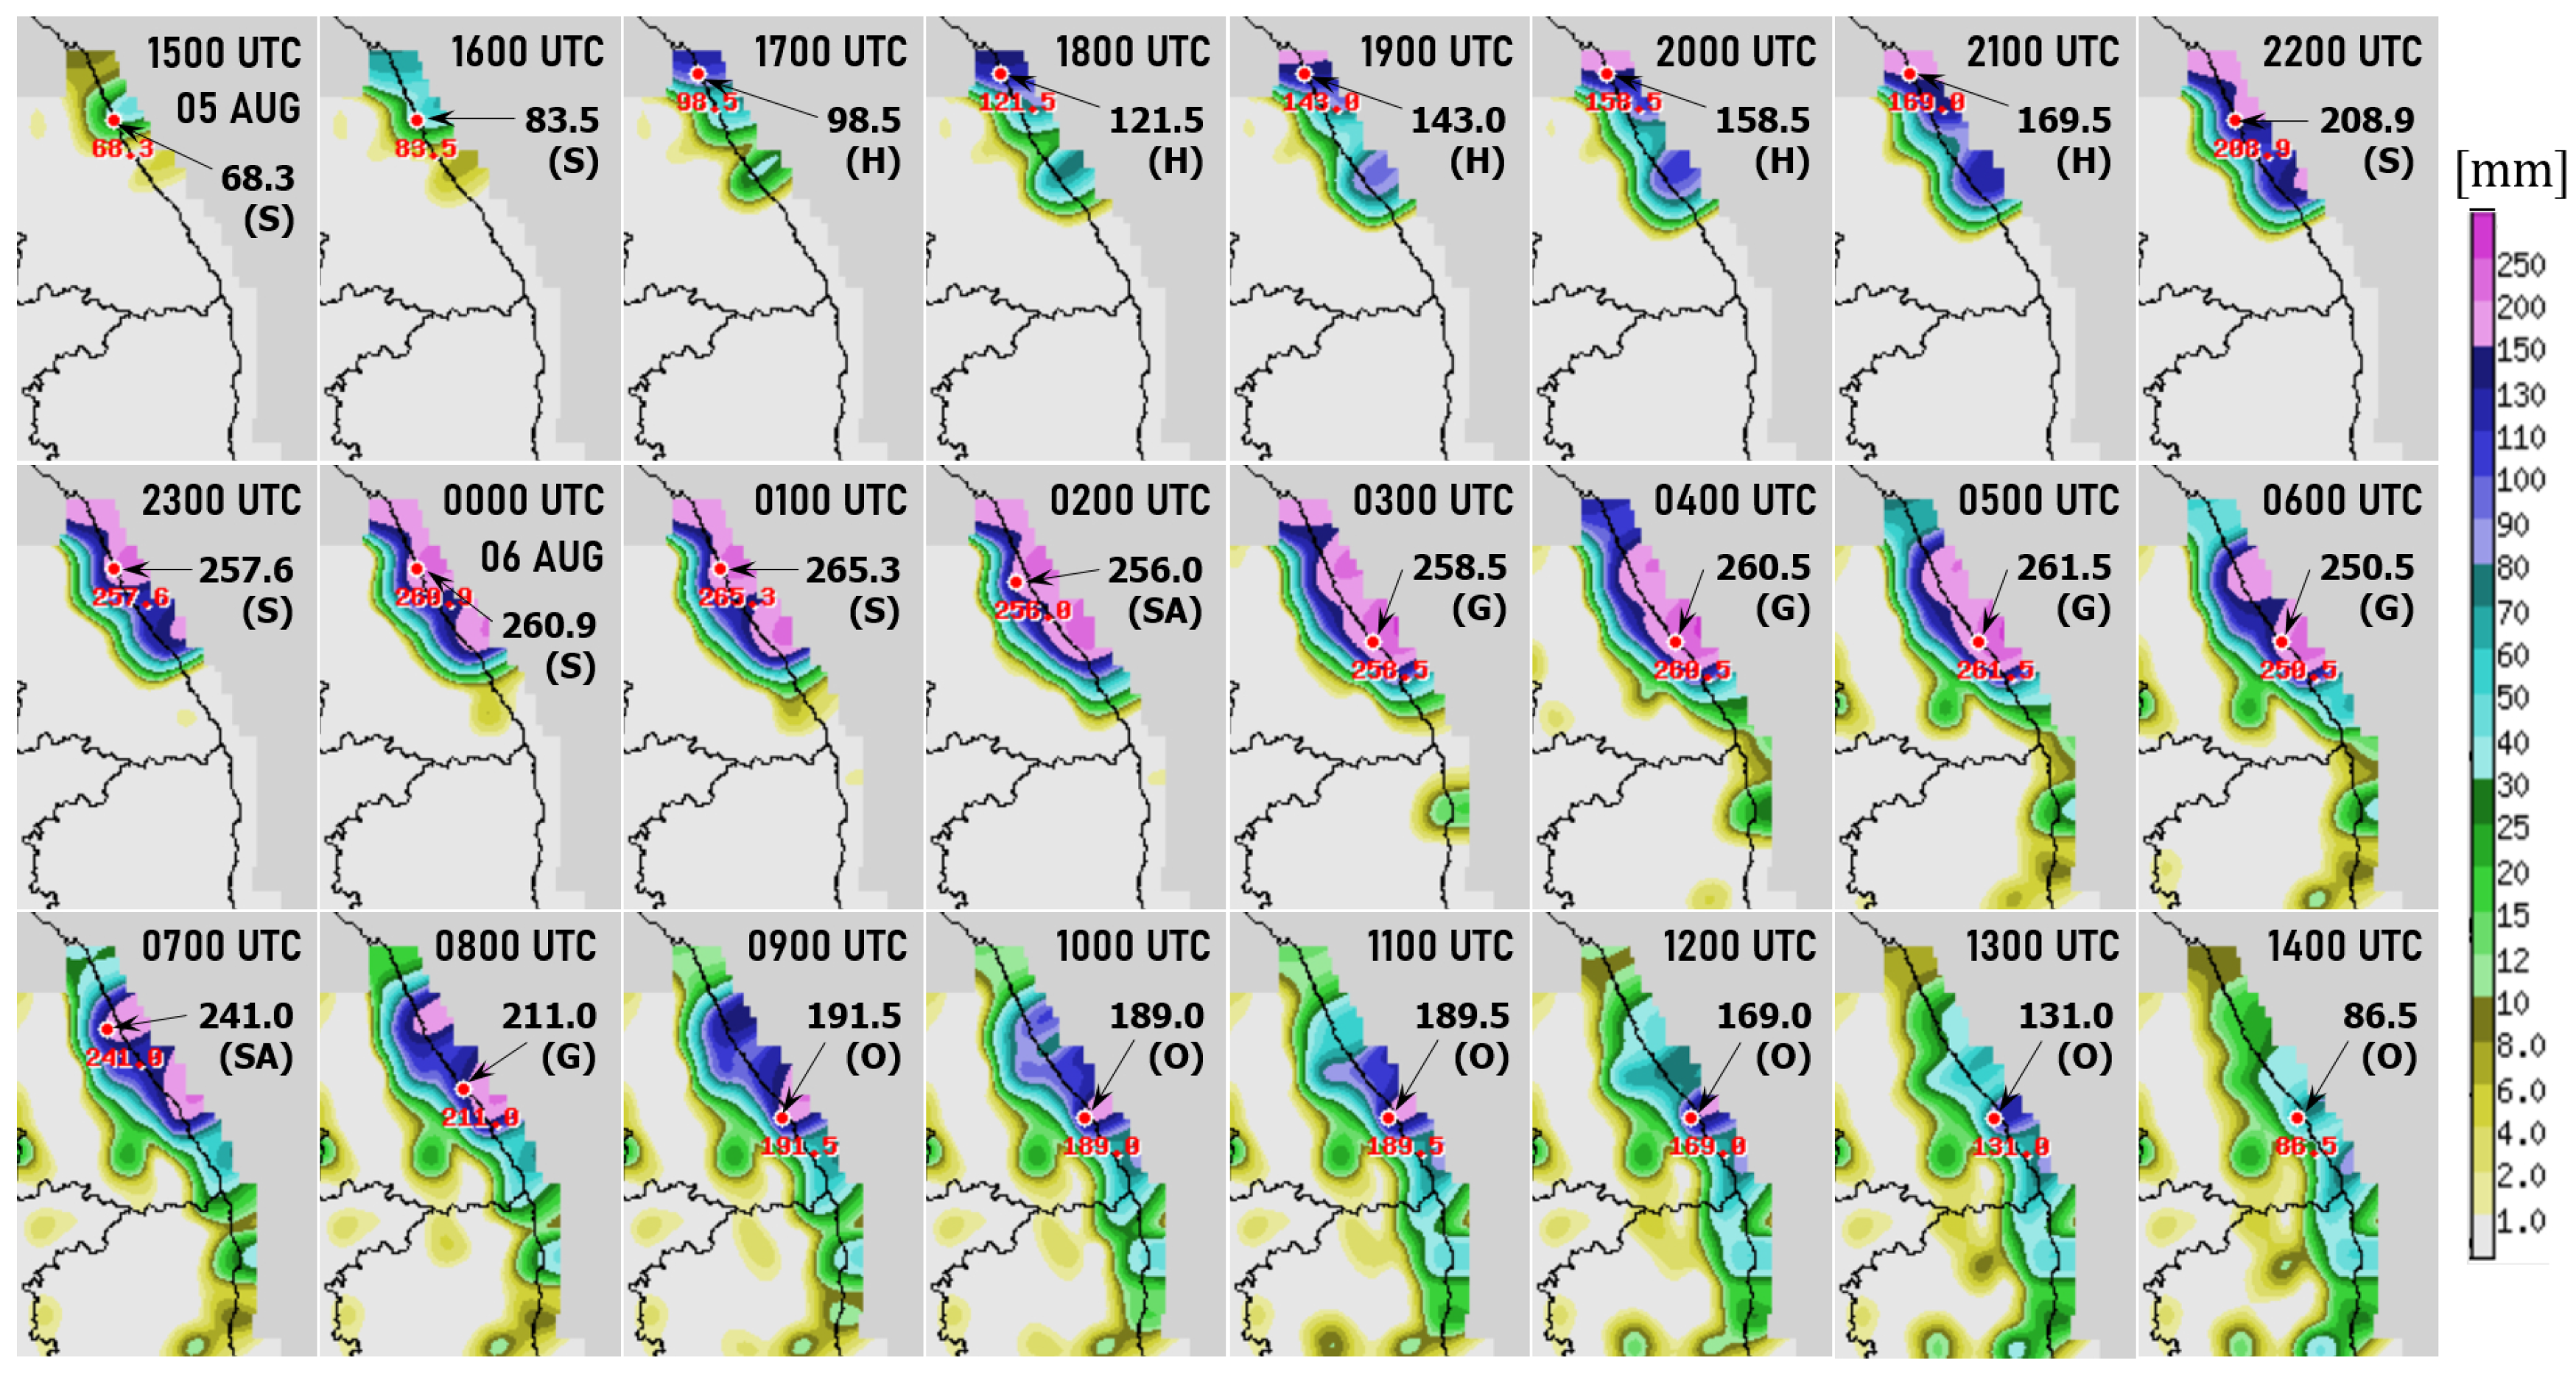
4.2.1. Characteristics of Meteorological Elements and Rainfalls
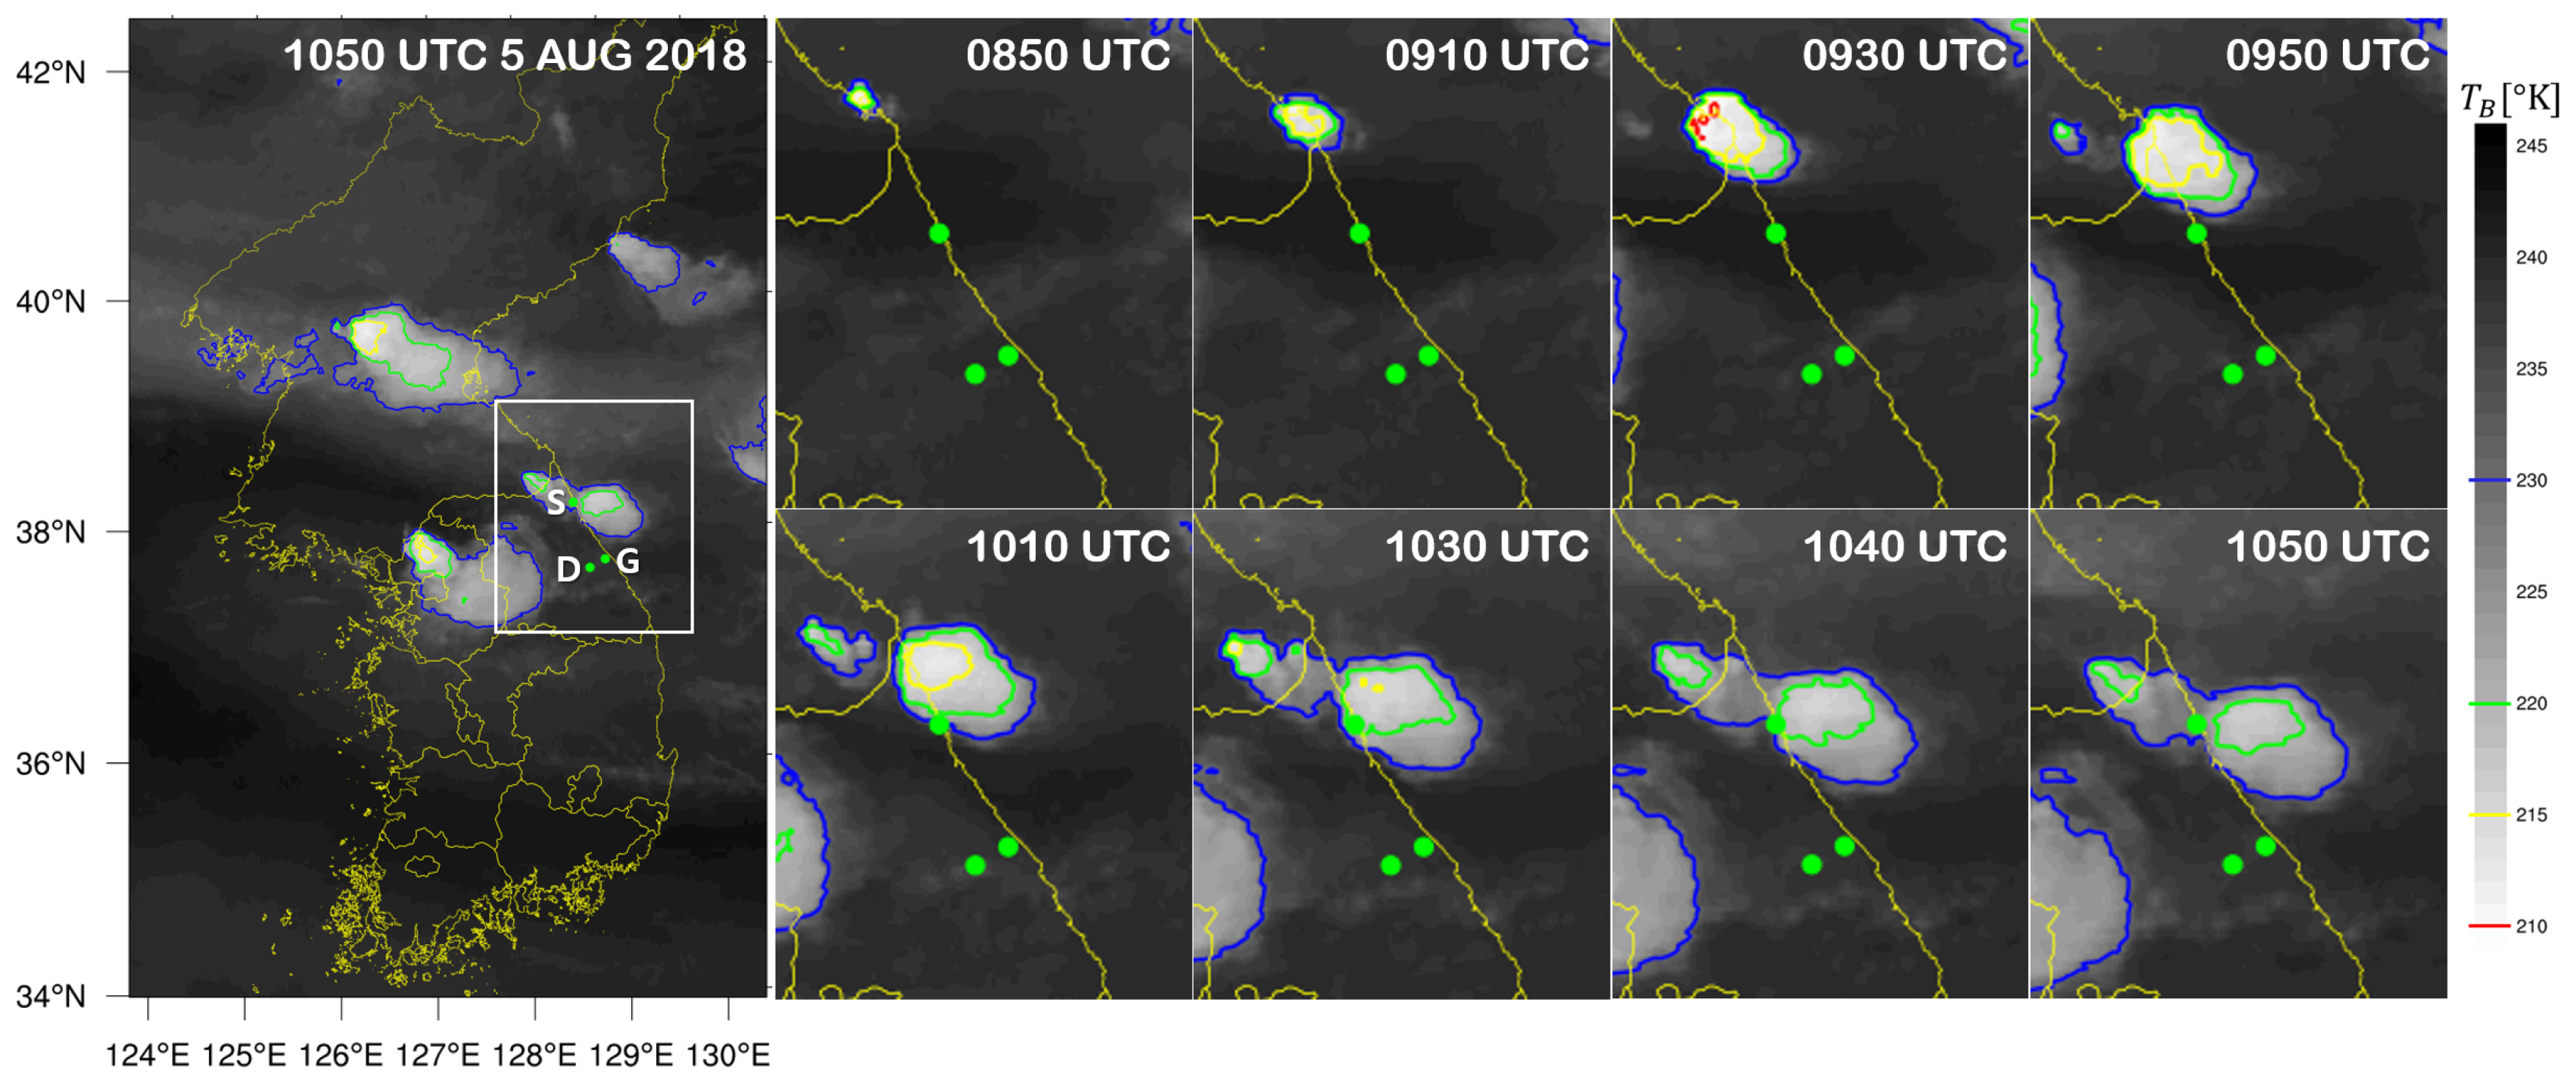
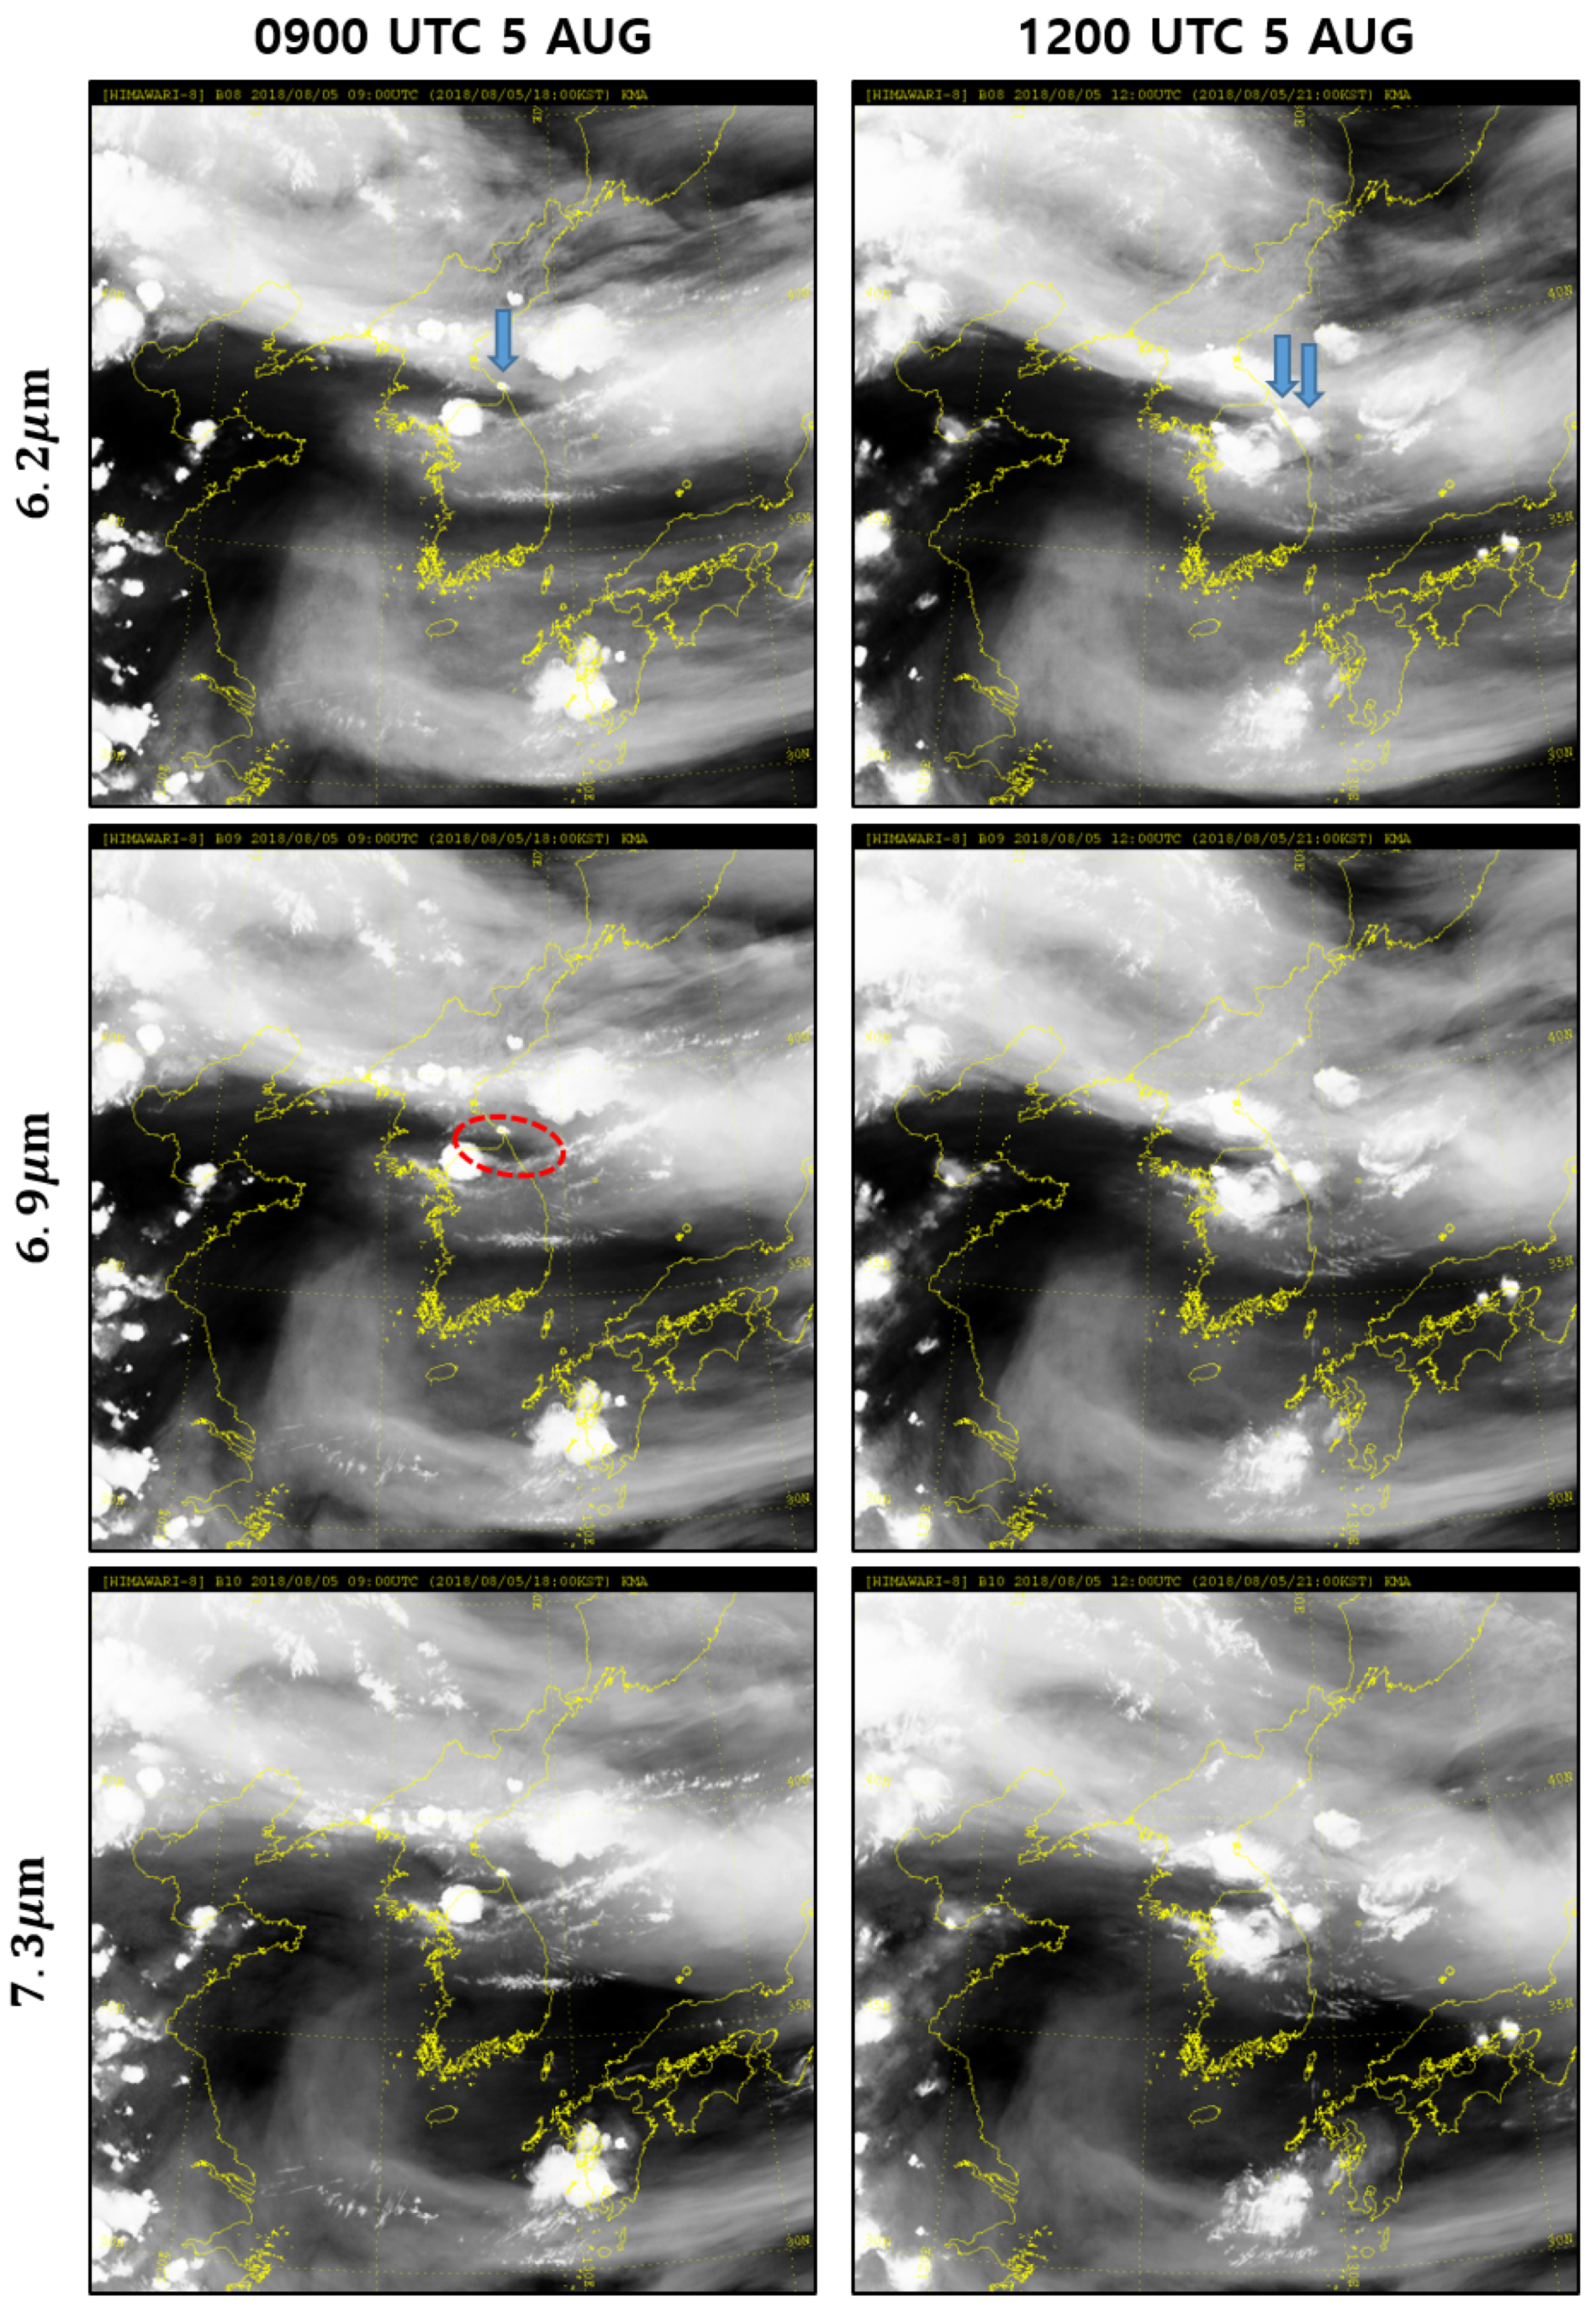
4.2.2. Tapering Cloud and Quasi-Stationarity
4.3. Processes in the Modeled Convective System
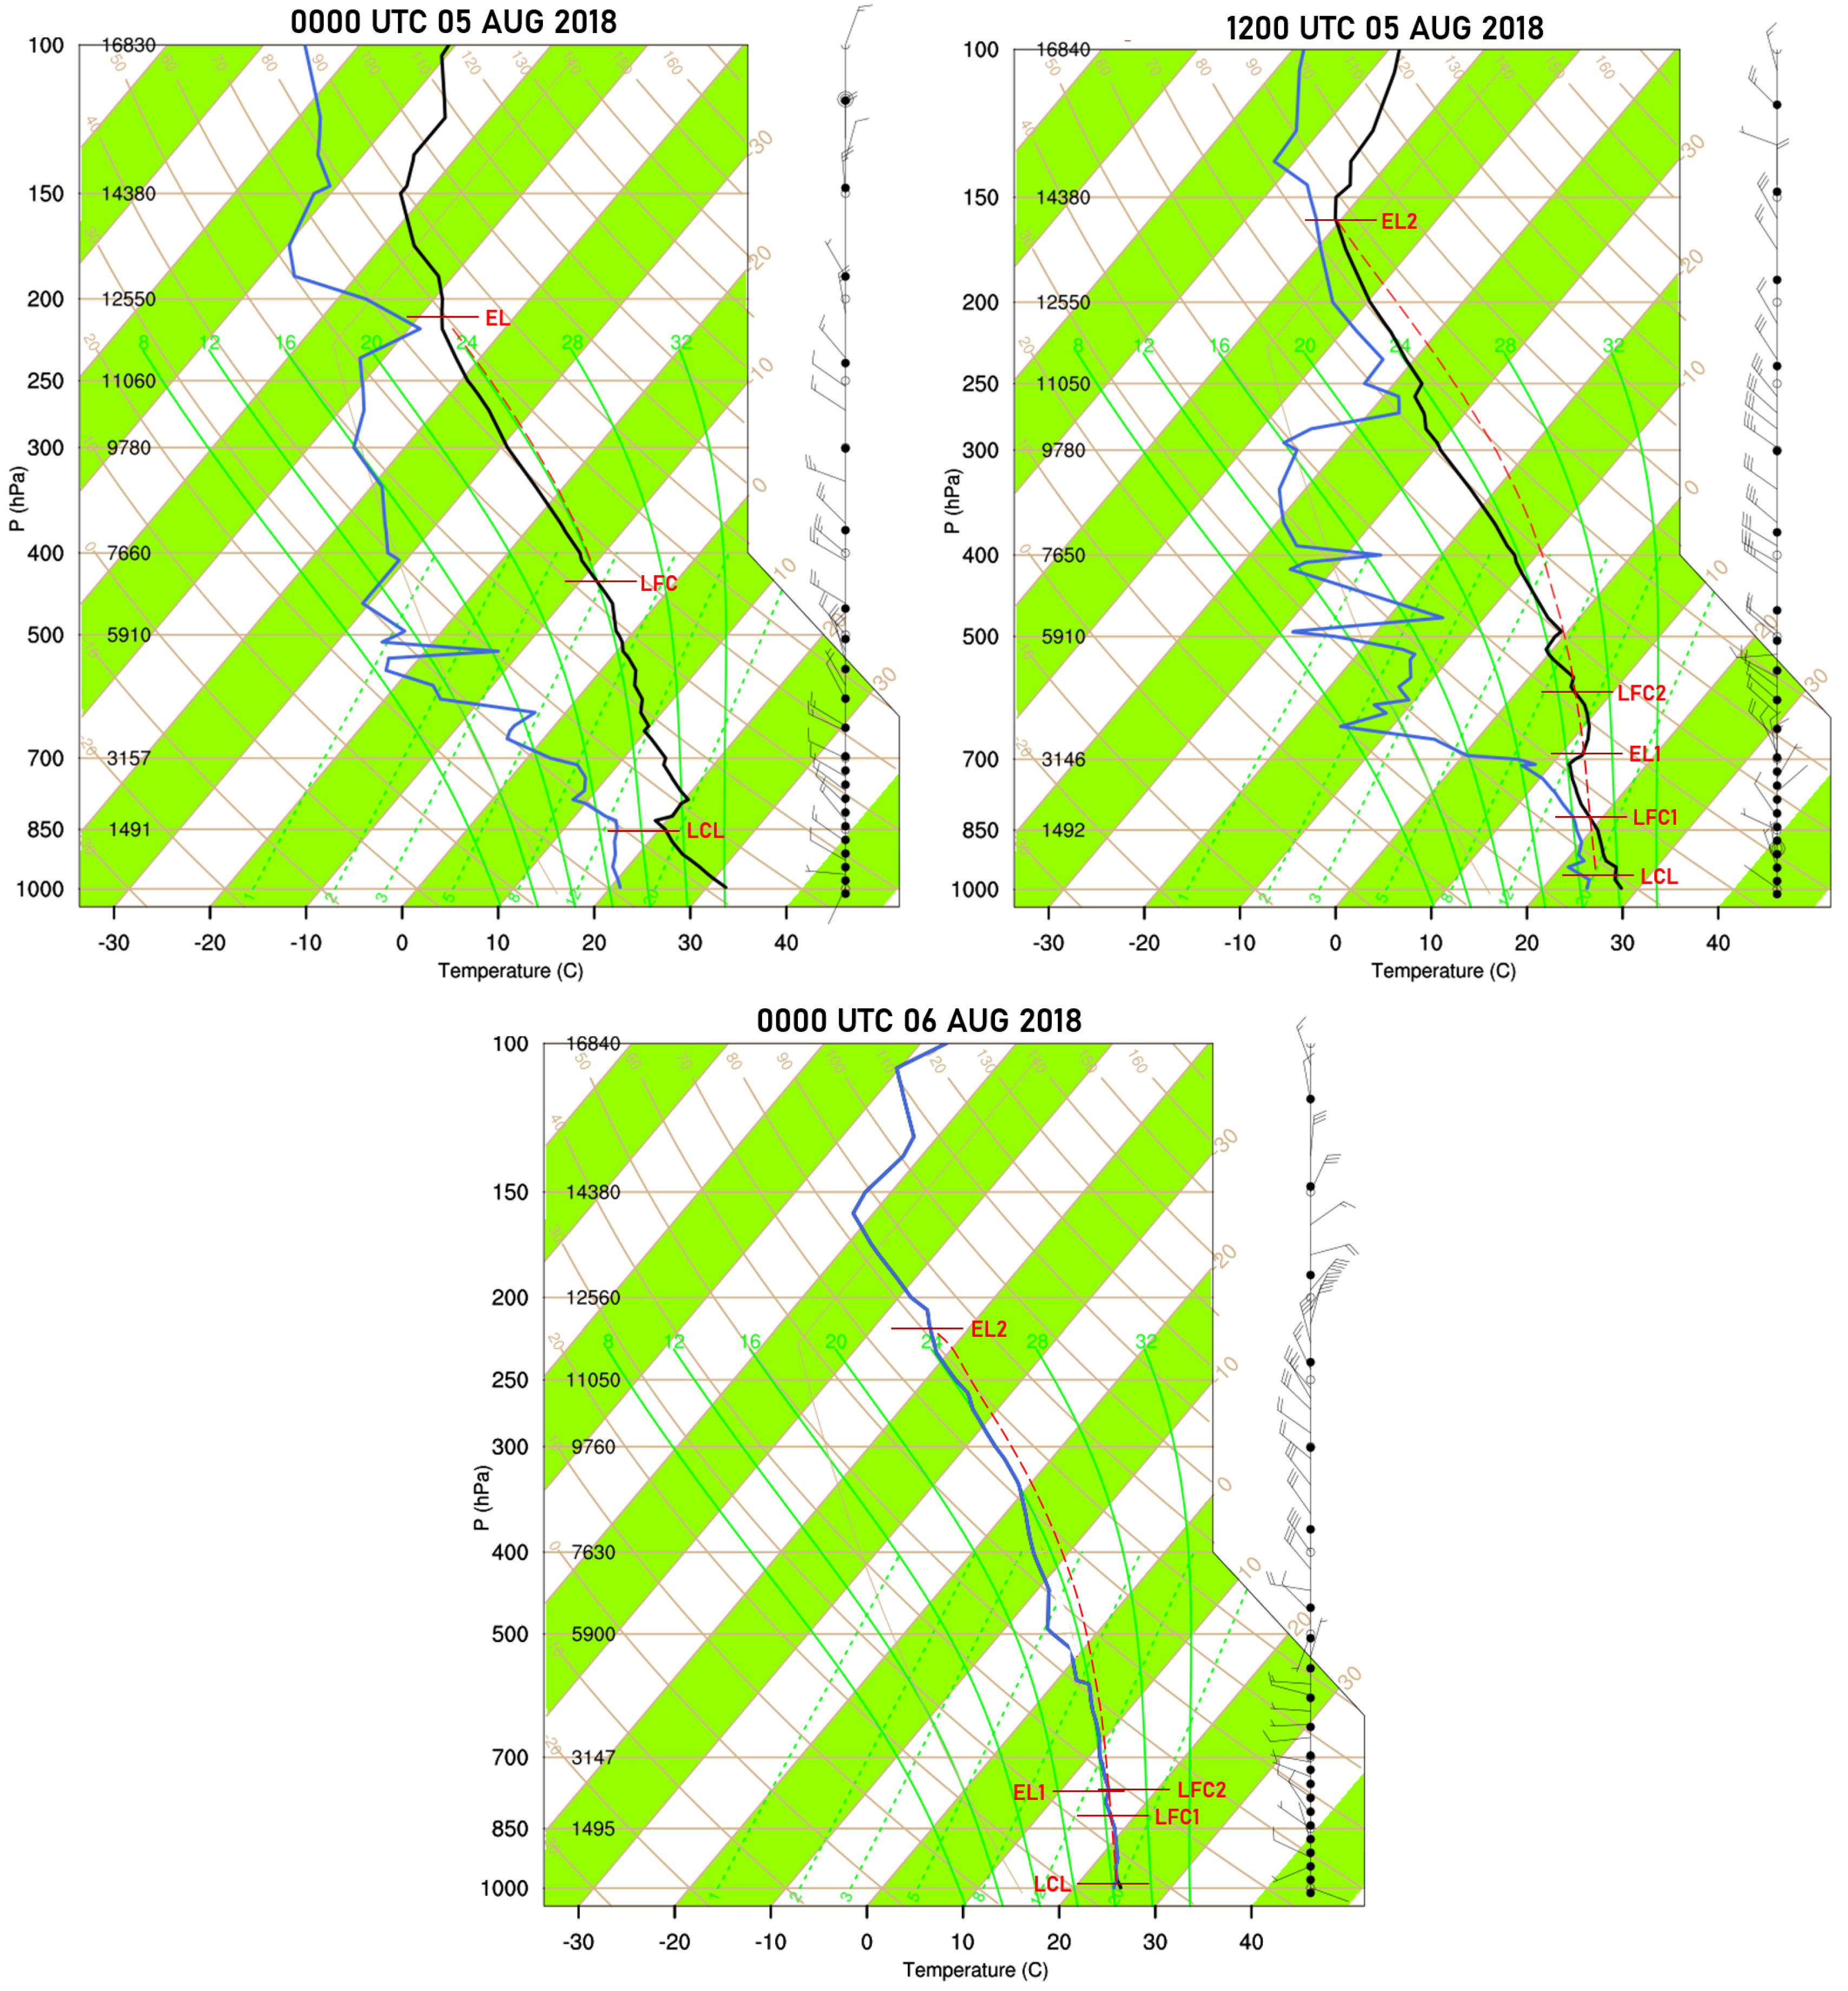
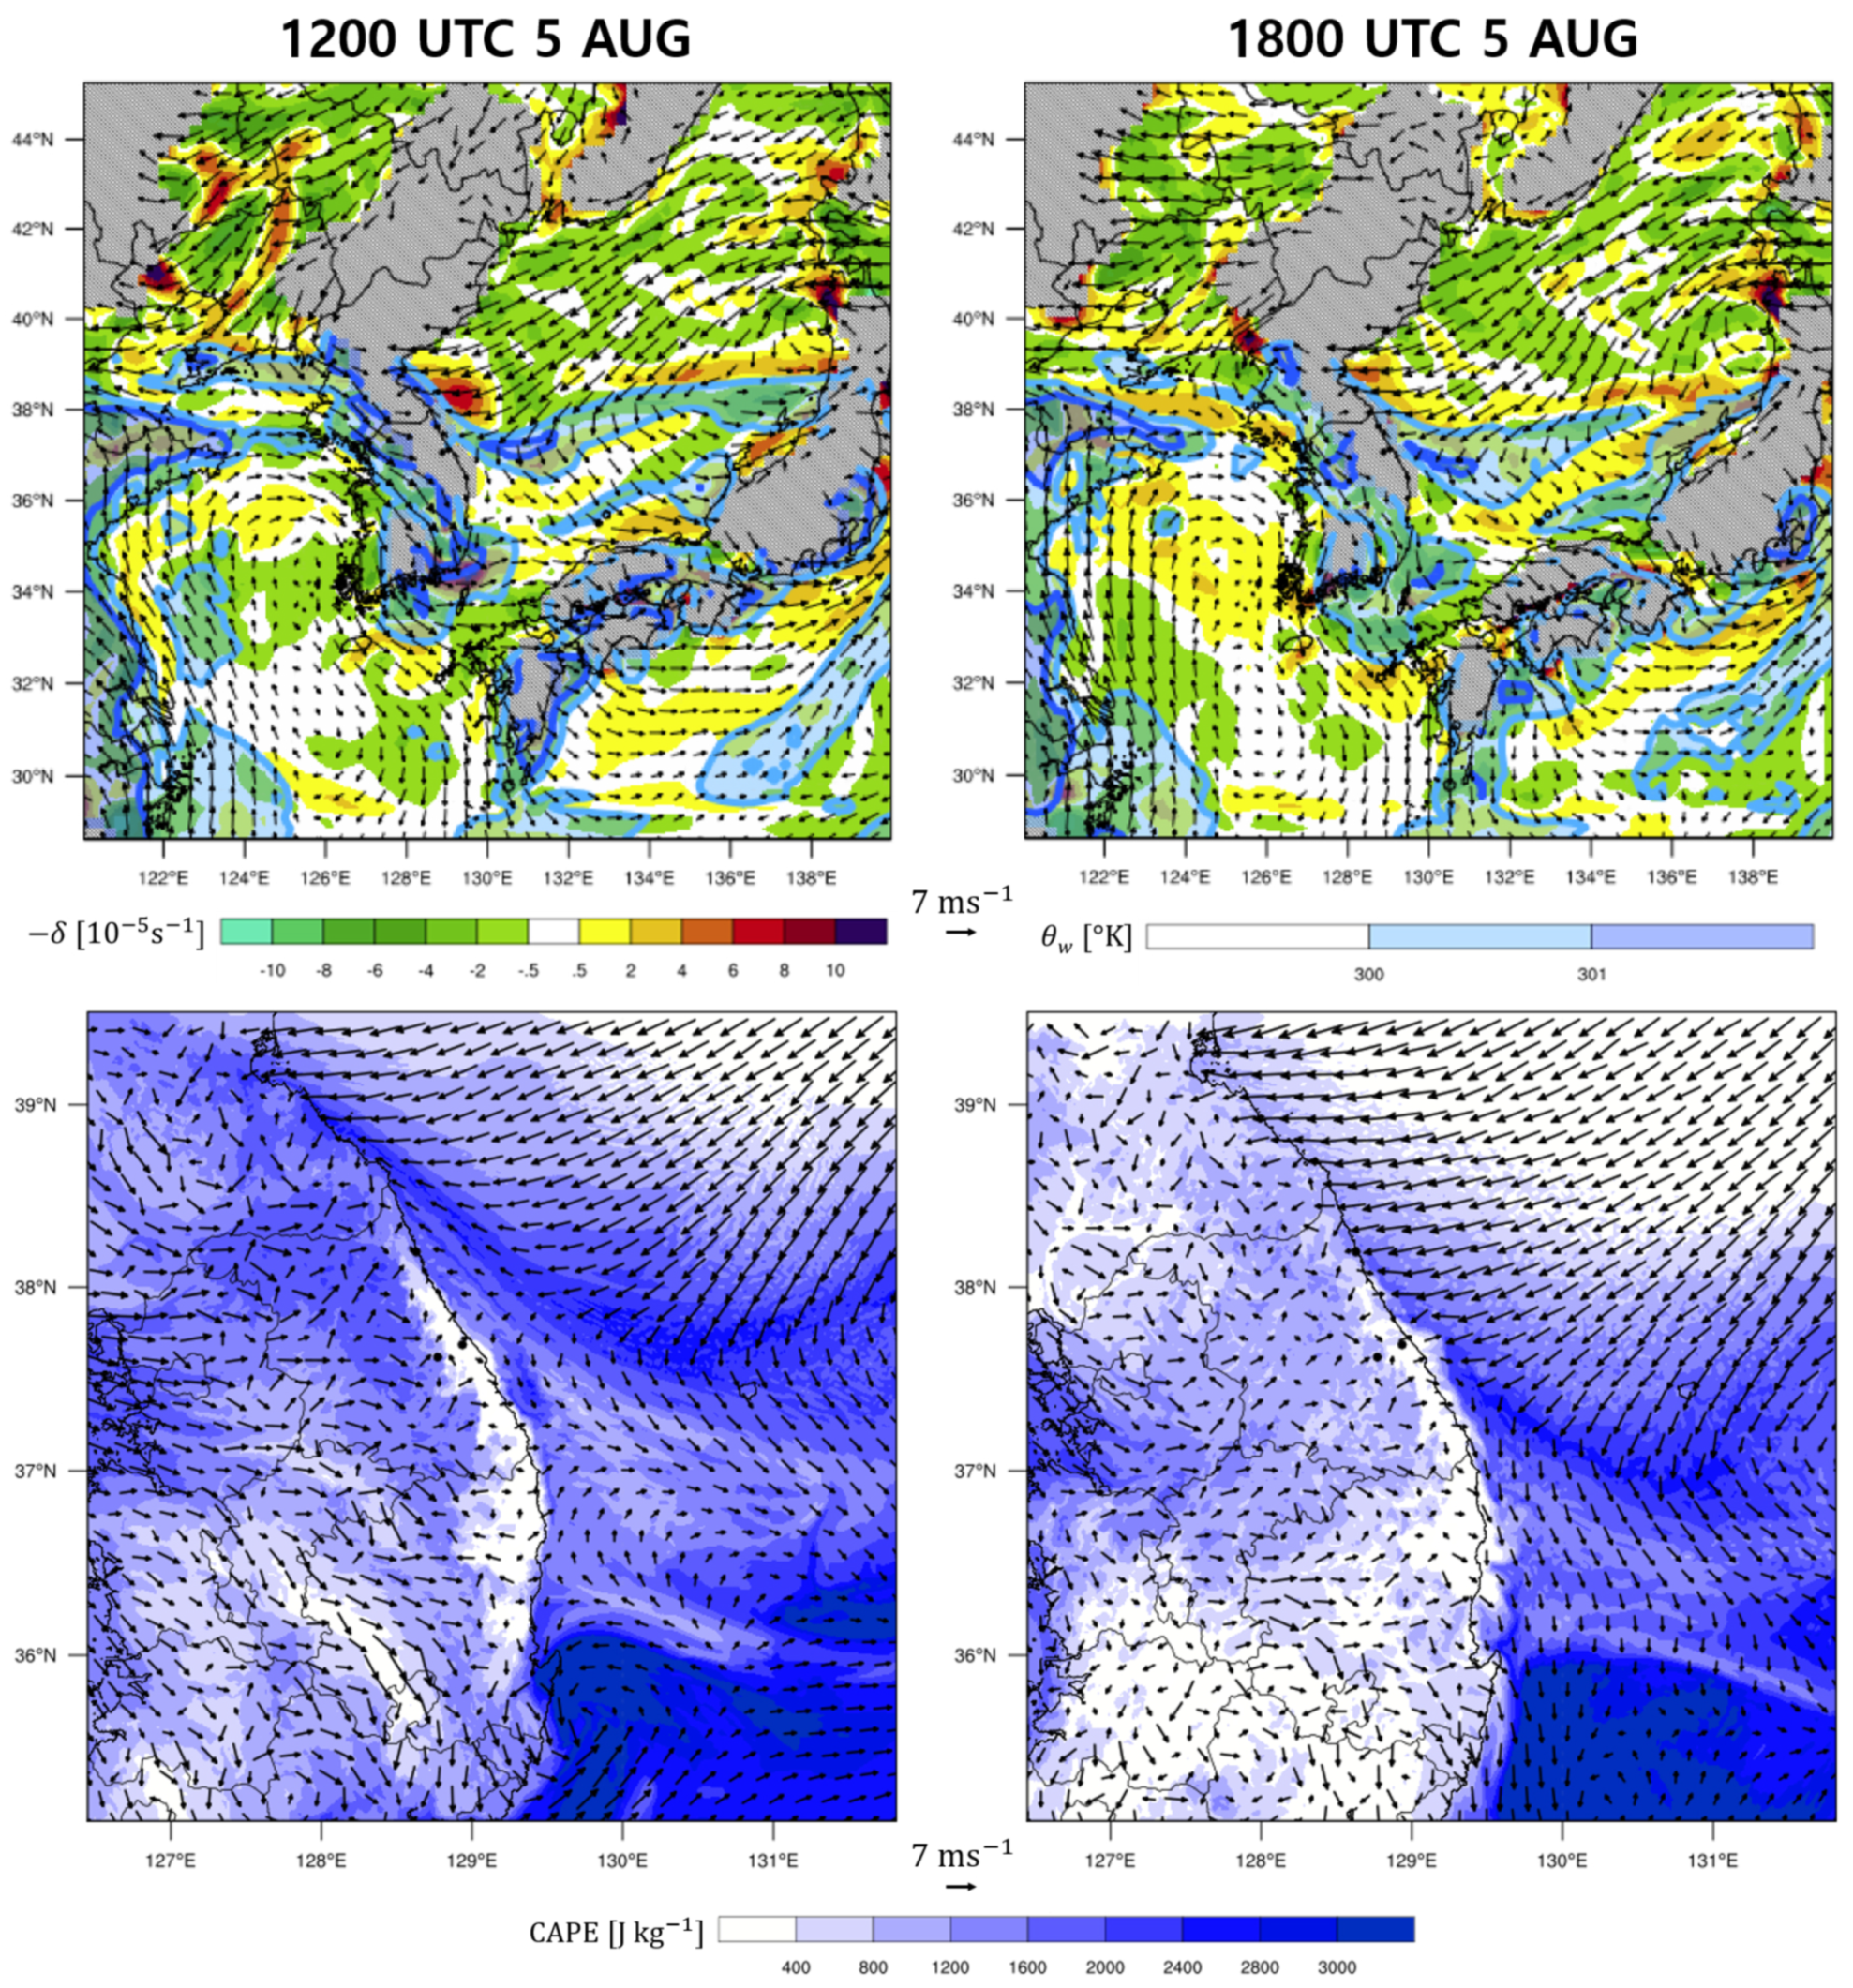
4.3.1. Moisture Transport and Instability Indices
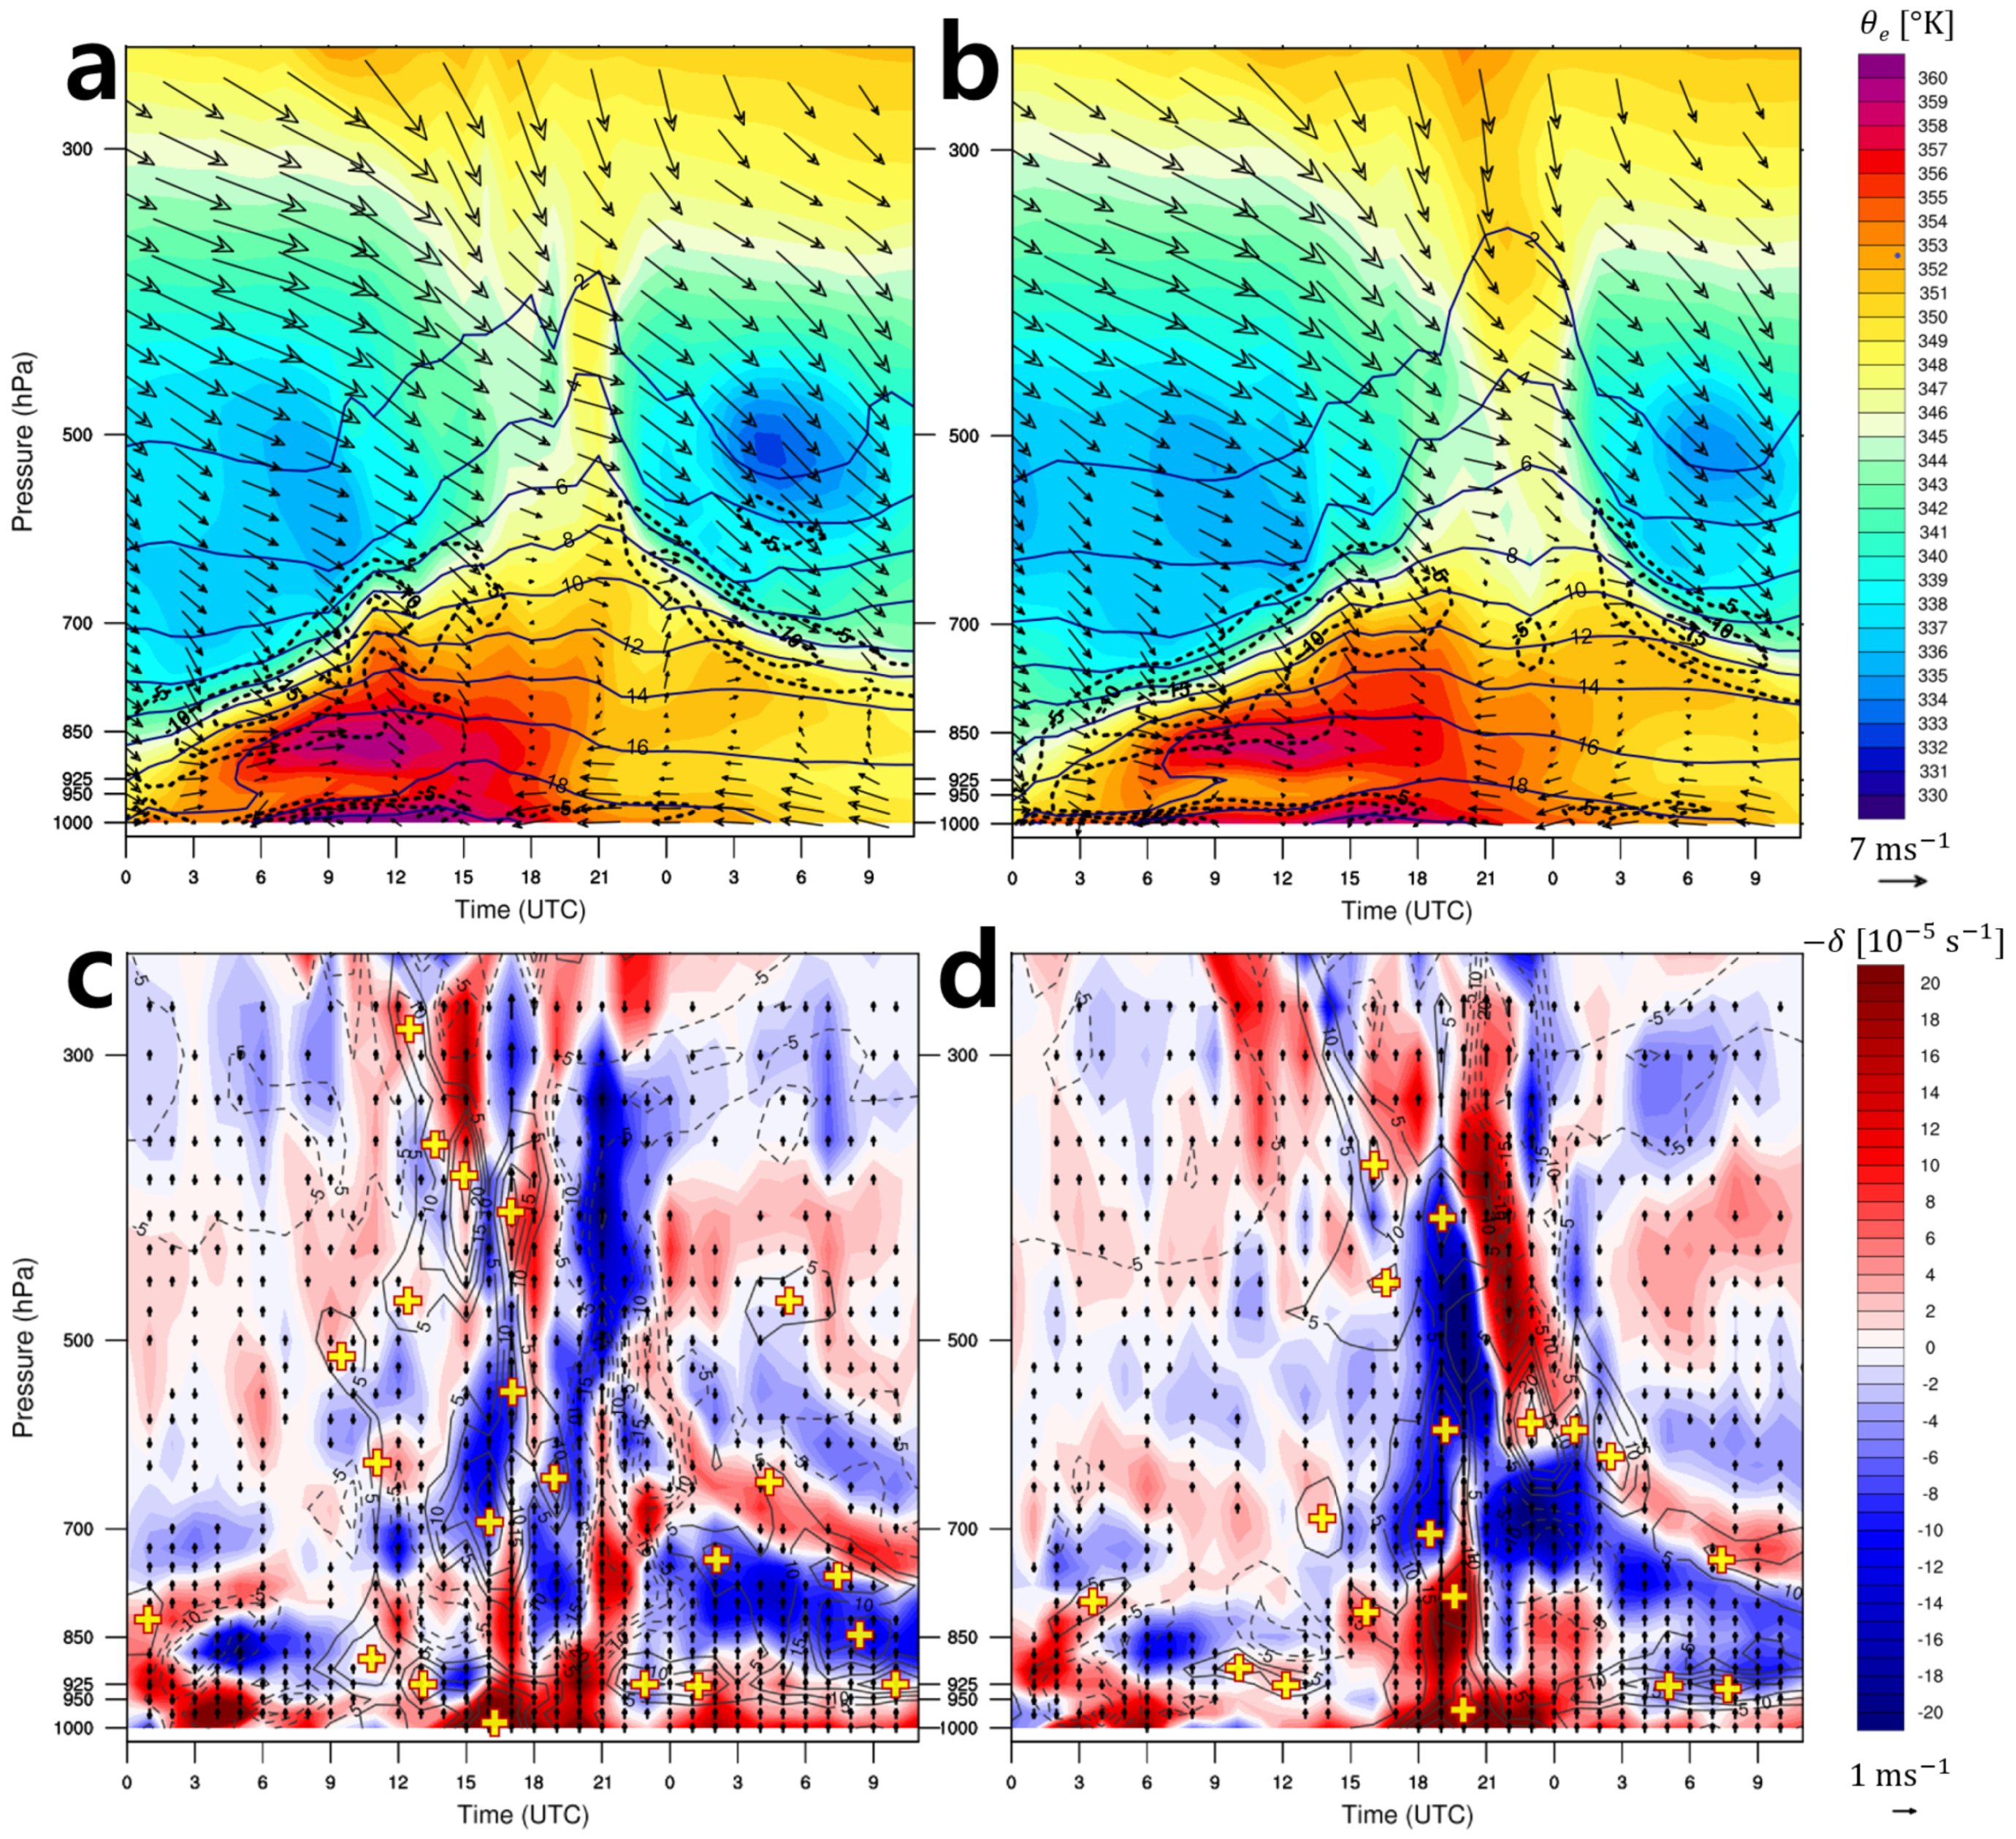
4.3.2. Domain-Averaged Characteristics of Storm Environment
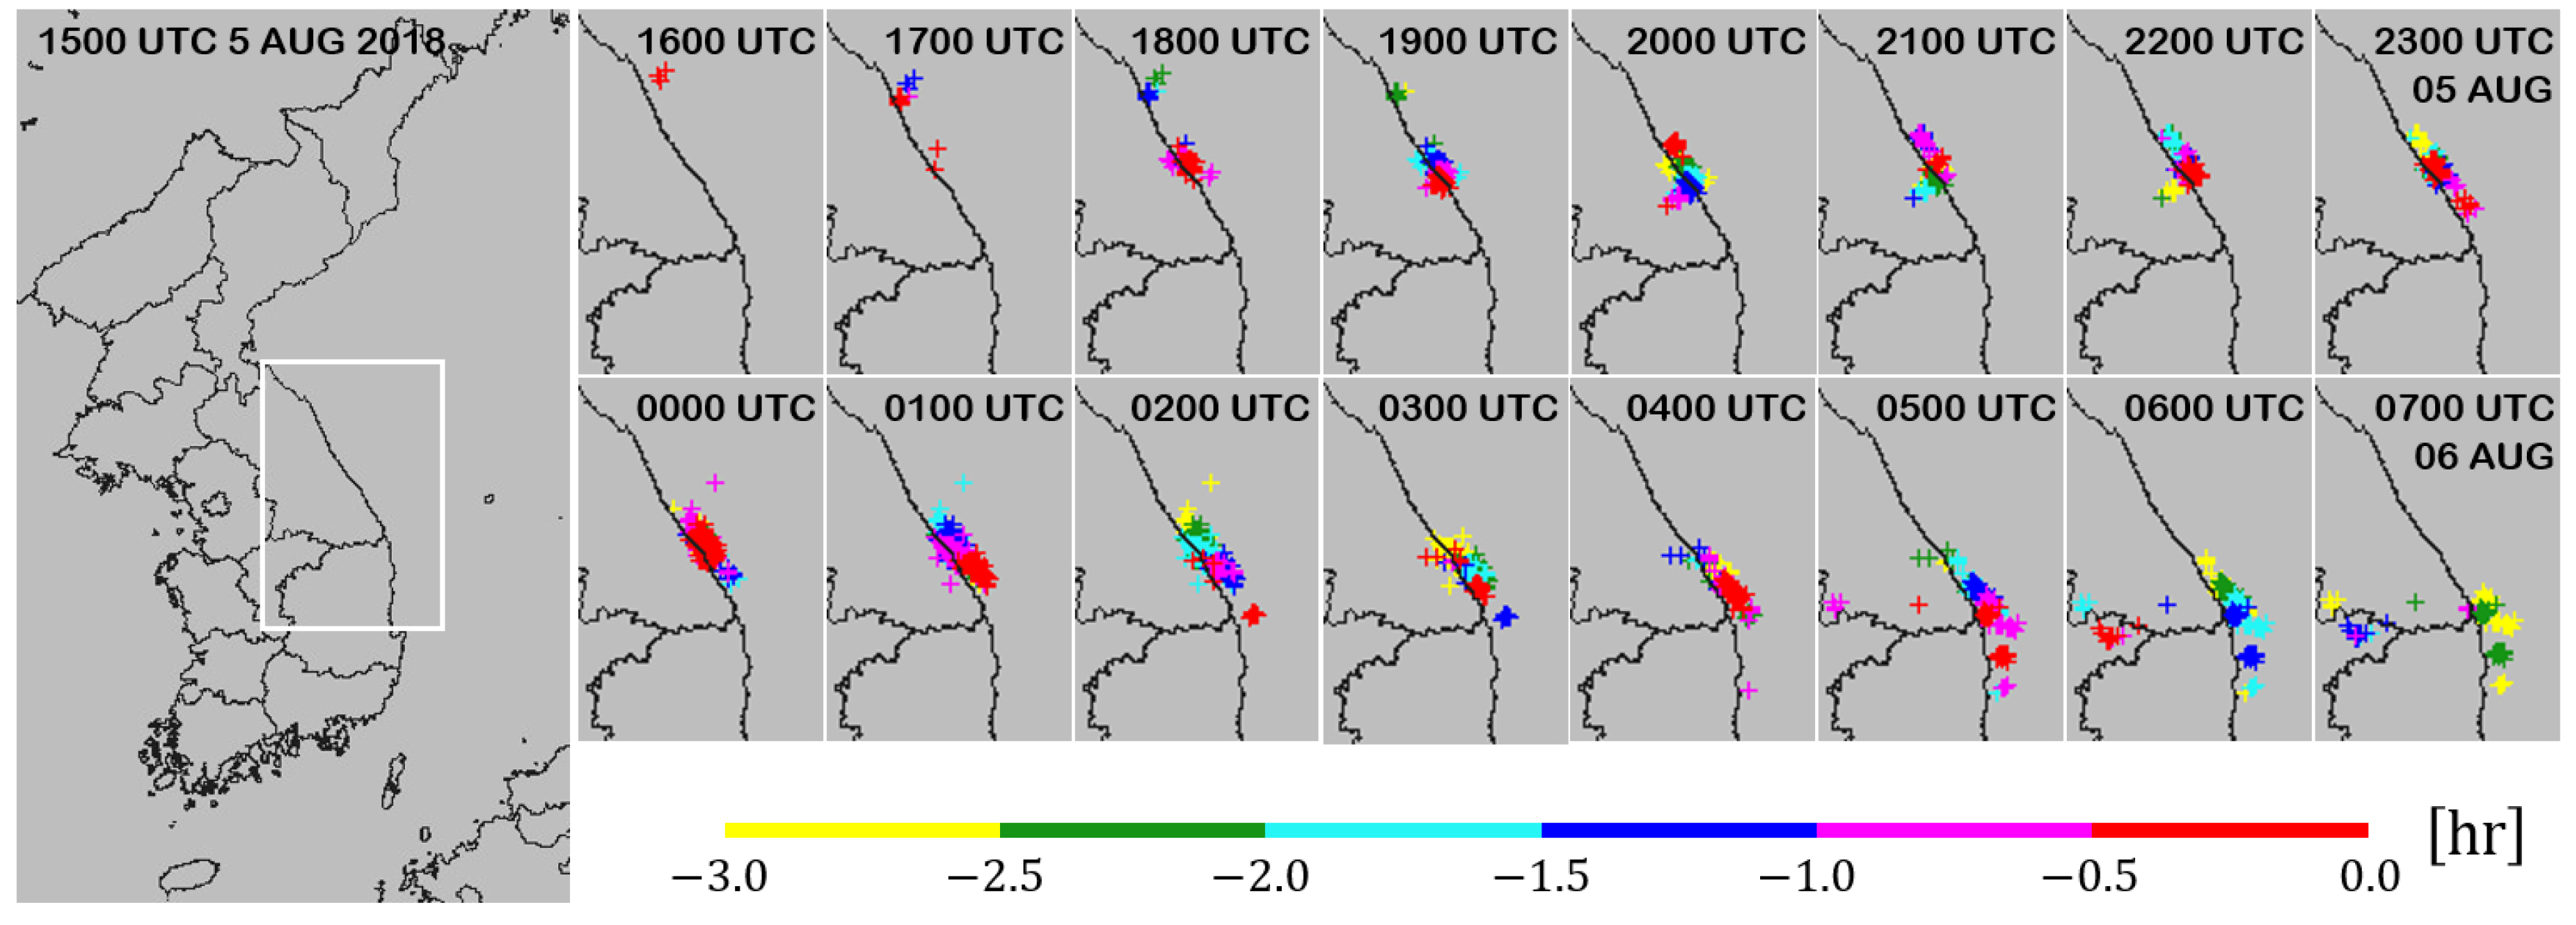
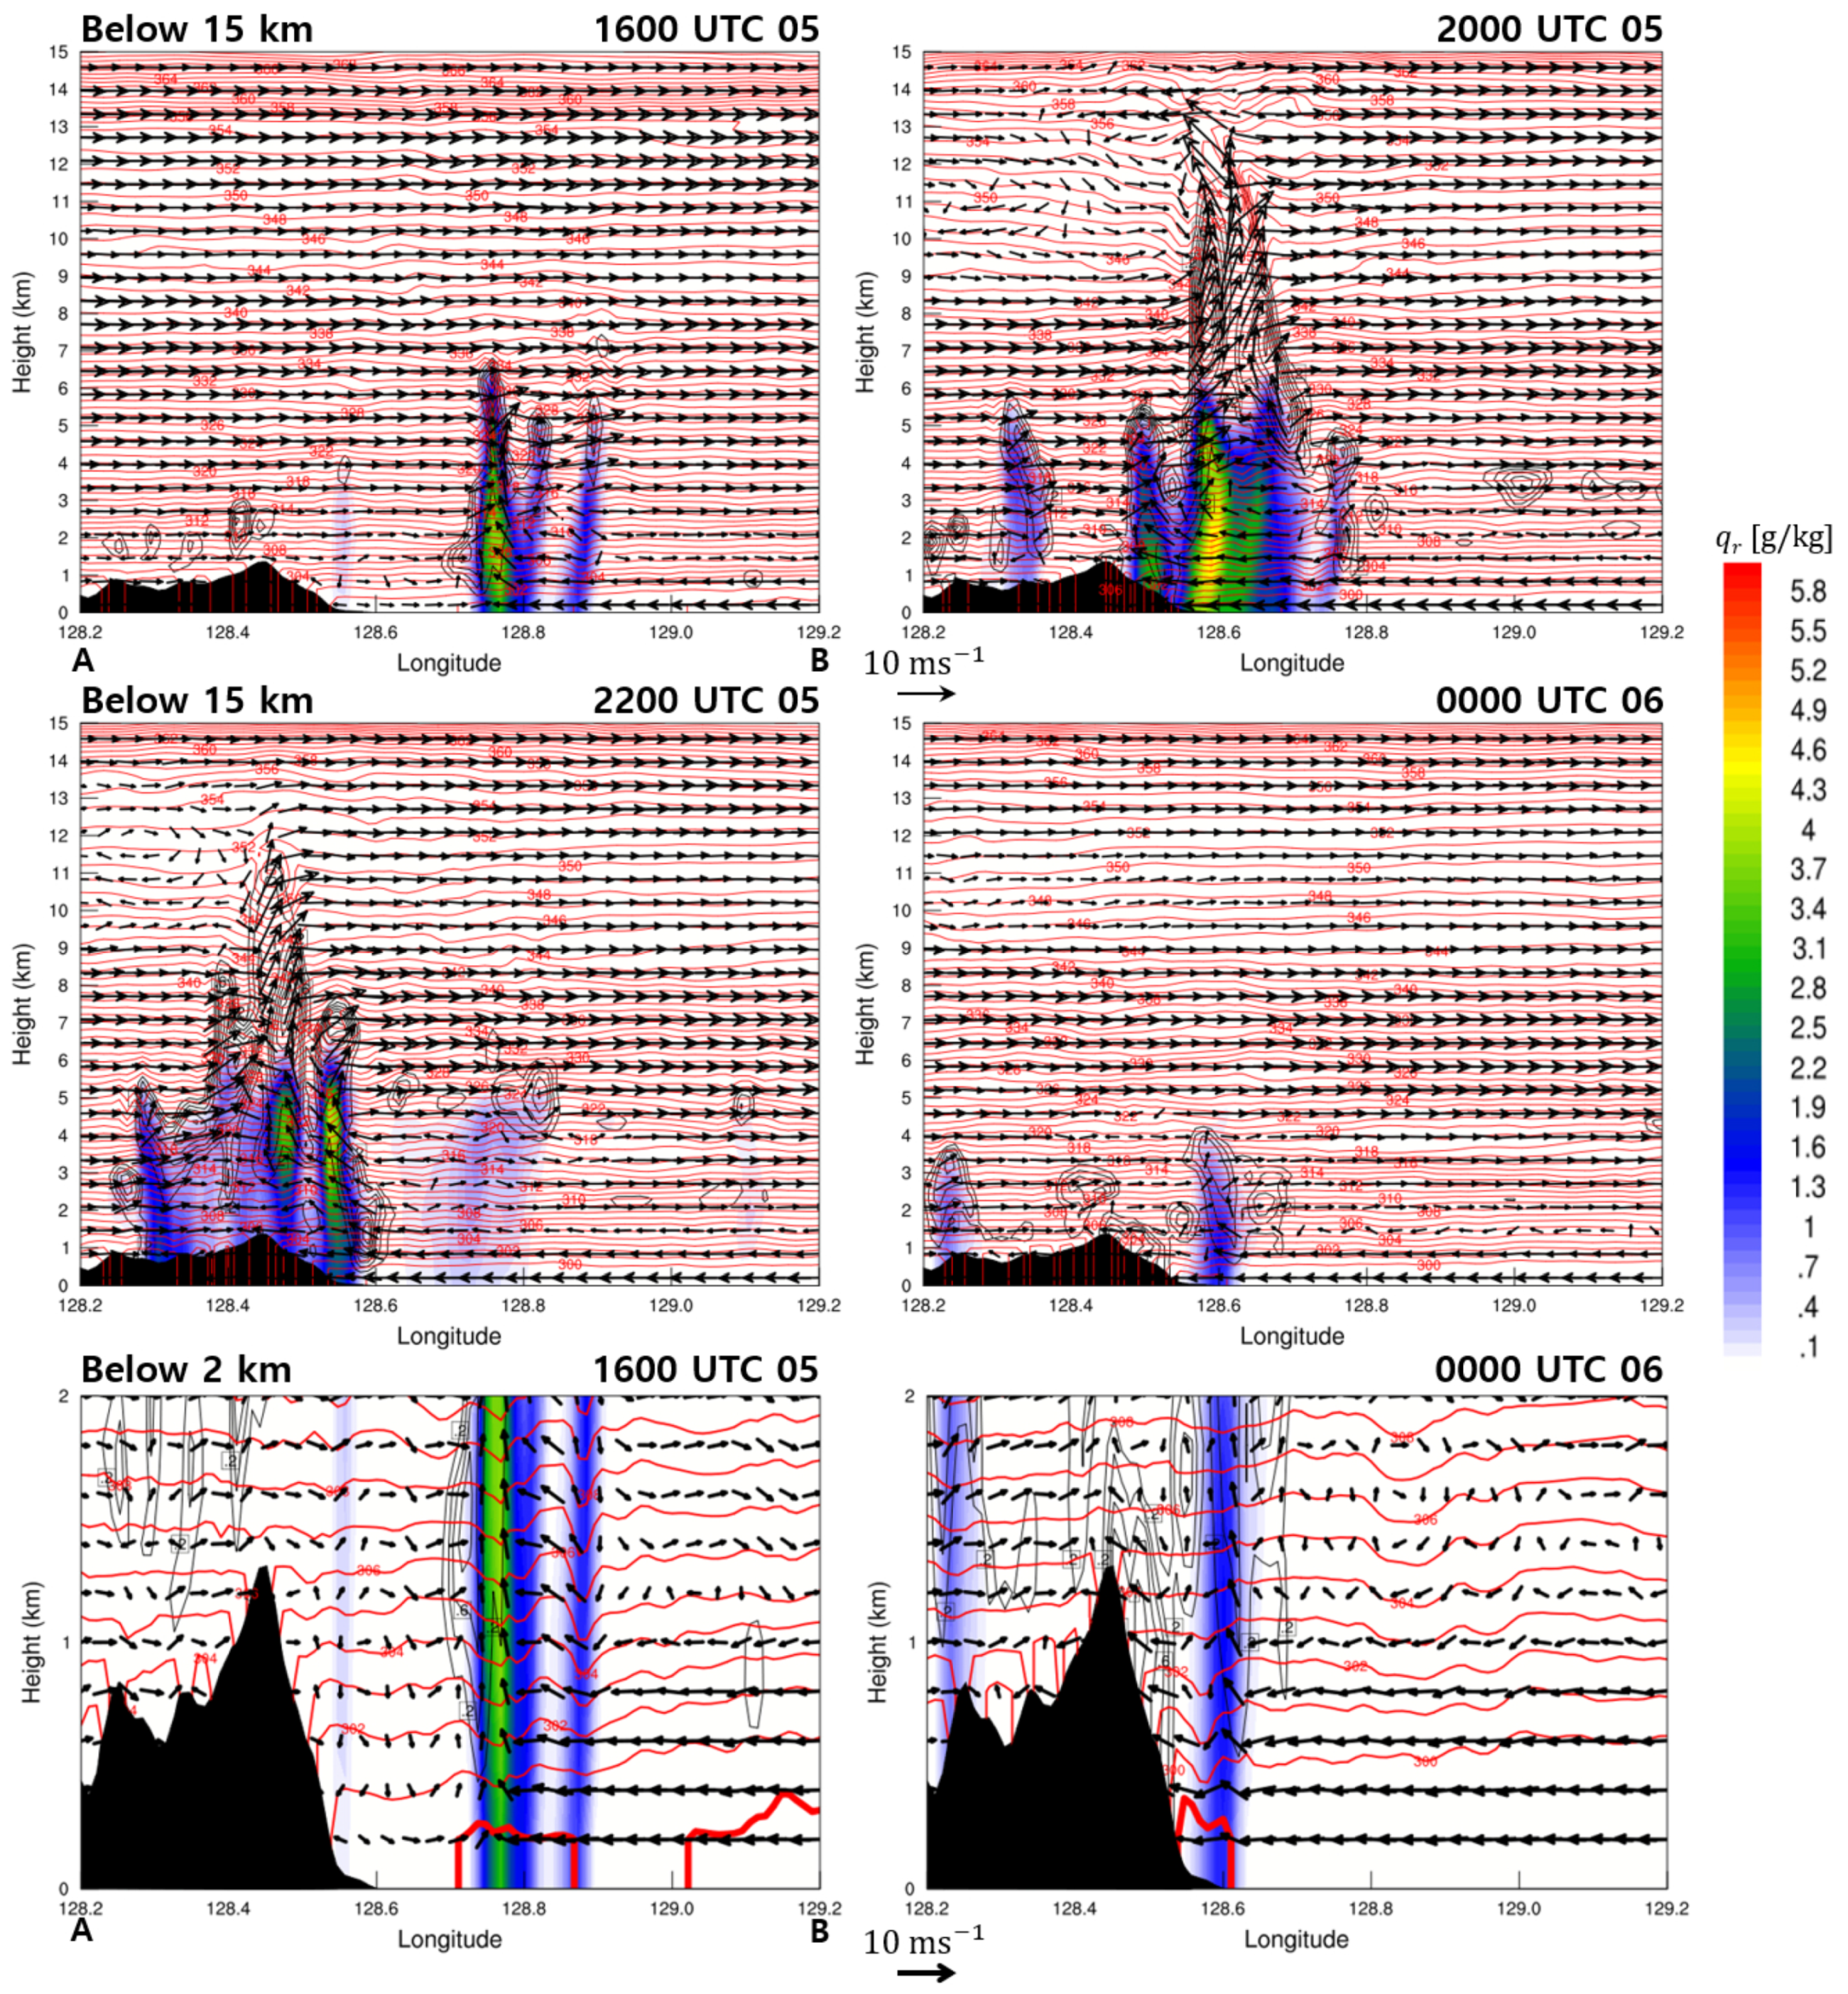
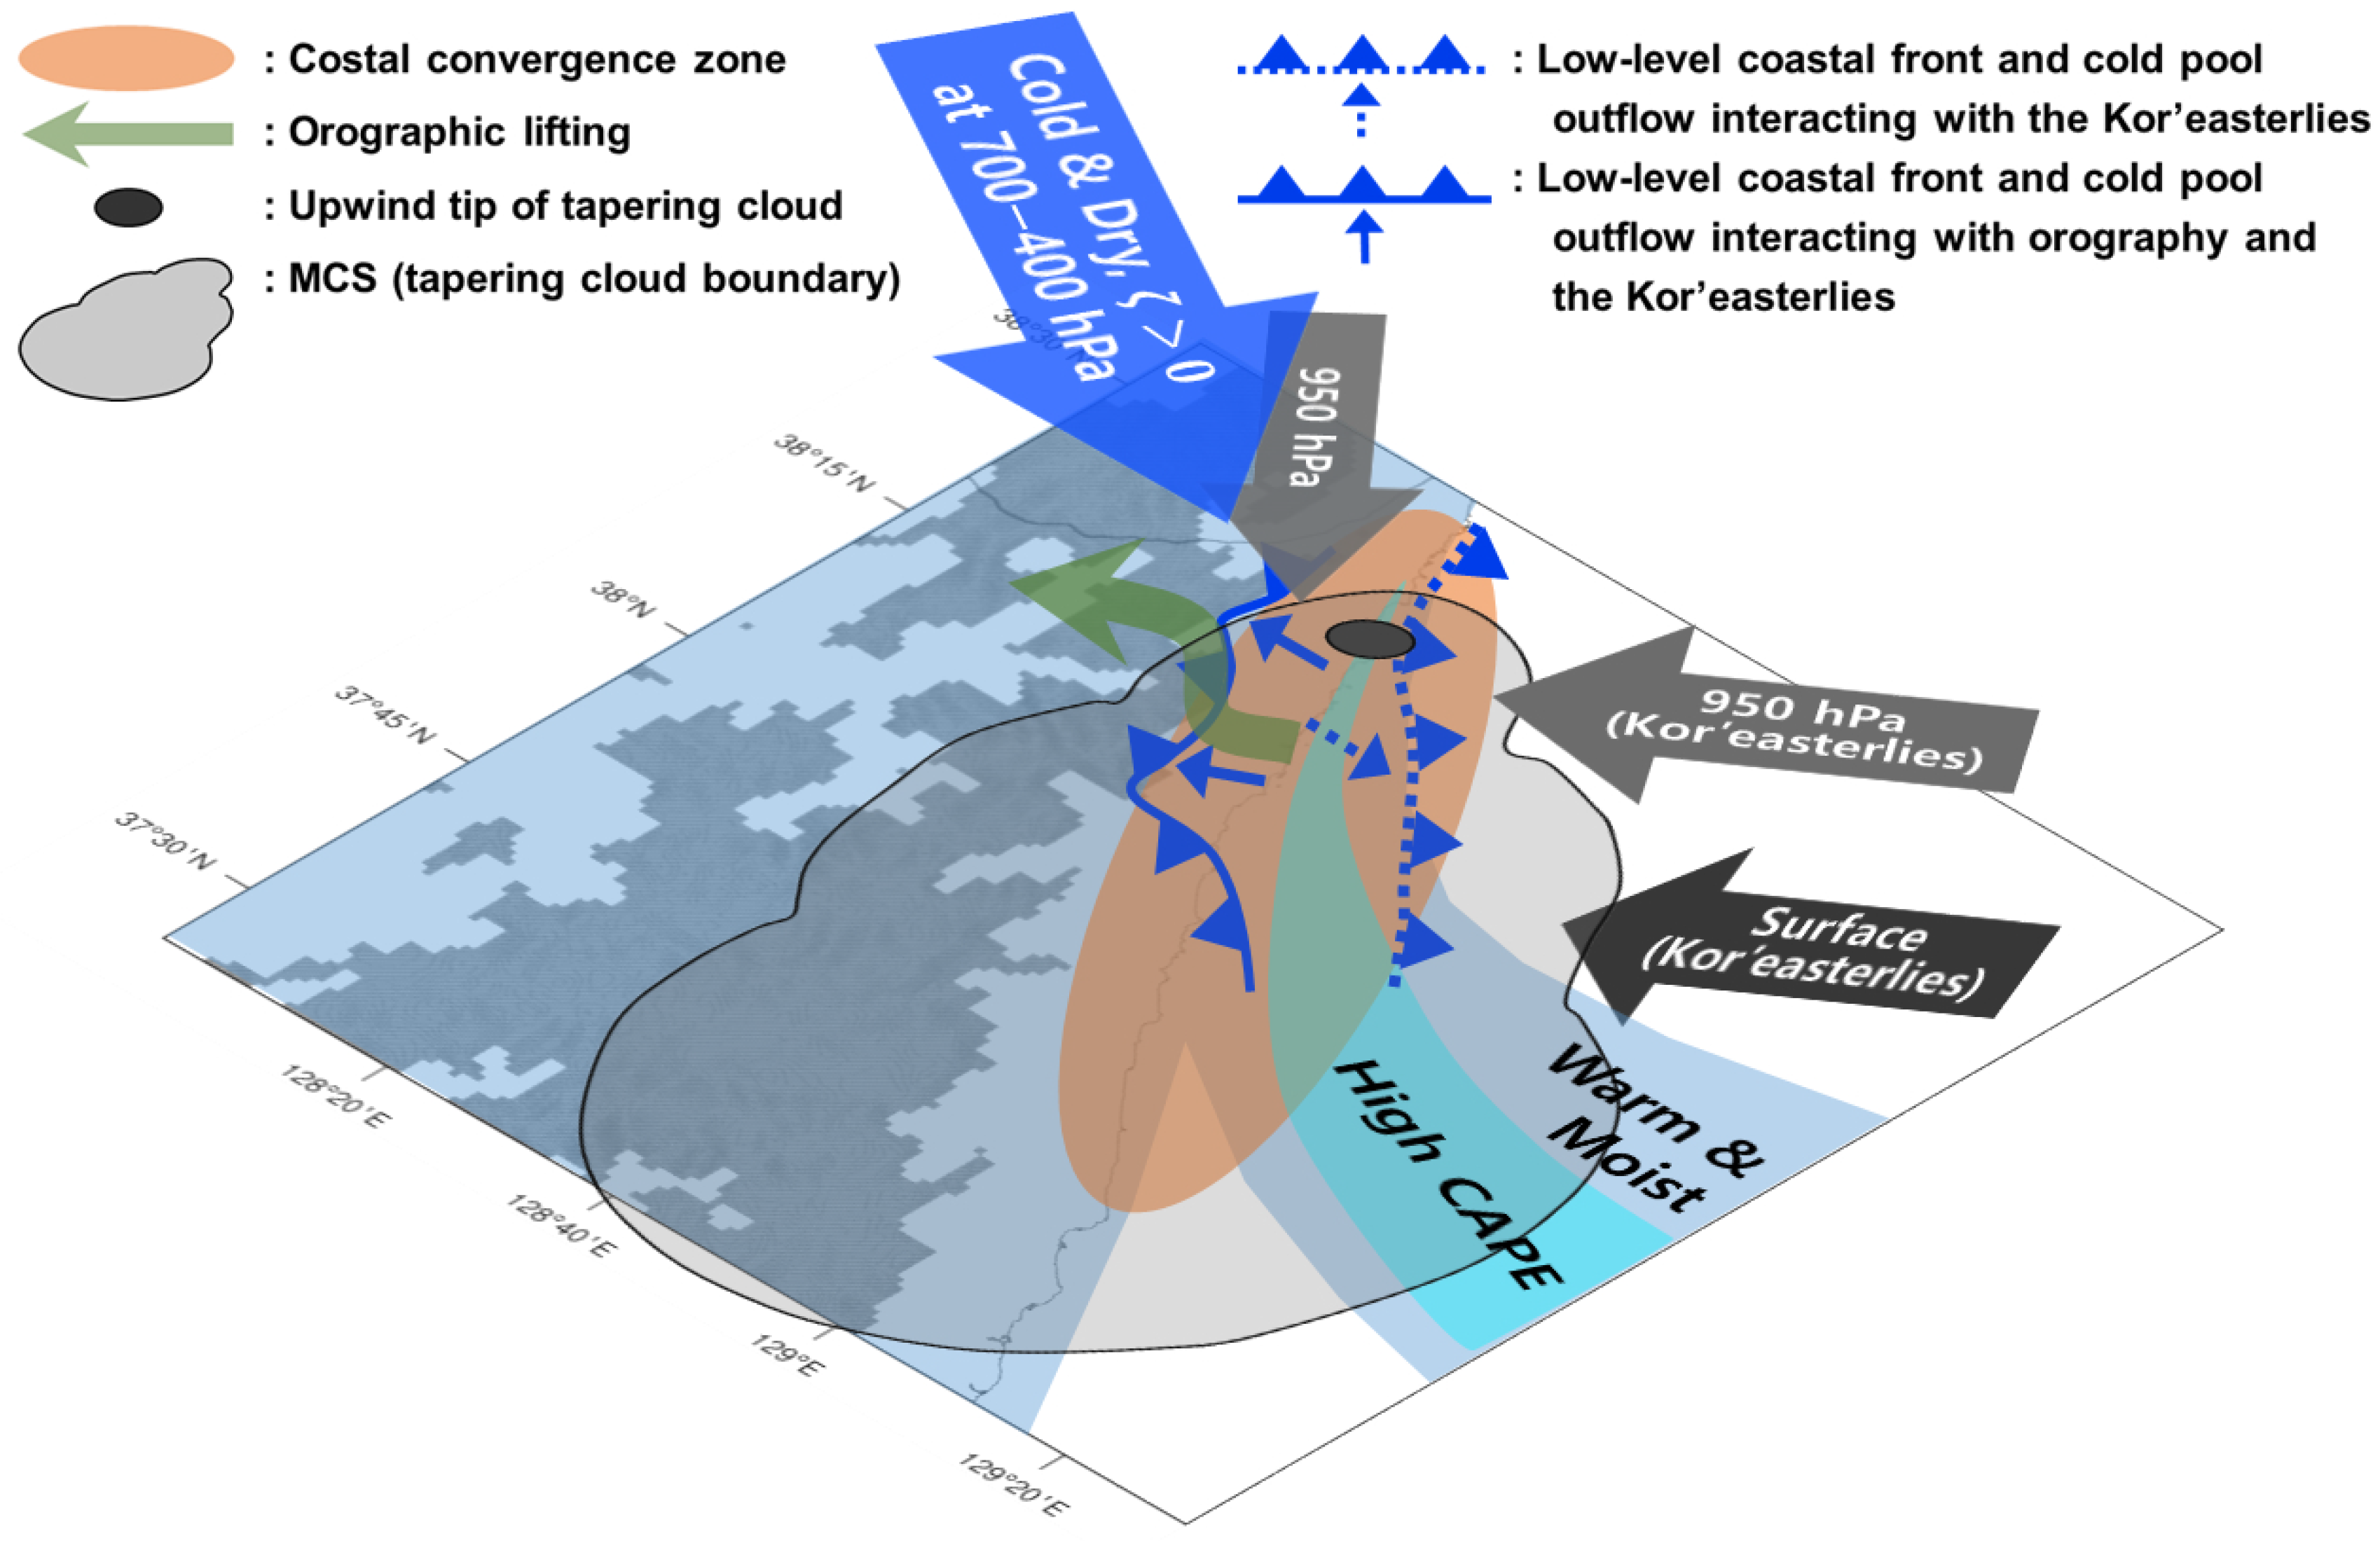
4.3.3. Triggering and Back-Building Processes
4.3.4. Decaying Process
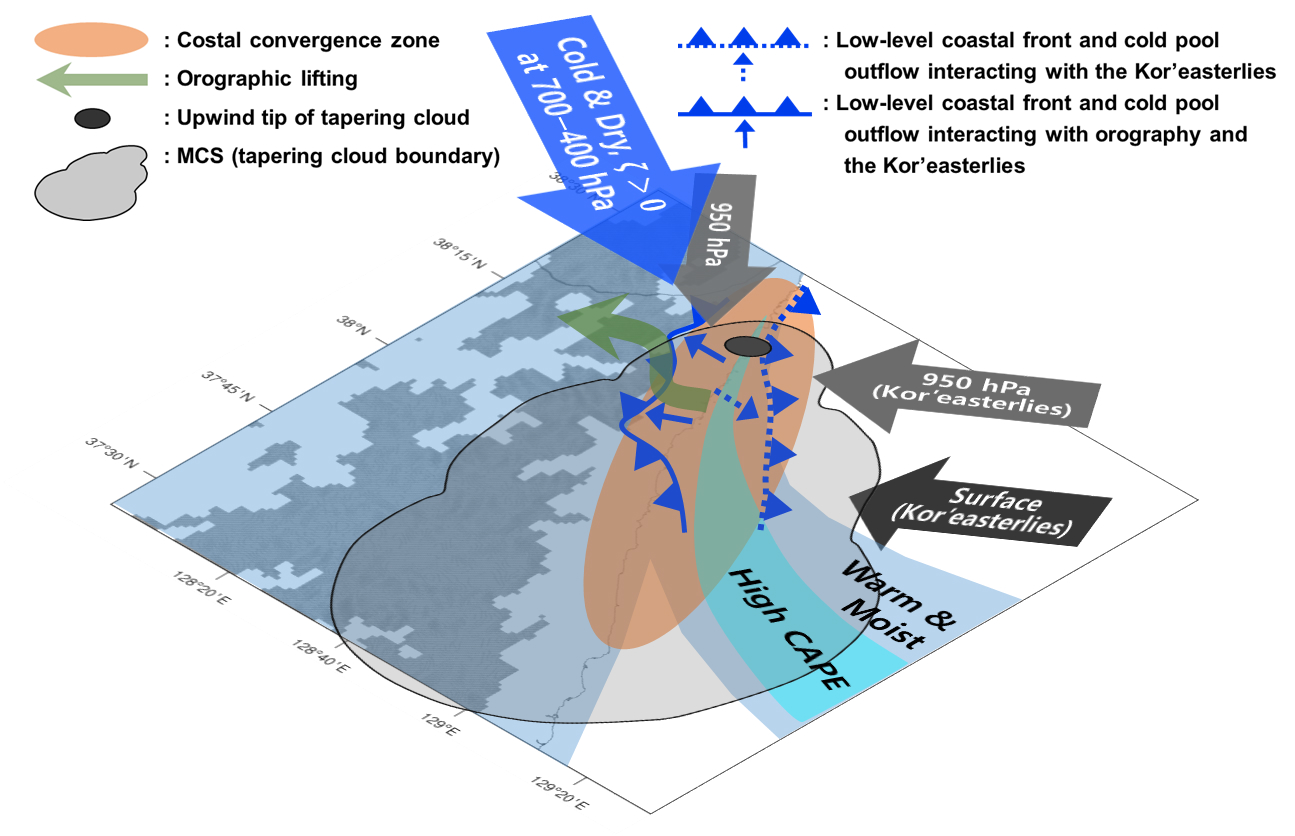
5. Conclusions
Author Contributions
Funding
Acknowledgments
Conflicts of Interest
References
- Park, S.K.; Lee, E. Synoptic features of orographically enhanced heavy rainfall on the east coast of Korea associated with Typhoon Rusa (2002). Geophys. Res. Lett. 2007, 34, L02803. [Google Scholar] [CrossRef] [Green Version]
- Jung, S.H.; Im, E.S.; Han, S.O. The effect of topography and sea surface temperature on heavy snowfall in the Yeongdong region: A case study with high resolution WRF simulation. Asia-Pac. J. Atmos. Sci. 2012, 48, 259–273. [Google Scholar] [CrossRef]
- Lee, J.-G.; Xue, M. A study on a snowband associated with a coastal front and cold-air damming event of 3–4 February 1998 along the eastern coast of the Korean Peninsula. Adv. Atmos. Sci. 2013, 30, 263–279. [Google Scholar] [CrossRef] [Green Version]
- Nam, H.G.; Kim, B.-G.; Han, S.-O.; Lee, C.; Lee, S.-S. Characteristic of easterly-induced snowfall in Yeongdong and its relationship to air-sea temperature difference. Asia-Pac. J. Atmos. Sci. 2014, 50, 541–552. [Google Scholar] [CrossRef]
- Park, S.K. Terminological review and suggestion on the easterlies in Yeongdong and Donghae-Seonpoong. In Preprints of the Korea Meteorological Society 2018 Autumn Meeting; Korea Meteorological Society: Seoul, Korea, 2018; p. 161. (In Korean) [Google Scholar]
- Lapenta, W.M.; Seaman, N.L. A numerical investigation of east coast cyclogenesis during the cold-air damming event of 27–28 February 1982. Part II: Importance of physical mechanisms. Mon. Weather Rev. 1992, 120, 52–76. [Google Scholar] [CrossRef] [Green Version]
- Li, J.; Chen, Y.-L. Barrier jets during TAMEX. Mon. Weather Rev. 1998, 126, 959–971. [Google Scholar] [CrossRef]
- Revell, M.J.; Copeland, J.H.; Larsen, H.R.; Wratt, D.S. Barrier jets around the Southern Alps of New Zealand and their potential to enhance alpine rainfall. Atmos. Res. 2002, 61, 277–298. [Google Scholar] [CrossRef]
- Srock, A.F.; Bosart, L.F. Heavy precipitation associated with southern Appalachian cold-air damming and Carolina coastal frontogenesis in advance of weak landfalling Tropical Storm Marco (1990). Mon. Weather Rev. 2009, 137, 2448–2470. [Google Scholar] [CrossRef]
- Jessup, S.M.; Colucci, S.J. Organization of flash-flood-producing precipitation in the northeast United States. Weather Forecast. 2012, 27, 345–361. [Google Scholar] [CrossRef]
- Bluestein, H.B. Mesoscale convective systems. In Severe Convective Storms and Tornadoes: Observations and Dynamics; Springer: Berlin, Germany, 2013; pp. 265–306. [Google Scholar]
- Nishiyama, K.; Iwai, M.; Koyanagi, S.; Fujisaki, N.; Sato, K. Relationships between heavy rainfall disasters and tapering clouds. J. Jpn. Soc. Civ. Eng. Ser. B1 (Hydraul. Eng.) 2011, 67, I_487–I_492. [Google Scholar] [CrossRef]
- Schumacher, R.S.; Johnson, R.H. Organization and environmental properties of extreme-rain-producing mesoscale convective systems. Mon. Weather Rev. 2005, 133, 961–976. [Google Scholar] [CrossRef]
- Ducrocq, V.; Nuissier, O.; Ricard, D.; Lebeaupin, C.; Thouvenin, T. A numerical study of three catastrophic precipitating events over southern France. II: Mesoscale triggering and stationarity factors. Quart. J. Roy. Meteor. Soc. 2008, 134, 131–145. [Google Scholar] [CrossRef]
- Bresson, E.; Ducrocq, V.; Nuissier, O.; Ricard, D.; de Saint-Aubin, C. Idealized numerical simulations of quasi-stationary convective systems over the Northwestern Mediterranean complex terrain. Quart. J. Roy. Meteor. Soc. 2012, 138, 1751–1763. [Google Scholar] [CrossRef] [Green Version]
- Duffourg, F.; Lee, K.; Ducrocq, V.; Flamant, C.; Chazette, P.; Di Girolamo, P. Role of moisture patterns in the backbuilding formation of HyMeX IOP13 heavy precipitation systems. Quart. J. Roy. Meteor. Soc. 2018, 144, 291–303. [Google Scholar] [CrossRef]
- Lee, K.-O.; Flamant, C.; Duffourg, F.; Ducrocq, V.; Chaboureau, J.P. Impact of upstream moisture structure on a back-building convective precipitation system in south-eastern France during HyMeX IOP13. Atmos. Chem. Phys. 2018, 18, 16845–16862. [Google Scholar] [CrossRef] [Green Version]
- Smith, R.B. The influence of mountains on the atmosphere. Adv. Geophys. 1979, 21, 87–230. [Google Scholar]
- Houze, R.A., Jr. Orographic effects on precipitating clouds. Rev. Geophys. 2012, 50, RG1001. [Google Scholar] [CrossRef]
- Trier, S.B.; Chen, F.; Manning, K.M. A study of convection initiation in a mesoscale model using high-resolution land surface initial conditions. Mon. Weather Rev. 2004, 132, 2954–2976. [Google Scholar] [CrossRef] [Green Version]
- Ćurić, M.; Janc, D. Differential heating influence on hailstorm vortex pair evolution. Quart. J. Roy. Meteor. Soc. 2012, 138, 72–80. [Google Scholar] [CrossRef]
- Shimpo, A.; Takemura, K.; Wakamatsu, S.; Togawa, H.; Mochizuki, Y.; Takekawa, M.; Tanaka, S.; Yamashita, K.; Maeda, S.; Kurora, R.; et al. Primary factors behind the Heavy Rain Event of July 2018 and the subsequent heat wave in Japan. Sci. Online Lett. Atmos. 2019, 15A, 13–18. [Google Scholar] [CrossRef] [Green Version]
- Wang, S.S.-Y.; Kim, H.; Coumou, D.; Yoon, J.-H.; Zhao, L.; Gillies, R.R. Consecutive extreme flooding and heat wave in Japan: Are they becoming a norm? Atmos. Sci. Lett. 2019, 20, e933. [Google Scholar] [CrossRef] [Green Version]
- Tsuguti, H.; Seino, N.; Kawase, H.; Imada, Y.; Nakaegawa, T.; Takayabu, I. Meteorological overview and mesoscale characteristics of the Heavy Rain Event of July 2018 in Japan. Landslides 2019, 16, 363–371. [Google Scholar] [CrossRef]
- Takemi, T.; Unuma, T. Diagnosing environmental properties of the July 2018 Heavy Rainfall Event in Japan. Sci. Online Lett. Atmos. 2019, 15, 60–65. [Google Scholar] [CrossRef] [Green Version]
- Lenderink, G.; Barbero, R.; Loriaux, J.M.; Fowler, H.J. Super Clausius-Clapeyron scaling of extreme hourly convective precipitation and its relation to large-scale atmospheric conditions. J. Clim. 2017, 30, 6037–6052. [Google Scholar] [CrossRef]
- Fieuzal, R.; Duchemin, B.; Jarlan, L.; Zribi, M.; Baup, F.; Merlin, O.; Hagolle, O.; Garatuza-Payan, J. Combined use of optical and radar satellite data for the monitoring of irrigation and soil moisture of wheat crops. Hydrol. Earth Syst. Sci. 2011, 15, 1117–1129. [Google Scholar] [CrossRef] [Green Version]
- Vinukollu, R.K.; Wood, E.F.; Ferguson, C.R.; Fisher, J.B. Global estimates of evapotranspiration for climate studies using multi-sensor remote sensing data: Evaluation of three process-based approaches. Remote Sens. Environ. 2011, 115, 801–823. [Google Scholar] [CrossRef]
- Sieglaff, J.M.; Hartung, D.C.; Feltz, W.F.; Cronce, L.M.; Lakshmanan, V. A satellite-based convective cloud object tracking and multipurpose data fusion tool with application to developing convection. J. Atmos. Ocean. Technol. 2013, 30, 510–525. [Google Scholar] [CrossRef]
- El-Askary, H.; Park, S.K.; Ahn, M.H.; Prasad, A.; Kafatos, M. On the detection and monitoring of the transport of an Asian dust storm using multi-sensor satellite remote sensing. J. Environ. Inform. 2015, 25, 99–116. [Google Scholar] [CrossRef]
- Zhang, X.; Chen, N.; Li, J.; Chen, Z.; Niyogi, D. Multi-sensor integrated framework and index for agricultural drought monitoring. Remote Sens. Environ. 2017, 188, 141–163. [Google Scholar] [CrossRef] [Green Version]
- Miglietta, M.; Laviola, S.; Malvaldi, A.; Conte, D.; Levizzani, V.; Price, C. Analysis of tropical-like cyclones over the Mediterranean Sea through a combined modeling and satellite approach. Geophys. Res. Lett. 2013, 40, 2400–2405. [Google Scholar] [CrossRef]
- Wapler, K.; Harnisch, F.; Pardowitz, T.; Senf, F. Characterisation and predictability of a strong and a weak forcing severe convective event—A multi-data approach. Meteorol. Z. 2015, 24, 393–410. [Google Scholar] [CrossRef]
- Yucel, I.; Onen, A.; Yilmaz, K.K.; Gochis, D.J. Calibration and evaluation of a flood forecasting system: Utility of numerical weather prediction model, data assimilation and satellite-based rainfall. J. Hydrol. 2015, 523, 49–66. [Google Scholar] [CrossRef] [Green Version]
- Lagasio, M.; Parodi, A.; Pulvirenti, L.; Meroni, A.; Boni, G.; Pierdicca, N.; Marzano, F.; Luini, L.; Venuti, G.; Realini, E.; et al. A synergistic use of a high-resolution numerical weather prediction model and high-resolution Earth observation products to improve precipitation forecast. Remote Sens. 2019, 11, 2387. [Google Scholar] [CrossRef] [Green Version]
- Kaskaoutis, D.G.; Nastos, P.T.; Kosmopoulos, P.G.; Kambezidis, H.D. The combined use of satellite data, air-mass trajectories and model applications for monitoring dust transport over Athens, Greece. Int. J. Remote Sens. 2010, 31, 5089–5109. [Google Scholar] [CrossRef]
- Zhang, J.-H.; Yao, F.-M.; Liu, C.; Yang, L.-M.; Boken, V.K. Detection, emission estimation and risk prediction of forest fires in China using satellite sensors and simulation models in the past three decades—An overview. Int. J. Environ. Res. Public Health 2011, 8, 3156–3178. [Google Scholar] [CrossRef] [PubMed] [Green Version]
- Morrison, H.; Thompson, G.; Tatarskii, V. Impact of cloud microphysics on the development of trailing stratiform precipitation in a simulated squall line: Comparison of one-and two-moment schemes. Mon. Weather Rev. 2009, 137, 991–1007. [Google Scholar] [CrossRef] [Green Version]
- Igel, A.L.; Igel, M.R.; van den Heever, S.C. Make it a double? Sobering results from simulations using single-moment microphysics schemes. J. Atmos. Sci. 2015, 72, 910–925. [Google Scholar] [CrossRef] [Green Version]
- Mlawer, E.J.; Taubman, S.J.; Brown, P.D.; Iacono, M.J.; Clough, S.A. Radiative transfer for inhomogeneous atmospheres: RRTM, a validated correlated-k model for the longwave. J. Geophys. Res. Atmos. 1997, 102, 16663–16682. [Google Scholar] [CrossRef] [Green Version]
- Dudhia, J. Numerical study of convection observed during the winter monsoon experiment using a mesoscale two-dimensional model. J. Atmos. Sci. 1989, 46, 3077–3107. [Google Scholar] [CrossRef]
- Oleson, K.W.; Lawrence, D.M.; Bonan, G.B.; Flanner, M.G.; Kluzek, E.; Lawrence, P.J.; Levis, S.; Swenson, S.C.; Thornton, P.E. Technical Description of Version 4.0 of the Community Land Model (CLM); NCAR Technical Note NCAR/TN-478+STR; National Center for Atmospheric Research: Boulder, CO, USA, 2010; p. 257. [Google Scholar]
- Lawrence, D.M.; Oleson, K.W.; Flanner, M.G.; Thornton, P.E.; Swenson, S.C.; Lawrence, P.J. Parameterization improvements and functional and structural advances in version 4 of the Community Land Model. J. Adv. Model. Earth Syst. 2011, 3, 1–27. [Google Scholar]
- Hong, S.Y.; Noh, Y.; Dudhia, J. A new vertical diffusion package with an explicit treatment of entrainment processes. Mon. Weather Rev. 2006, 134, 2318–2341. [Google Scholar] [CrossRef] [Green Version]
- Kain, J.S. The Kain–Fritsch convective parameterization: An update. J. Appl. Meteor. 2004, 43, 170–181. [Google Scholar] [CrossRef] [Green Version]
- Suk, M.-K.; Chang, K.-H.; Cha, J.-W.; Kim, K.-E. Operational real-time adjustment of radar rainfall estimation over the South Korea region. J. Meteor. Soc. Jpn. 2013, 91, 545–554. [Google Scholar] [CrossRef] [Green Version]
- Jung, S.-P.; Kwon, T.-Y.; Han, S.-O.; Jeong, J.-H.; Shim, J.; Choi, B.-C. Thermodynamic characteristics associated with localized torrential rainfall events in the southwest region of the Korean Peninsula. Asia-Pac. J. Atmos. Sci. 2015, 51, 229–237. [Google Scholar] [CrossRef]
- Lee, J.-K.; Kim, J.-H.; Suk, M.-K. Application of bias correction methods to improve the accuracy of quantitative radar rainfall in Korea. Atmos. Meas. Tech. Discuss. 2015, 8, 4011–4047. [Google Scholar] [CrossRef] [Green Version]
- Park, S.; Park, S.K.; Lee, J.W.; Park, Y. Geostatistical assessment of warm-season precipitation observations in Korea based on the composite precipitation and satellite water vapor data. Hydrol. Earth Syst. Sci. 2018, 22, 3435–3452. [Google Scholar] [CrossRef] [Green Version]
- Berne, A.; Krajewski, W.F. Radar for hydrology: Unfulfilled promise or unrecognized potential? Adv. Water Resour. 2013, 51, 357–366. [Google Scholar] [CrossRef]
- Bessho, K.; Date, K.; Hayashi, M.; Ikeda, A.; Imai, T.; Inoue, H.; Kumagai, Y.; Miyakawa, T.; Murata, H.; Ohno, T.; et al. An introduction to Himawari-8/9—Japan’s new-generation geostationary meteorological satellites. J. Meteor. Soc. Jpn. 2016, 94, 151–183. [Google Scholar] [CrossRef] [Green Version]
- Okuyama, A.; Andou, A.; Date, K.; Hosaka, K.; Mori, N.; Murata, H.; Tabata, T.; Takahashi, M.; Yoshino, R.; Bessho, K. Preliminary validation of Himawari-8/AHI navigation and calibration. In Proceedings of the SPIE 9607, Earth Observing Systems XX, San Diego, CA, USA, 7 July 2015; p. 96072E. [Google Scholar]
- Lee, S.; Han, H.; Im, J.; Jang, E.; Lee, M.-I. Detection of deterministic and probabilistic convection initiation using Himawari-8 Advanced Himawari Imager data. Atmos. Meas. Tech. 2017, 10, 1859–1874. [Google Scholar] [CrossRef] [Green Version]
- Lee, Y.-K.; Li, J.; Li, Z.; Schmit, T. Atmospheric temporal variations in the pre-landfall environment of Typhoon Nangka (2015) observed by the Himawari-8 AHI. Asia-Pac. J. Atmos. Sci. 2017, 53, 431–443. [Google Scholar] [CrossRef]
- Hirose, H.; Shige, S.; Yamamoto, M.K.; Higuchi, A. High temporal rainfall estimations from Himawari-8 multiband observations using the random-forest machine-learning method. J. Meteor. Soc. Jpn. 2019, 97, 689–710. [Google Scholar] [CrossRef] [Green Version]
- George, J.J. Weather Forecasting for Aeronautics; Academic Press: Cambridge, MA, USA, 1960; p. 673. [Google Scholar]
- Miller, R.C. Notes on Analysisand Severe Storm Forecasting Procedures of The Air Force Global Weather Central; Tech. Rept. 200(R); Air Weather Service: Offutt Air Force Base, NE, USA; US Air Force: Washington, DC, USA, 1972; p. 184.
- Jung, S.-P.; In, S.-R.; Kim, H.n.; Sim, J.; Han, S.-O.; Choi, B.-C. Classification of atmospheric vertical environment associated with heavy rainfall using long-term radiosonde observational data, 1997–2013. Atmosphere 2015, 25, 611–622, (In Korean with English abstract). [Google Scholar] [CrossRef] [Green Version]
- Sparrow, E.M.; Eichhorn, R.; Gregg, J.L. Combined forced and free convection in a boundary layer flow. Phys. Fluid 1959, 2, 319–328. [Google Scholar] [CrossRef]
- Doswell, C.A., III. Severe convective storms—An overview. In Severe Convective Storms; Meteorological Monographs; Doswell, C.A., III, Ed.; American Meteorological Society: Boston, MA, USA, 2001; Volume 28, pp. 1–26. [Google Scholar]
- Chakraborty, S.; Fu, R.; Massie, S.T.; Stephens, G. Relative influence of meteorological conditions and aerosols on the lifetime of mesoscale convective systems. Proc. Natl. Acad. Sci. USA 2016, 113, 7426–7431. [Google Scholar] [CrossRef] [Green Version]
- Jirak, I.L.; Cotton, W.R.; McAnelly, R.L. Satellite and radar survey of mesoscale convective system development. Mon. Weather Rev. 2003, 131, 2428–2449. [Google Scholar] [CrossRef] [Green Version]
- Lee, J.-W.; Min, K.-H. Analysis of an outflow boundary induced heavy rainfall that occurred in the Seoul metropolitan area. Atmosphere 2017, 27, 455–466, (In Korean with English abstract). [Google Scholar]
- Rotunno, R.; Klemp, J.B.; Weisman, M.L. A theory for strong, long-lived squall lines. J. Atmos. Sci. 1988, 45, 463–485. [Google Scholar] [CrossRef] [Green Version]
- Fritsch, J.M.; Forbes, G.S. Mesoscale convective systems. In Severe Convective Storms; Meteorological Monographs; Doswell, C.A., III, Ed.; American Meteorological Society: Boston, MA, USA, 2001; Volume 28, pp. 323–357. [Google Scholar]
- Brandes, E.A. Finestructure of the Del City-Edmond tornadic mesocirculation. Mon. Weather Rev. 1981, 109, 635–647. [Google Scholar] [CrossRef] [Green Version]
- Georgiev, C.; Santurette, P.; Maynard, K. Weather Analysis and Forecasting: Applying Satellite Water Vapor Imagery and Potential Vorticity Analysis, 2nd ed.; Academic Press: Cambridge, MA, USA, 2016; p. 343. [Google Scholar]
- Johnson, R.H.; Mapes, B.E. Mesoscale Processes and Severe Convective Weather. In Severe Convective Storms; Meteorological Monographs; Doswell, C.A., III, Ed.; American Meteorological Society: Boston, MA, USA, 2001; Volume 28, pp. 71–122. [Google Scholar]
- Maddox, R.A.; Hoxit, L.R.; Chappell, C.F. A study of tornadic thunderstorm interactions with thermal boundaries. Mon. Weather Rev. 1980, 108, 322–336. [Google Scholar] [CrossRef] [Green Version]


| Domain d01 | Domain d02 | Domain d03 | |
|---|---|---|---|
| Horizontal grid spacing | 25 km | 5 km | 1 km |
| Horizontal grid points | 80 × 75 | 126 × 131 | 481 × 481 |
| Vertical levels/Model top | 80 levels/50 hPa | ||
| Vertical coordinate | Hybrid sigma-pressure (default) | ||
| Time step | 150 s | 30 s | 6 s |
| Forecast time | 32 h starting at 00:00 UTC 5 August 2018 | ||
| Microphysics | Morrison double moment [38] | ||
| Radiation | Longwave: RRTM [40]; Shortwave: Dudhia [41] | ||
| Surface physics | Community Land Model version 4 (CLM4) [42,43] | ||
| Planetery Boundary Layer | Yonsei University (YSU) [44] | ||
| Cumulus | Kain-Fritsch (new Eta) [45] | None | |
| Initial/Boundary condition | NCEP FNL Operational Model Global Tropospheric Analyses | ||
© 2020 by the authors. Licensee MDPI, Basel, Switzerland. This article is an open access article distributed under the terms and conditions of the Creative Commons Attribution (CC BY) license (http://creativecommons.org/licenses/by/4.0/).
Share and Cite
Park, S.K.; Park, S. On a Flood-Producing Coastal Mesoscale Convective Storm Associated with the Kor’easterlies: Multi-Data Analyses Using Remotely-Sensed and In-Situ Observations and Storm-Scale Model Simulations. Remote Sens. 2020, 12, 1532. https://doi.org/10.3390/rs12091532
Park SK, Park S. On a Flood-Producing Coastal Mesoscale Convective Storm Associated with the Kor’easterlies: Multi-Data Analyses Using Remotely-Sensed and In-Situ Observations and Storm-Scale Model Simulations. Remote Sensing. 2020; 12(9):1532. https://doi.org/10.3390/rs12091532
Chicago/Turabian StylePark, Seon Ki, and Sojung Park. 2020. "On a Flood-Producing Coastal Mesoscale Convective Storm Associated with the Kor’easterlies: Multi-Data Analyses Using Remotely-Sensed and In-Situ Observations and Storm-Scale Model Simulations" Remote Sensing 12, no. 9: 1532. https://doi.org/10.3390/rs12091532