

Abstract
An analysis of observed trends in African annual-average near-surface temperatures over the last five decades reveals drastic increases, particularly over parts of the subtropics and central tropical Africa. Over these regions, temperatures have been rising at more than twice the global rate of temperature increase. An ensemble of high-resolution downscalings, obtained using a single regional climate model forced with the sea-surface temperatures and sea-ice fields of an ensemble of global circulation model (GCM) simulations, is shown to realistically represent the relatively strong temperature increases observed in subtropical southern and northern Africa. The amplitudes of warming are generally underestimated, however. Further warming is projected to occur during the 21st century, with plausible increases of 4–6 °C over the subtropics and 3–5 °C over the tropics by the end of the century relative to present-day climate under the A2 (a low mitigation) scenario of the Special Report on Emission Scenarios. High impact climate events such as heat-wave days and high fire-danger days are consistently projected to increase drastically in their frequency of occurrence. General decreases in soil-moisture availability are projected, even for regions where increases in rainfall are plausible, due to enhanced levels of evaporation. The regional dowscalings presented here, and recent GCM projections obtained for Africa, indicate that African annual-averaged temperatures may plausibly rise at about 1.5 times the global rate of temperature increase in the subtropics, and at a somewhat lower rate in the tropics. These projected increases although drastic, may be conservative given the model underestimations of observed temperature trends. The relatively strong rate of warming over Africa, in combination with the associated increases in extreme temperature events, may be key factors to consider when interpreting the suitability of global mitigation targets in terms of African climate change and climate change adaptation in Africa.
Export citation and abstract BibTeX RIS

Content from this work may be used under the terms of the Creative Commons Attribution 3.0 licence. Any further distribution of this work must maintain attribution to the author(s) and the title of the work, journal citation and DOI.
1. Introduction
The African continent is highly vulnerable to the impacts of anthropogenically-induced climate change [1, 2]. This stems not only from projected climate-change signals being relatively strong for Africa, but also from a relatively low adaptive capacity. In particular, there are tens of millions of subsistence farmers in Africa who depend on rainfed agriculture in a climate system that exhibits a great deal of natural variability. Recent severe droughts in the Horn of Africa and the Sahel [3] are vivid examples of Africa's vulnerability to a potential increase in droughts under climate change. However, numerous uncertainties surround the projection of future rainfall patterns over Africa. Over the Horn of Africa region most climate models project increases in rainfall under enhanced anthropogenic forcing, yet there is no evidence in observed trends of such a signal [4]. For the Sahel region of West Africa there is little consistency amongst climate models with regard to the direction of future rainfall changes (e.g. increases or decreases), and most models are not capable of representing the inter-annual rainfall variability observed over this region during the last four decades [5]. Indeed, current global climate models (GCMs) are known to exhibit significant systematic errors in representing African climate. These include large biases in representing sea-surface temperatures (SSTs) along the coast of West Africa, inadequate representations of tropical Atlantic SST gradients, unrealistic representations of El Niño Southern Oscillation (ENSO) events and their teleconnections to Africa and inadequate representations of the African monsoon [6, 7]. Both GCMs and regional climate models (RCMs) exhibit notable biases in simulating African rainfall, including a generally inadequate representation of the diurnal cycle in convection [8]. In fact, it may be argued that the simulation of moist, deep convection is the greatest single source of uncertainty in model projections of future climate change, globally and over Africa [9].
The purpose of this paper is to point out that despite the uncertainties that surround the projected rainfall futures over Africa, and despite some significant model biases that exist, actionable messages (in terms of adaptation strategies) of future climate change over Africa can still be formulated. This stems from the robust signals of drastic rises in temperature that are projected to occur over Africa under low mitigation 21st-century futures, by both GCMs and RCMs [2, 10, 11]. That is, for many regions the impact of temperature increases on sectors such as agriculture and biodiversity may be significant, irrespective of rainfall changes [12, 13]. These impacts are projected to occur not only through increases in average temperature, but also through a range of temperature-related extreme events such as heat-waves, high apparent temperatures (affecting human and animal health), wildfires and agricultural drought [2]. The study commences with an analysis of observed trends in African temperatures, followed by an investigation into the ability of an RCM to represent these trends. The model is subsequently used to project changes in average temperature, maximum temperature, heat-wave days, high fire-danger days, rainfall and drought attributes over Africa, and reasons are provided for why these projections may be regarded as actionable.
2. Rapidly rising surface temperatures over Africa—observed trends
Observed trends in annual-average near-surface temperatures over Africa for the period 1961–2010 are shown in figure 1. The analysis is based on the land-station temperature data set CRUTEM4v of the Climatic Research Unit (CRU), which provides homogenized time-series data for 5° longitude × 5° latitude grid boxes [14]. The individual grid-box time-series were adjusted for changing station data contributions [15]. Trends were estimated using the method of pairwise slopes [16], to reduce the impact of outliers on the analysis. Only grid points for which a minimum of 30 years of data were available over the 50-year period under consideration were included in the analysis. Unfortunately, there are large parts of the continent, particularly in the tropics (here defined as the region between 10 °S and 10 °N) and the Sahara, where the time series of recorded temperatures are of insufficient length for trends to be calculated (figure 1). Those grid points at which the trends are significant at the 90% level in terms of the Spearman rank-order correlation coefficient (a non-parametric measure of linear association that is resistant to outliers) [16] are indicated by crosses. The significance thresholds were calculated depending on the number of years of data available at each particular grid point. The results indicate that temperatures have been rising rapidly over Africa over the last five decades, compared to the global rate of temperature increase, and at most locations the increases are statistically significant. The largest trends (more than 3.2 °C/century) have occurred over subtropical southern Africa, subtropical North Africa and parts of central tropical Africa. The rate of temperature increase over these regions is more than twice as high as the global land-based rate of temperature increase. Considering only land-based temperature trends, the Northern Hemisphere (Southern Hemisphere) is estimated to have warmed at a rate of 1.12 °C/century (0.84 °C/century) over the period 1901–2010 in the CRUTEM4 data [14]. The corresponding rate of warming for the period 1979–2010 is 1.11 °C/century (0.42 °C/century) for the Northern (Southern) Hemisphere [14]. The trends calculated here for Africa are consistent with independent analysis of the CRUTEM4 data [14].
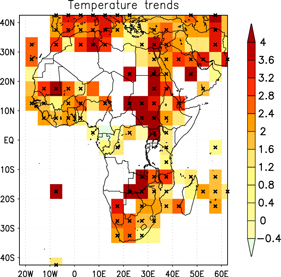
Figure 1. Observed trends in annual-average near-surface temperatures (°C/century) over Africa for the period 1961–2010, calculated using the method of pairwise-slopes applied to the 5° longitude × 5° latitude gridded CRUTEM4v data of CRU. The grid boxes where the trends are statistically significant according to the Spearman rank correlation test are indicated by crosses.
Download figure:
Standard image High-resolution imageThe observed pattern of rapidly rising temperatures over southern Africa, subtropical North Africa and parts of central tropical Africa is particularly noteworthy. The rate of temperature increase over these regions is comparable with the trends observed over the Northern Hemisphere landmasses, and is amongst the highest in the Southern Hemisphere [14]. Should these trends persist or strengthen under enhanced anthropogenic forcing during the 21st century, it may have drastic impacts on numerous sectors across the continent, including biodiversity [13], agriculture [12] and water security (through enhanced evaporation) [17]. These aspects are explored further in the remainder of this paper. Moreover, the realistic representation of the relative magnitude of rising temperature trends across the African continent represents an important test for both global and RCM simulations. The next section investigates whether the observed pattern of trends is captured in RCM downscalings of future climate change over Africa.
3. High-resolution simulations of temperature change over Africa: experimental design, model verification and bias-correction
An RCM is used to project future temperature changes over Africa at relatively high spatial resolution, through the dynamic downscaling of GCM simulations. The RCM is the conformal-cubic atmospheric model (CCAM) of the Commonwealth Scientific and Industrial Research Organisation (CSIRO) [18–20]. Here CCAM solves the hydrostatic primitive equations using a semi-implicit semi-Lagrangian solution procedure, whilst utilizing a comprehensive set of physical parameterizations. The Geophysical Fluid Dynamics Laboratory (GFDL) parameterization for long-wave and shortwave radiation [21] is employed, with interactive cloud distributions determined by a liquid and ice-water scheme [22]. The model employs a stability-dependent boundary layer scheme based on Monin–Obukhov similarity theory [23]. A canopy scheme is included, having six layers for soil temperatures, six layers for soil moisture (solving Richard's equation), and three layers for snow [24]. The cumulus convection scheme uses mass-flux closure [25] and includes both downdrafts and detrainment. CCAM may be employed in quasi-uniform mode or in stretched mode by utilizing the Schmidt transformation [26].
Six GCM simulations of the Coupled Model Intercomparison Project Phase 3 (CMIP3) and Assessment Report Four (AR4) of the Intergovernmental Panel on Climate Change (IPCC), all obtained for the A2 emission scenario of the Special Report on Emission Scenarios (SRES), were downscaled to high resolution over Africa. A multiple nudging strategy was followed, by first integrating CCAM globally at quasi-uniform C48 resolution (about 200 km resolution in the horizontal), forcing the model with the bias-corrected daily SSTs and sea-ice of each host model, and with carbon dioxide (CO2), sulphate and ozone forcing consistent with the A2 scenario. In a second phase of the downscaling, CCAM was integrated in C64 stretched-grid mode with highest resolution centred over southern Africa (28 °E and 25 °S). This provided a resolution of about 60 km over southern Africa, decreasing to about 80 km over North Africa. The higher resolution simulations were nudged within the quasi-uniform C48 simulations, through the application of a scale-selective filter [27, 28] using a 4000 km length scale. The filter was applied at six-hourly intervals and from 900 hPa upwards. The model's ability to realistically simulate present-day southern African climate has been extensively demonstrated [29–33].
The GCMs selected for downscaling are CSIRO-Mk3.5, GFDL-CM2.0, GFDL-CM2.1, UKMO-HadCM3, ECHAM5/MPI-OM and Miroc3.2-medres of CMIP3—more detailed descriptions of these GCMs are available elsewhere [30, 32, 34]. Given the experimental design of the RCM simulations performed here (only SST and sea-ice forcing are provided by the host models), the set of six host models were selected from the twenty-three GCMs available from CMIP3 particularly because of their superior simulation of several different present-day El Niño attributes [35]. A realistic representation of ENSO variability is known to be a key factor in terms of simulating at least present-day southern African and East African climate variability [6, 7, 36]. Practical considerations in terms of computational capacity and data storage also played a role in not downscaling a larger ensemble of GCMs. The six GCMs selected represent a wide range of projected changes in El Niño magnitudes under climate change, but not the full range of behaviours exhibited by the larger ensemble of CMIP3 models [35]. That is, the full uncertainty range of changes in El Niño attributes as projected by CMIP3 GCMs is not represented in the downscalings analysed in the paper. There are strong arguments though, for rather using smaller ensembles of GCMs (for analysis or downscaling) that simulate a particular attribute of relevance to an area of interest particularly well (in this case El Niño attributes), at least for present-day climate, rather than to apply the principle of model democracy [37, 38]. Exploring this debate within the context of projecting African climate change falls beyond the scope of this paper, however.
Another important feature of the downscalings performed here is that CCAM was forced with the bias-corrected SSTs and sea-ice fields of the GCMs, for the period 1961–2100, rather than with the raw GCM output. This approach stems from most current coupled GCMs not employing flux corrections between atmosphere and ocean [39], which contributes to the existence of biases in their simulations of present-day SSTs—of more than 2 °C along the West African coast. The bias is computed by subtracting for each month the Reynolds (1988) SST climatology (for 1961–2000) from the corresponding GCM climatology. The bias-correction is applied consistently throughout the simulation. Through this procedure, the climatology of the SSTs applied as lower boundary forcing is the same as that of the Reynolds SSTs. Moreover, systematic errors such as the well-known 'cold tongue' bias along the equatorial Pacific, common to many GCMs, are effectively removed by this bias-correction procedure (this bias leads to significant distortions of flow patterns over the equatorial Pacific in the host GCMs). The intra-annual variability and climate-change signal of the GCM SSTs are preserved by the bias-correction procedure, however [34, 39].
The model simulations are verified in terms of their ability to represent the observed trends in annual-average temperature recorded over Africa during the period 1961–2010 (figure 1). Towards a quantitative verification, the model simulations were first regridded from a 0.5° latitude-longitude grid to the 5° longitude by 5° latitude CRUTEM4v grid boxes, using simple box averages. The simulated trends per 5° × 5° grid box are displayed in figure 2, for each of the six downscalings. Trends were calculated using the method of pairwise slopes, and grid boxes with significant trends (calculated using the Spearman rank-order correlation coefficient) are marked by crosses. Qualitatively, it is apparent that all six downscalings exhibit relatively strong trends over the western and central parts of subtropical southern Africa. Relatively strong trends are also simulated for subtropical northern Africa by most downscalings, although extrema within this region are simulated by some downscalings to occur in the west (CSIRO-Mk3.5 and UKMO-HadCM3), whilst other simulate the extrema to occur over the central and eastern parts (GFDL-CM2.0, GFDL-CM2.1, Miroc3.2-medres). Due to the lack of long-term time series data for many of the CRUTEM4v grid boxes, it is not clear from the observations which parts of North Africa have warmed most during the five decades under consideration. It may be noted that one of the six downscalings (ECHAMS/MPI-OM) doesn't capture at all the strong temperature trends recorded over subtropical North Africa. Also, the downscalings are indicative of relatively weaker trends over central tropical Africa (compared to the subtropical parts). That is, none of the downscalings show any indication of the strong trends that have apparently occurred over central and eastern parts of tropical Africa over the 1961–2010 period (figure 1). Such a pattern of strong warming is also absent in the CCAM projections (see section 4) and the GCM projections of CMIP3 and Coupled Model Intercomparison Project Phase Five (CMIP5) [2, 10, 11]. This points to deficiencies in either the observed station data, constructed gridded data or trend analysis, or to RCMs and GCMs not capturing a key physical process present in the central tropical African climate system over the last five decades. Further analysis of this discrepancy between observations and model projections falls beyond the scope of this study. The somewhat different spatial trends and amplitudes of warming simulated by the ensemble of downscalings imply that in the presence of the same anthropogenic forcing signal (e.g. increased greenhouse gas concentrations over 1961–2010) the different members simulate different regional climate-change signals in response to the different SST and sea-ice forcing. The simulations (experimental design and limited ensemble size) do not take into account, however, internal-model variability, which has recently been shown to be a factor influencing simulated regional climate trends, even in the presence of mid 21st century anthropogenic forcing [40].
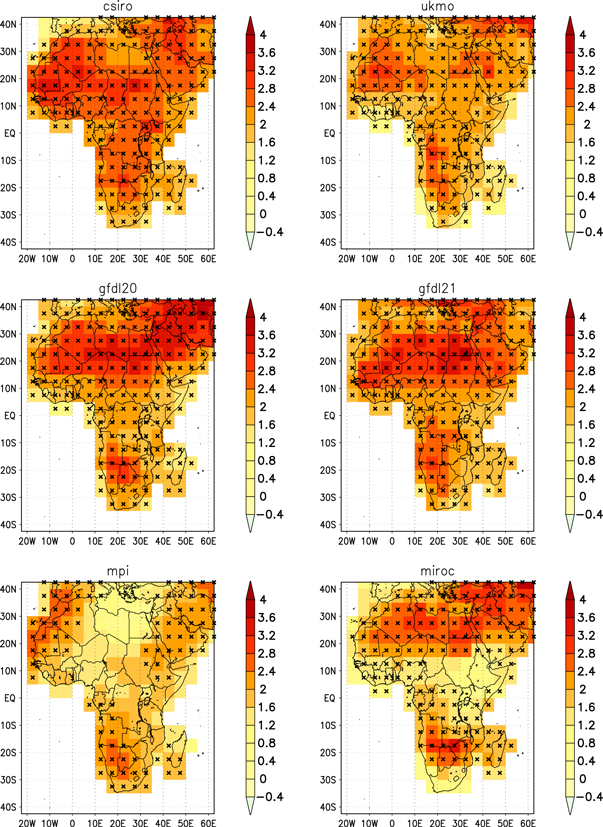
Figure 2. Simulated trends in annual-average near-surface temperatures (°C/century) over Africa for the period 1961–2010, calculated from CCAM downscalings of six CMIP3 GCMs integrated under the A2 SRES scenario. Trends were calculated using the method of pairwise-slopes after interpolating the high-resolution model simulations to the 5° longitude × 5° latitude CRUTEM4v grid. The grid boxes where the trends are statistically significant according to the Spearman rank correlation test are indicated by crosses.
Download figure:
Standard image High-resolution imageThe Taylor diagram in figure 3 quantifies how closely the simulated trends resemble the observed trends, for southern Africa (Africa south of 10 °S, black triangles) and across the continent (open triangles in figure 3). For the southern African domain, the high pattern correlations of about 0.7 achieved by most downscalings are indicative that the regional pattern of the strongest warming occurring over the western and central parts of subtropical southern Africa is well captured. However, the normalized standard deviations are less than 0.5 for most downscalings, indicating that the variation of trends in space is significantly less in the simulations than the observations. The verification of trends across the African continent produces pattern correlations that are still positive, but significantly less (0.3 or smaller) than the pattern correlations obtained for the southern African region. One reason for this result is the strong trends in temperature present in the observed data over the central parts of tropical Africa, a feature that is not present in any of the downscalings.
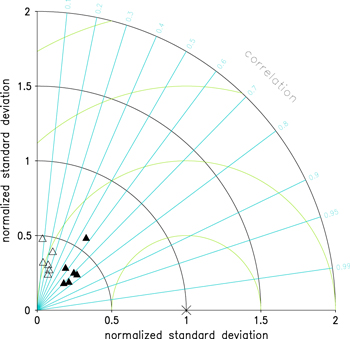
Figure 3. Taylor diagram depicting pattern correlation, normalized standard deviation and normalized root mean-square error of the six downscalings compared to observations (cross on the x-axis), for southern Africa (dark triangles) and Africa (open triangles). Southern Africa is defined here as Africa south of 10 °S. The normalized root mean-square error is represented by the distance to the point on the x-axis identified as observed.
Download figure:
Standard image High-resolution imageTo enhance the plausibility of projections of changes in extreme temperature events and water-balance related metrics over Africa, it is useful to first bias-correct the model simulations of temperature and rainfall, to remove any systematic errors in the simulation of the amplitudes of these fields. Leaving such biases unchecked may otherwise, for example, affect the calculation of the frequencies of exceedance of threshold events. A simple monthly-scale mean bias-correction procedure is applied in this research [13, 33]. The monthly climatologies of the CRU TS3.1 data set [41], for average temperature (defined as the average of minimum and maximum temperature) and rainfall over the period 1961–1990 are used as reference climatologies. Each of the six downscalings was subsequently interpolated to the 0.5° latitude-longitude grid of the CRU TS3.1 data, to facilitate the generation of gridded bias-corrected simulations [13, 33]. After calculation of the monthly climatologies of average temperature and rainfall totals for each downscaling, the corresponding monthly biases were calculated for all variables (with respect to the corresponding CRU TS3.1 monthly climatologies). The simulated daily precipitation values over the full period 1961–2100 were subsequently bias-corrected for each downscaling (using a multiplicative factor unique to each month of the year, defined as the ratio of the observed monthly rainfall climatology for 1961–1990 to the corresponding simulated climatology of the particular downscaling). The daily average temperatures and maximum temperatures were bias-corrected using a similar procedure, with the only difference that the monthly correction factor was additive. In this case, the average temperature correction factor for a specific month is simply the relevant monthly climatology of the downscaling subtracted from the corresponding CRU TS3.1 monthly climatology (the same additive correction is applied to the maximum temperatures). The net result of this bias-correction procedure is that the monthly climatologies of each of the bias-corrected downscalings exactly represent the CRU TS3.1 climatologies for rainfall and average temperature, for the period 1961–1990 (the period over which the biases are calculated). However, the inter-annual variability in the monthly climatologies of the host GCMs is preserved, and the daily statistics of average temperature, maximum temperature and rainfall will remain to differ from one downscaling to the next (depending on the internal variability of the respective downscaled climatologies). Climate change anomalies are therefore calculated separately for each downscaling with respect to its own present-day climatology. It may be noted that the simulated trends in annual-average temperature for the bias-corrected data (not shown) corresponds closely to those calculated for the raw (not bias-corrected) data (as displayed in figure 2 and verified in figure 3).
4. Projections of temperature change over Africa
4.1. Baseline climatologies
The model-simulated baseline climatologies for the period 1961–1990, for a number of temperature and water-balance related metrics, are displayed in figure 4. Each field shows the median of the six downscalings, calculated at each grid point for the metric under consideration. Note that in figure 4 and in all subsequent figures, the climatologies used are those of the bias-corrected downscalings. For the cases of annual-average temperature (figure 4(a)) and annual rainfall totals (figure 4(e)) the fields shown are effectively those of the CRU TS3.1 climatologies [41] for 1961–1990 (due to the bias-correction process). However, the daily statistics of average temperature, maximum temperature and rainfall differ from one downscaling to the next, depending on the internal variability of the respective downscaled climatologies, despite this variability being constrained to some extent by the bias-correction procedure. This implies that there will be some variability in the present-day climatologies of variables such as heat-waves and high fire-danger days, across the ensemble. Climate change anomalies are therefore calculated not in terms of the baseline climatologies displayed in figure 4, but are calculated separately for each downscaling with respect to its own present-day climatology.
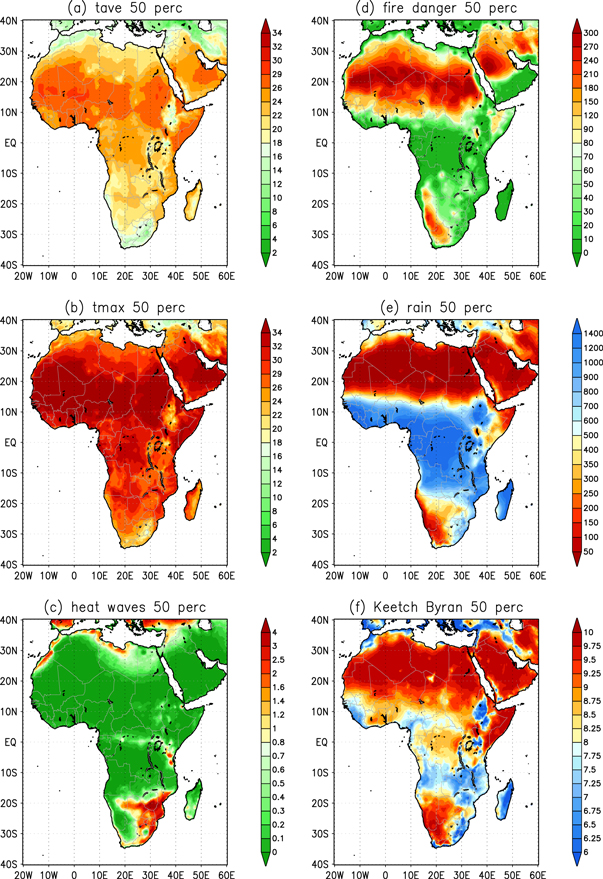
Figure 4. Model baseline climatologies for the period 1961–1990 (calculated at each grid point from the median of the six downscalings): (a) annual-average temperature (°C); (b) annual-average maximum temperature (°C); (c) annual-average number of heat-wave days (number of events per grid point per year); (d) annual-average number of high fire-danger days (number of events per grid point per year); (e) annual- average rainfall totals (mm); (f) annual-average value of the Keetch–Byram drought index.
Download figure:
Standard image High-resolution imageLarge parts of subtropical southern Africa and subtropical North Africa are semi-arid or arid (annual-average rainfall less than 500 mm). Semi-arid and arid conditions also extend into the tropics over the Horn of Africa region. Africa is a warm continent, with annual-average temperatures generally higher than 18 °C (figure 4(a)). The only regions with lower annual-average temperatures are the southern and eastern escarpment areas of South Africa, the East African escarpment, the Namibian coast and the Mediterranean coast of northwest Africa. Over the Sahara, annual-average temperatures are generally higher than 26 °C. Annual-average maximum temperatures are higher than 26 °C over most of the continent and higher than 34 °C over the Sahara (figure 4(b)). Heat-waves typically occur when high-pressure systems induce prolonged periods of subsidence and sunny conditions over a particular region, which leads to a gradual increase in near-surface temperatures until critical thresholds are exceeded. Here heat-waves are defined as events where the maximum temperature at a specific location exceeds the average maximum temperature of the warmest month of the year by 5 °C, for a period of at least 3 days. The average temperature of the warmest month of the year was calculated using the bias-corrected maximum temperature data for the period 1961–1990. Following this definition, all heat-waves occurring over the period 1961–1990 were identified and the number of days occurring within heat-waves calculated (hereafter referred to as heat-wave days). Heat-waves are rare events over Africa under present-day conditions, following this strict definition. The highest numbers of heat-wave days (about 3 days per year on the average) occur over Limpopo river basin region in southern Africa, the eastern interior and east coast regions of South Africa and the Mediterranean coast of North Africa (figure 4(c)). Over tropical Africa and the Sahara regions, the average temperature of the warmest month sets a high threshold that is seldom exceeded by a margin of 5 °C for a period of 3 days or more. The high frequencies of heat-wave days over the Limpopo river basin occurs in association with mid-level high pressure systems that frequent his region as part of the regional manifestation of the Hadley cell over southern Africa [29].
Fire is a key agent of change in the African savannas, which are shaped through the complex interactions between trees, C4 grasses, rainfall, temperature, CO2 and fire [42, 43]. These fires and their emitted smoke can have numerous direct and indirect effects on the environment, water resources, air quality and climate [44, 45]. For instance, wild fires cause large financial losses to agriculture, livestock production and forestry in Africa on an annual basis. Africa is estimated to contribute over 50% of the global carbon emissions from fires [46]. Given this overwhelming dominance of biomass burning in Africa, the overall regional impact of fires is potentially significant, although still under investigation [44, 47–50]. Therefore, it is important to understand the potential fire risk associated with surface temperature increases in Africa. As an indication of fire risk, the McArthur forest fire index (FFDI) is used in this study to quantify the number of high fire-danger days across the continent. The index is defined as
Here T is maximum temperature (°C), H is relative humidity and U is average wind speed (measured at a height of 10 m in m s–1) [51, 52]. D is the Keetch–Byram drought index, which is defined in terms of a daily drought factor dQ:
Here R is the mean annual precipitation (mm) and Q (mm) is the soil-moisture deficiency that results from the interaction between rainfall and evaporation. Once Q has been updated by dQ, the drought index is calculated from the equation

Note that D ranges from 0 to 10, where D = 10 indicates maximum fuel availability [51, 53, 54]. The annual-average number of days during which the FFDI exceeds a value of 12 (high fire-danger) [55] is shown in figure 4(d). The dry regions of western southern Africa and the Sahara exhibit the highest numbers of high fire-danger days (more than 150 days per year); however, there is little vegetation to provide fuel for fires in these regions. Of more significance are the 30–80 days per year of high fire danger that are simulated to occur in the savanna regions of southern Africa and the Sahel region of North Africa. Here fire plays a crucial role in shaping the relative abundance of C4 grass and trees [42, 43]. The lowest numbers of high fire-danger days are simulated to occur over tropical Africa and the eastern coastal areas of South Africa and Mozambique. This is due to the high rainfall totals (figure 4(e)) and high frequency of rainfall days occurring over these regions. The Keetch–Byram annual-average drought index values (figure 4(f)) approach the theoretical upper limit of 10 in the Sahara and western southern African deserts, these regions being the driest regions in Africa. The lowest values are located in the southern and northern extremities of the tropics, where rainfall is high but temperatures (and evaporation) are somewhat lower than in the vicinity of the equator.
4.2. Projected changes in near-surface temperatures
In figures 5–7, the ranges of change projected by the downscalings for a number of temperature and water-balance related metrics for the period 2071–2100 relative to 1961–1990 are presented. The 10th percentile, median and 90th percentile of the projected changes are shown for each metric (note that the percentiles are based on changes calculated separately for each downscaling with respect to its own present-day climatology). The increase in annual-average global near-surface temperature is just above 3 °C in the global CCAM simulations performed (section 3) under the A2 scenario, for the period 2071–2100 relative to 1961–1990 [13]. However, the increase in annual-average surface temperature is projected to range between 4 and 6 °C in the African subtropics (the regions between 35 °S and 10 °S, and 10 °N and 35 °N), and between 3 and 5 °C in the African tropics, by the downscalings performed (figures 5(a)–(c)). The downscaling exhibiting the strongest signal of temperature increase (Miroc3.2-medres) consistently project strong drying, whilst the downscaling projecting the most modest temperature increases (CSIRO-Mk3.5) consistently projects general increases in rainfall and cloud cover over large parts of southern Africa (details not shown for individual models). These amplitudes of temperature change are consistent with the ranges of change projected by the CMIP3 and CMIP5 GCMs [2, 10, 11]. Moreover, the patterns of change are remarkably similar across the ensemble, in contrast to the somewhat different patterns of temperature trends simulated for the period 1961–2010 (figure 2). This suggests that the projected regional climate-change signal in temperature is strongly determined by enhanced anthropogenic forcing towards the end of the 21st century, and is less dependent on differential SST and sea-ice forcing from the host GCMs. The fact that African temperatures are projected to rise at about 1.5 times the global rate of temperature increase in the subtropics and at a rate somewhat higher than the global rate in the African tropics, should be a consideration when deciding on the suitability of the Long Term Global Goal (LTGG) of the United Nations Framework Convention on Climate Change (UNFCCC) for preventing dangerous climate change over Africa. Currently, the LTGG is to keep the rise in global average surface temperatures to below 2 °C, compared to pre-industrial conditions. Under low mitigation, however, the world is likely to experience an increase in global average surface temperature of 3 °C or more [2, 10, 11, 56], and the relatively strong temperature signal over Africa is of particular concern within this context. Figures 5(d)–(f) suggest that annual-average maximum temperatures are projected to increase at slightly smaller rates than annual-average temperatures over Africa. It may also be noted that observed trends in average near-surface temperature in subtropical southern and North Africa (section 2, figure 1) are indicative of increases occurring at more than twice the global rate of temperature increase, and that at least the downscalings presented here are underestimating these trends (section 3). This and the relative rates of change projected by CMIP3 and CMIP5 GCMs for Africa (compared to the projected increases in average global surface temperature) during the 21st century [2, 10, 11] may suggest that RCM and GCM projections of African temperature change, although drastic, are conservative.
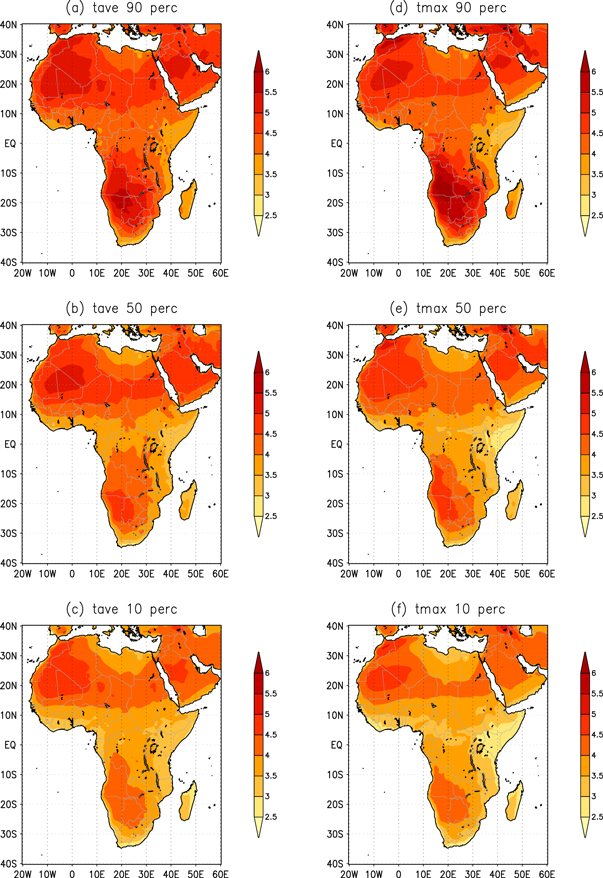
Figure 5. Projected change in annual-average temperature (°C) over Africa, for the time period 2071–2100 relative to 1961–1990. The 90th percentile (a), median (b) and 10th percentile (c) are shown for the ensemble of CCAM downscalings of six GCM projections under the A2 SRES scenario. Panels d to f are the same, but for maximum temperature.
Download figure:
Standard image High-resolution image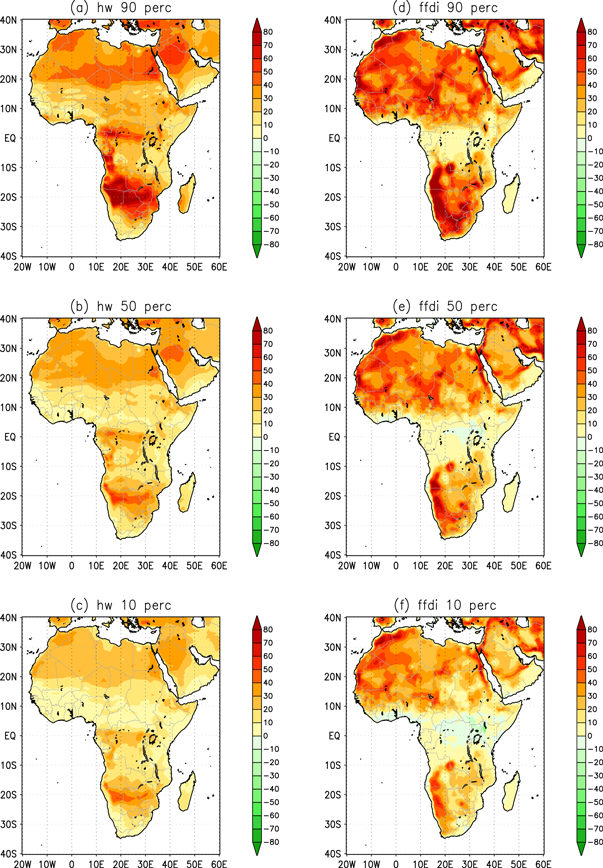
Figure 6. Projected change in heat-wave days (number of days per grid point per year) over Africa, for the time period 2071–2100 relative to 1961–1990. The 90th percentile (a), median (b) and 10th percentile (c) are shown for the ensemble of CCAM downscalings of six GCM projections under the A2 SRES scenario. Panels d to f are the same, but for the number of high fire-danger days.
Download figure:
Standard image High-resolution image
Figure 7. Projected change in annual-average rainfall (mm) over Africa, for the time period 2071–2100 relative to 1961–1990. The 90th percentile (a), median (b) and 10th percentile (c) are shown for the ensemble of CCAM downscalings of six GCM projections under the A2 SRES scenario. Panels (d)–(f) are the same, but for the projected change in the Keetch–Byram drought index.
Download figure:
Standard image High-resolution image4.3. Projected changes in heat-wave days and high fire-danger days
The projections of future heat-wave day frequencies are derived in terms of the heat-wave definition applied to present-day climate (see section 4.1). The projected increase in the number of heat-wave days for the time-slab 2071–2100 relative to the baseline period is drastic. Under present-day conditions, few regions experience more than 3 of these days on the average per year (figure 4(c)). However, under future forcing, 20–80 more heat-wave days are projected to occur annually over subtropical southern Africa (an increase of more than 80 days is projected to occur over some regions according to the worst-case projections) (figures 6(a)–(c)). Over the Sahel and Sahara an increase of 10–40 heat-wave days are projected to occur annually. In the tropics, increases of 10–50 days per year are projected. These projections are representative of unprecedented periods of prolonged heat over Africa [57]. With an increase of 4–6 °C in annual-average maximum temperatures projected for southern Africa and the Sahel, and 3–5 °C in the tropics, the drastic increase in frequencies of heat-wave days is not surprising. In the subtropics, particularly over southern Africa, projected circulation changes such as the intensification and increased frequency of occurrence of mid-level highs and associated subsidence are a contributing factor to increased heat-wave day occurrence [29, 32]. In the tropics, the projected changes are probably not weather-system related but largely the result of the systematic increase in maximum temperatures leading to the critical heat-wave thresholds being exceeded. The increased frequency of occurrence of heat-wave days may have a wide range of impacts in Africa. Some examples include drastic decreases in the maize crop through the exceedance of critical temperature thresholds, even in the presence of optimal rainfed management [58] or increases in precipitation [12], increased livestock mortality and adverse impacts on human health [2]. It is a particular concern that the potential health impacts from chronic exposure to high temperatures, as is projected for Africa in a changing climate, are not understood. The few heat-health studies conducted in Africa have focused on acute exposure to heat (e.g. during heat-wave events) [59–63].
Drastic increases in the number of high fire-danger days are projected to occur consistent with the projected increase in heat-wave days (figures 6(d)–(f)). Over much of subtropical southern Africa, increases are projected to range between 20 and 80 days per year. The smallest increases are projected for tropical Africa, in fact, some of the downscalings project a slight decrease in high fire-danger days over the this region. The smaller amplitude of changes in high fire-danger days over tropical Africa is projected to occur in response to an increase in rainfall over the region (see figure 7 and the discussion below). The drastic increases in the number of high fire-danger days projected for the savanna regions of subtropical Africa, in particular the Miombo woodlands of Zambia, Zimbabwe and Mozambique, and the Sahel of North Africa, is of particular significance. It is currently postulated that increases in atmospheric CO2 may during the 21st century strongly favour trees over C4 grasses in the African savanna, even leading to forestation of the savannas [64]. Rising temperatures may further favour the trees in the savannas and the intrusion of trees into the African grass lands [13]. However, a drastic increase in high fire-danger days may lead to strengthening of the grass-savanna fire trap [42, 43], providing a defence mechanism to the grasses. It is pertinent to note that the analyses and projections in this study do not include explicit treatments of forcings and feedbacks from fires. Coupled land-atmosphere models with sophisticated dynamic vegetation and fire models are clearly needed to study the dynamic interactions between fire, trees, C4 grasses, temperature and rainfall within the African savanna. Except for the possible impacts on biomes, increases in the number of high fire-danger days may also impact on African agriculture and livestock production through the more frequent occurrence of devastating wildfires, on regional air quality and on the direct and indirect forcings of climate by aerosols [44–50].
4.4. Projected changes in rainfall and soil-moisture availability
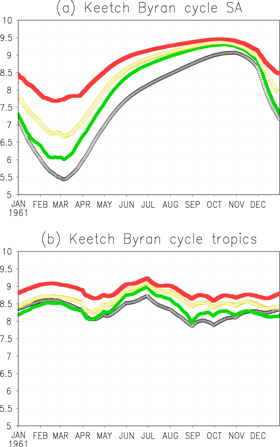
The projected range of future rainfall changes over Africa as described by the six downscalings is presented in figures 7(a)–(c), whilst the range of projected changes in soil-moisture availability, as approximated by the Keetch–Byram drought index (see section 4.1), is shown in figures 7(d)–(f). Projections of future rainfall patterns over Africa exhibit greater uncertainty than the projected temperature futures. Most CMIP3 and CMIP5 GCMs project general rainfall increases for East Africa, and decreases for southern Africa, however, considerable variation is associated with this general pattern across different GCM (and RCM) projections [2, 10, 11, 29]. For example, some of the downscalings performed here project not only East Africa but also tropical Africa and the Sahel to experience general rainfall increases, whilst increases are confined to only parts of East Africa in others (figures 7(a)–(c)). Despite this uncertainty, the projected changes in the Keetch–Byram drought index exhibit considerably less variation (figures 7(d)–(f)). General drying (in terms of the index) is projected across the continent, even for areas (e.g. tropical Africa) where an increase in rainfall is plausible. This is due to the drastic increases in temperature that are projected, which leads to drier soils (through enhanced evaporation) despite the rainfall increases. A possible exception to this general pattern is the Sahel, where a minority of downscalings project increased soil-moisture availability in response to increasing rainfall, despite strong regional warming. This may be important in terms of tree—C4 grass interactions and agriculture in the future climate [41, 42, 64]. The seasonal cycle in the Keetch–Byram index and its projected changes are shown in figure 8, averaged over a part of southern Africa (30 °S–10 °S and 20 °E–35 °E) and tropical Africa (10 °S–10 °N and 20 °E–35 °E). Both regions are projected to become generally drier in terms of the index, across the ensemble of downscalings. For the southern African region, the conditions of dryness that typically peak by mid-October under present-day climate may prevail from May to December under future forcings (indicating effectively, a longer burning season and a shorter growing season, figure 8(a)). This signal of drying is of particular importance for southern Africa where yields of rainfed maize production are known to be highly sensitive to extreme temperature events that occur in the absence of adequate soil moisture [58]. Even in tropical Africa (figure 8(b)) and East Africa (cycle not shown), decreasing soil moisture in response to drastic warming may lead to reduced crop yield despite increases in rainfall [12, 58]. The projected increases in temperature may have additional implications for the water balance in river basins across Africa, skewing the uncertain projections of precipitation changes towards reductions in runoff (through enhanced evaporation) [17].
Figure 8. Projected change in the seasonal cycle of the Keetch–Byram drought index over southern Africa (a) and tropical Africa (b), for the time period 2071–2100 relative to 1961–1990. The 10th percentile (green), median (yellow) and 90th percentile (red) are shown for the ensemble of CCAM downscalings of six GCM projections under the A2 SRES scenario, relative to the median of the simulated present-day cycles (black).
Download figure:
Standard image High-resolution image
5. Summary and conclusions
An analysis of CRUTEM4v time–series data for Africa reveals that annual-average temperatures have been rising at an alarming rate across the continent over the five decades of 1961–2010. Over parts of subtropical southern Africa, central tropical Africa and subtropical northern Africa, the rate of temperature increase has been shown to be 3.2 °C per century, or even higher. An ensemble of regional downscalings of GCM simulations for the period 1961–2100 under the A2 scenario, obtained using the variable-resolution atmospheric model CCAM, is evaluated in the paper in terms of ability to represent the main observed regional patterns of warming. Only six GCM simulations (under low mitigation) have been downscaled using CCAM, through a methodology that involves forcing the variable-resolution model at its lower boundary with the SSTs and sea-ice of the host models (nudging towards the atmospheric fields of the host GCMs is not performed). The rather small number of GCMs downscaled using a single RCM is an important limitation of the study, in terms of representing the full range of uncertainty associated with the larger ensemble of GCM projections of CMIP3 and CMIP5. However, the GCMs were selected in terms of their demonstrated ability to realistically simulate a number of present-day El Niño attributes, an important consideration for the realistic simulation of present-day climate variability in southern and East Africa. Verification of the CCAM downscalings reveals that the model is capable of representing the patterns of strong warming observed during 1961–2010 over subtropical southern and northern Africa. However, the model downscalings underestimate the amplitude of historical warming. Also, the downscalings do not provide any indication of the relatively strong warming observed over central tropical Africa. This regional signal is also absent in the CCAM projections of future climate change, and in the ensemble of GCM projections presented in AR4 and Assessment Report Five (AR5) [2, 10, 11]. This points to either deficiencies in the station data, the gridded data set construction, the trend analysis performed, or to RCMs and GCMs not capturing a key physical process present in the central tropical African climate system over the last five decades.
The differential lower boundary forcing of the GCMs is the main factor inducing uncertainty in the CCAM simulations of present-day trends and projected futures. The ensemble size of six is relatively small, and the simulations do not explicitly take into account the effects of internal model-variability on the simulated regional trends and projected changes. It has recently been illustrated that this may be an important factor influencing projected regional climate-change signals, particularly in the case of precipitation by the early and mid-21st century, when anthropogenic forcing under low mitigation is still strengthening [40]. It is therefore insightful that the downscalings presented here exhibit relatively high variation in the simulation of present-day temperature trends, but that under enhanced anthropogenic forcing, similar patterns of regional warming are projected across the ensemble. This may suggest that variability induced by the different SST and sea-ice forcings induces significantly different regional trends in temperature under present-day climate, but that enhanced anthropogenic forcing induces spatially coherent signals across the ensemble towards the end of the century. The relatively wide (narrow) range of projected rainfall (temperature) futures by the end of the century obtained through the differential lower-boundary forcing is another important outcome of the study. The high-resolution downscalings paint a picture of a continent warming rapidly under low mitigation (compared to the global-average rate of temperature increase). Temperatures are projected to rise at about 1.5 times the global rate of temperature increase over subtropical Africa, whilst somewhat smaller increases are projected for tropical Africa. These projections are consistent with the latest GCM projections under low mitigation scenarios [2, 10, 11]. Drastic increases in the number of heat-wave days and high fire-danger days, and reduced soil-moisture availability, are consistently projected. The strong signal of future increases in African temperatures and related extreme events, and associated potential impacts on agriculture, water security and biodiversity are important factors towards finding actionable messages for climate change adaptation in Africa. African temperature futures may therefore be a key aspect for African policy makers to consider, when negotiating the suitability of global mitigation targets such as the LTGG of the UNFCC.
Acknowledgments
The research received funding support from the European Commission Seventh Framework Programme 'FP7' through the report of EU-FP7 project DEWFORA—Improved Drought Early Warning and FORecasting to strengthen preparedness and adaptation to droughts in Africa, Grant No. 265454, a CSIR Parliamentary Grant EECM066, Thematic Area 2 of the Applied Centre for Climate and Earth System Studies (ACCESS) in South Africa and the National Aeronautics and Space Administration (NASA) under its Research Opportunities in Space and Earth Sciences (ROSES)—2009 Interdisciplinary Studies (IDS) Programme. All regional projections were performed on the computer clusters of the Centre for High Performance Computing (CHPC) in South Africa. Christien Engelbrecht and Neville Sweijd are thanked for their constructive comments on the manuscript. Moreover, comments from three anonymous reviewers have helped to improve the paper. We acknowledge the modelling groups, the Program for Climate Model Diagnosis and Intercomparison (PCMDI) and the World Climate Research Programme's (WCRP's) Working Group on Coupled Modelling (WGCM) for their roles in making available the WCRP CMIP3 multi-model dataset (with regards to the GCM projections downscaled in this paper). Support of this dataset is provided by the Office of Science, US Department of Energy.