The Characteristics of Ambient Non-Methane Hydrocarbons (NMHCs) in Lanzhou, China
by
 ,
,
Yajun Wu
1, 
Jun Hu
1,
Han Wang
1,2,
Hui Li
1,2,
Hefeng Zhang
1,2,3,
Fahe Chai
1,2 and
Shulan Wang
1,2,* 1
Atmospheric Environment Institute, Chinese Research Academy of Environmental Sciences, Ministry of Ecology and Environment (MEE), Beijing 100012, China
2
State Key Laboratory of Environmental Criteria and Risk Assessment, Chinese Research Academy of Environmental Sciences, Beijing 100012, China
3
National Joint Research Center for Tackling Key Problems in Air Pollution Control, Ministry of Ecology and Environment (MEE), Beijing 100012, China
*
Author to whom correspondence should be addressed.
Atmosphere 2019, 10(12), 745; https://doi.org/10.3390/atmos10120745
Submission received: 1 October 2019
/
Revised: 11 November 2019
/
Accepted: 24 November 2019
/
Published: 26 November 2019
(This article belongs to the Section Air Quality)
Abstract
:Non-methane hydrocarbons (NMHCs) from four sampling sites in Lanzhou, a petrochemical industrialized city in northwest China, was sampled by stainless steel canisters and measured by gas chromatography–mass selective detection/flame ionization detection (GC–MSD/FID) in May and June of 2017. Based on these results, the contributions of NMHCs to the ozone (O3) and secondary organic aerosols (SOA), differences in tracer ratios, and source apportionment by principal component analysis (PCA) were analyzed. The results showed that the total NMHCs concentration in Lanzhou was 48.4 ± 48.3 ppbv (parts per billion by volume) during the observation and it was higher in May (78.6 ppbv) than in June (37.8 ppbv); the highest NMHCs concentration was observed in industrial areas. Alkanes were the dominant group at all sites in Lanzhou and account for more than 60% of the NMHCs, while isopentane, n-butane n-pentane, propane and ethane were the major compounds. Additionally, the NMHCs in Lanzhou have made great contributions to O3 and SOA generation and the S1 site of the industrial area contributed the most to both of them. Propene, toluene, ethylbenzene and n-pentane were found to be more reactive with relatively high contributions to ozone formation. Aromatics and high carbon alkanes were major contributors to SOA formation potential (SOAp) (i.e., toluene, m,p-xylene, dodecane, undecane, n-tanane, benzene and ethylbenzene) in Lanzhou. Based on the specific volatile organic compounds (VOCs) ratio method and the PCA modem, the observation sites in Lanzhou were greatly affected by the surrounding industrial areas. The sources consisted of petrochemical industry, vehicle emissions, solvent usage and combustion sources, which contributed to 33.9%, 31.6%, 19.2% and 7.9% of the total monitored NMHCs, respectively. From different sites, though the influence of regional transport was not very significant on the whole, it also affected the NMHCs of nonindustrial areas based on the ratio of xylene to ethyl-benzene (X/E), especially the S4 site; vehicle emission was less important compared to sources from petrochemical industries in S1, as characterized by relatively higher toluene to benzene (T/B) ratios. However, vehicle emission has significant influence on NMHCs in S4. Overall, local emissions are the main source of NMHCs in Lanzhou and the petrochemical industry has a great influence on the distribution of NMHCs in the whole region.
1. Introduction
Tropospheric photochemical pollution and haze pollution are principal environmental issues which pose great challenges to the development of many cities and regions in China. Volatile organic compounds (VOCs) play a vital role in formation of ground level ozone (O3) and secondary organic aerosols (SOA) associated with urban air quality [1,2,3]. Non-methane hydrocarbons (NMHCs) are an important part of VOCs. As significant air pollutants in the urban atmosphere, NMHCs have become severe environmental problems in China, causing negative impacts on human health, air quality, climate change, as well as natural ecosystems [4,5]. NMHCs are important precursors for secondary pollutants, such as O3 and SOA [6]. The reaction of NMHCs with OH, O3, and nitrogen oxides (NOx) generates SOA and also aggravates ground level O3 pollution in the presence of sunlight, linked to severe photochemical pollution and haze pollution events in China [3,7,8]. Some NMHCs species, such as benzene and toluene, could cause direct and potential hazardous effects on human health and the ecosystem because of their toxicity [9,10]. Some of them are carcinogenic. The emissions of NMHCs into the atmosphere are anthropogenic sources (solvent usage, biomass burning, vehicle combustion, etc.) [11] and natural sources (soil, ocean, vegetation, etc.) [12]. The spatiotemporal distribution of NMHCs in the atmosphere is closely related to the emission characteristics of sources, meteorological conditions and characteristics of atmospheric chemical reactions [6]. Therefore, estimation of the O3 and SOA formation potential of anthropogenic NMHC emissions, and implementation of effective VOC control strategies based on the estimation are essential.
In recent years extensive studies have been conducted to clarify the spatial and temporal differences of concentration and possible sources of NMHCs, including areas like Beijing [13], Tianjin [14] and Shanghai [15,16]. However, most studies of NMHC chemistry in China have focused on either remote sites or megacities, mostly in the Pearl River Delta (PRD) region, Beijing–Tianjin–Hebei (BTH) region, or Yangtze River Delta (YRD) region. There have been very few studies of the ambient NMHCs in the northwest of China, such as Lanzhou, where there are growing industrial cities.
Lanzhou, located in the northwest of Gansu Province, China, is an industrial center in the interior of western China. It is situated in a narrow valley basin in a mountainous region with a high altitude (1520 m above sea level). This typical valley-mountain topography yields calm winds with annual frequency of 55%, weak dispersion, and strong inversion throughout the year [17]. The unique topography, together with its petrochemical industry and vehicle emissions (1.017 million cars in 2017), makes it a typical “basin” of O3 pollution in summer [18], trapping air pollutants more easily. In the late 1970s, the first field evidence of photochemical smog in China was reported in Lanzhou, which has drawn great attention to ozone contamination nationwide [17,19]. In recent years, the deterioration of air quality in Lanzhou has gradually become more serious due to petrochemical industries in western suburb of the city and heavy traffic, which makes Lanzhou one of the cities most contaminated by air pollutants in China, such as photochemical smog. As one of the important preconditions of ozone and SOA, NMHCs also have aroused wider concern there. Recently, studies of NMHCs in Lanzhou have increased, but mostly from the perspective of photochemical pollution mechanisms [19] and climatic factors [20]. Moreover, research was basically limited to a specific point, and there are few studies that engaged in simultaneous monitoring of multiple points at the same scale [21]. Little is known of the spatial distribution of NMHC concentration and their contributions to O3 and SOA formation within each area of Lanzhou, where complex sources from petrochemical industries exist.
The rapid increase in motor vehicle population in the past decade might alter the emission patterns and sources, although the photochemical smog resulted from large-scale petrochemical industries in western suburb of Lanzhou in 1970s. In this study, field measurements of NMHCs were carried out to survey concentration, ozone and SOA formation potential, and source analysis of NMHCs in Lanzhou city. The samples of NMHCs were collected by SUMMA canister and analyzed by Entech 7100 pre-concentration, Agilent 7890 Gas Chromatography and 5975 Mass Spectrometry. Overall, this study reveals the concentrations and variation of VOCs in May and June, the secondary pollutants (O3 and SOA) formation potential of NMHCs, and the sources of NMHCs in Lanzhou.
2. Experiment and Methods
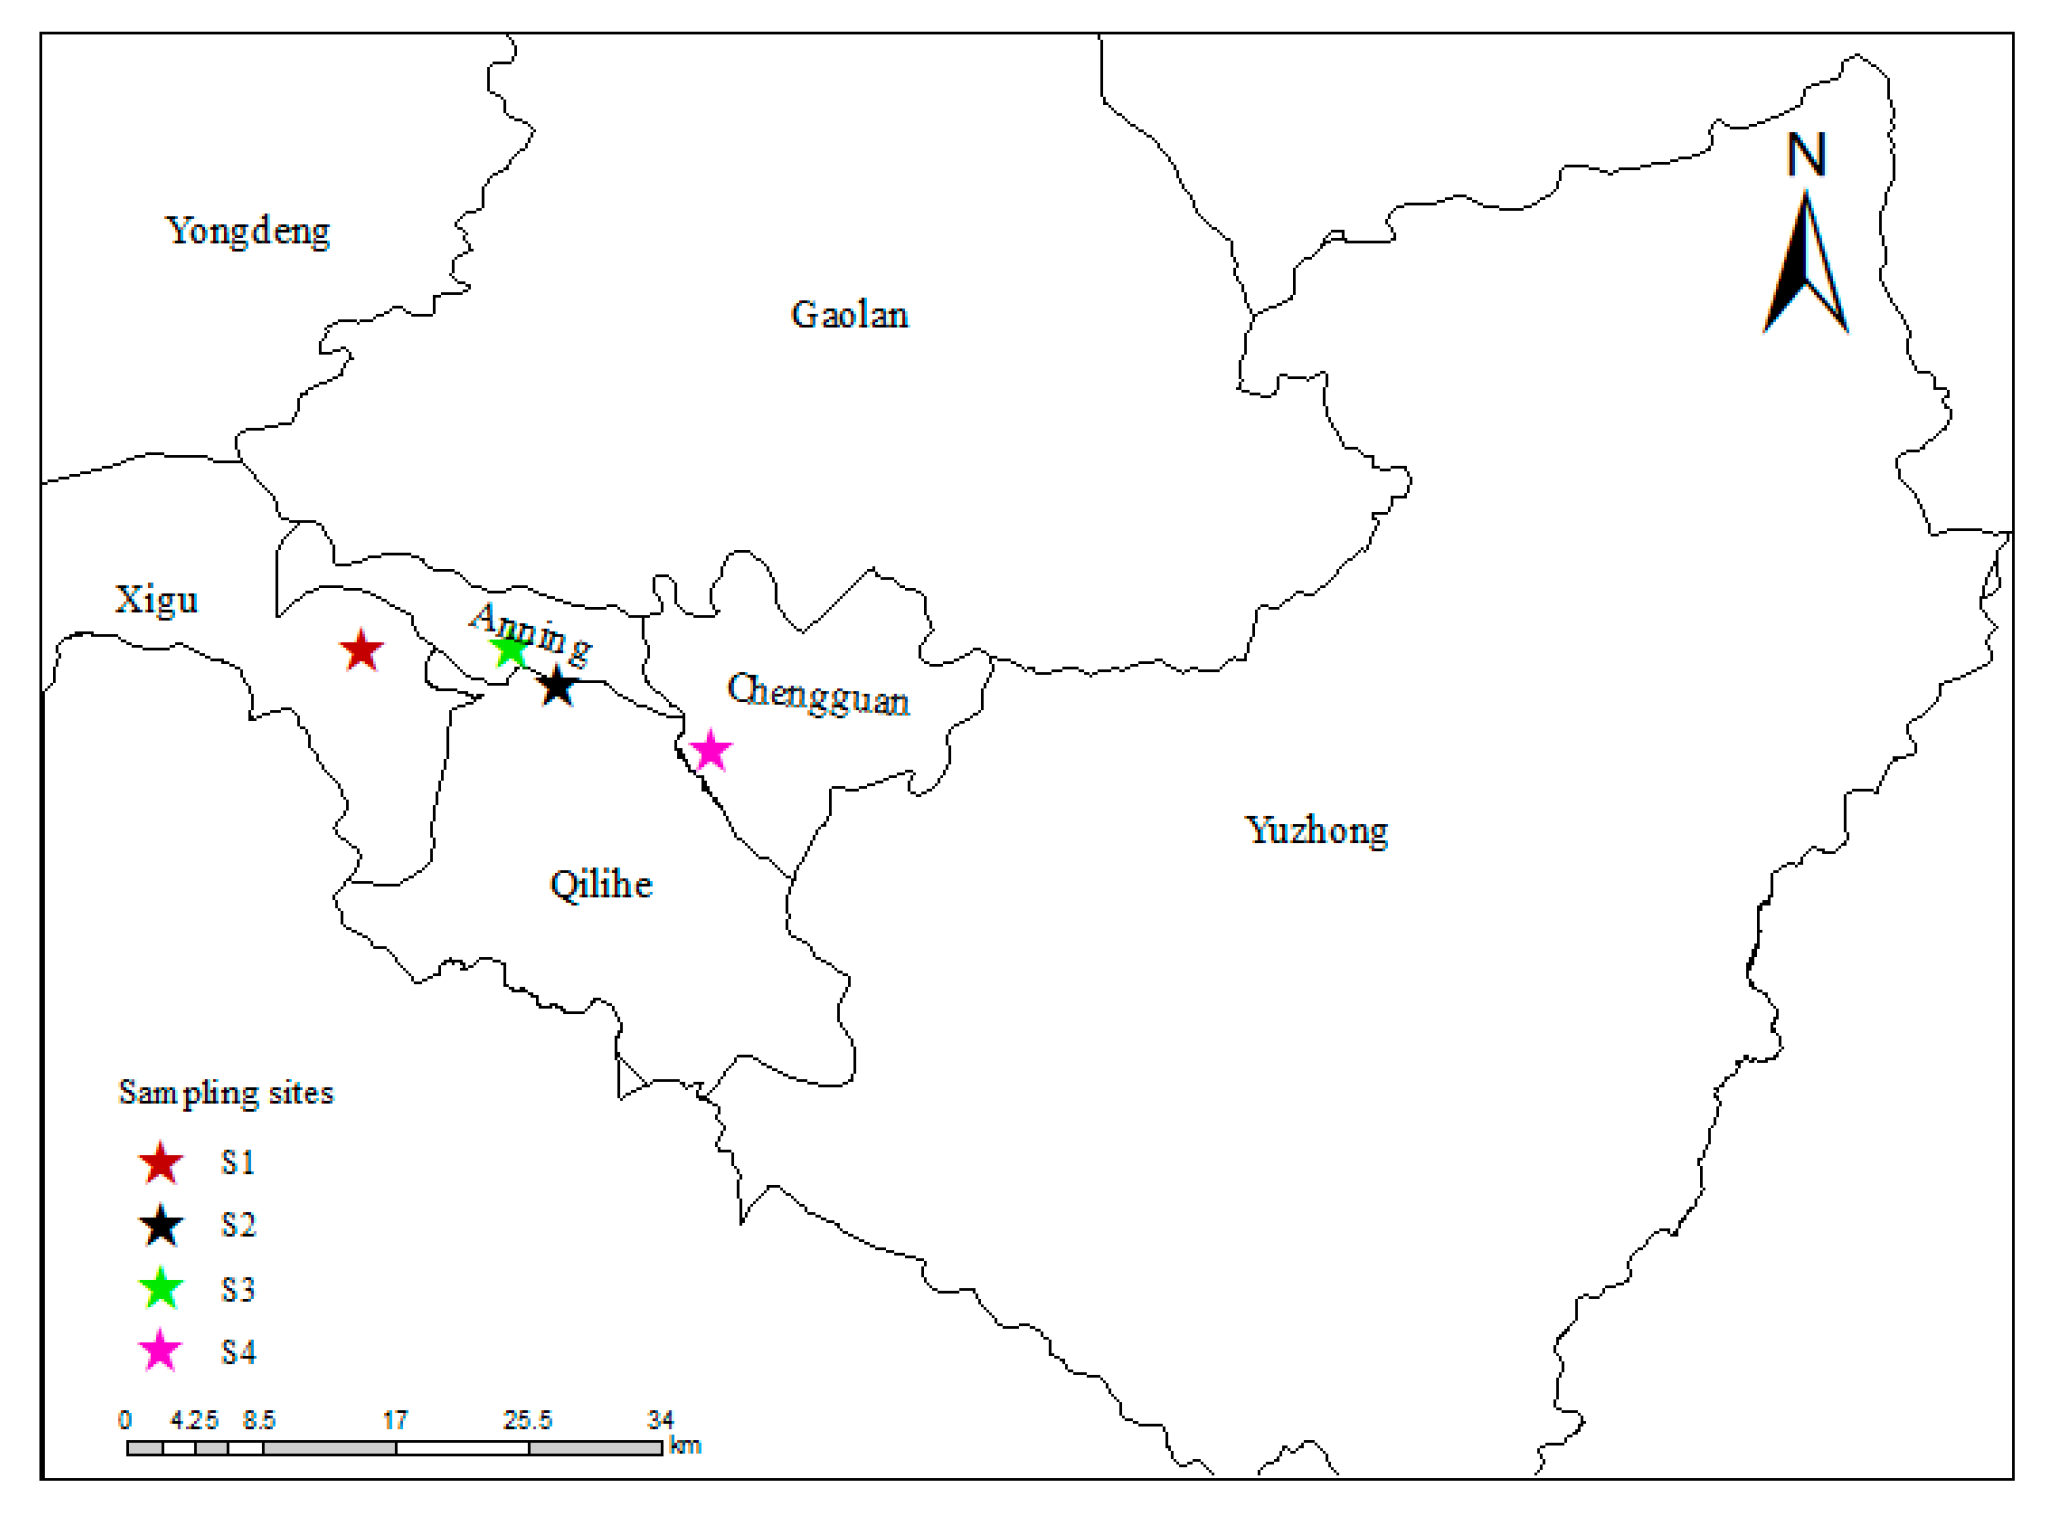
2.1. Sampling Sites Description
Lanzhou is a large city of over 3 million people and an industrial center in the interior western China. It is situated in an arrow valley basin in a mountainous region with a mean altitude of 1520 m above sea level. In this study, we conducted measurement campaigns at four sites (shown in Figure 1). The first site (S1) is located in Lanyuan hotel in Xigu, the west suburb of the city with quantities of heavy petrochemical industry. This area is surrounded by many petrochemical plants and chemical industries within 2 km, which is a typical industrial area. The second site (S2) is located in Anning district of Lanzhou, a residential area. Site S2 is less than 5 km from the industrial area of Xigu. The third station (S3) is situated in Qilihe district, which is in a residential area. There are no large-scale pollution sources in S3. And the last site (S4) is located in the environmental protection agency of Lanzhou in Chengguan district, which is in a mixed functional area of commerce, transportation and residence. All the sampling points were approximately 25–30m above the ground.
2.2. Sample Collection and Analysis
The samples of NMHCs were collected by SUMMA canister and analyzed by the Gas chromatography–mass spectrometry (GC–MS) system. The sampling campaign was conducted in May (24–26 May 2017) and June (27–29 June 2017) at Lanzhou. Sampling was conducted at 07:00~09:00, 12:00~14:00 and 19:00~21:00 each day. Because of experimental conditions and funding, the sampling campaign in the S2 site was only conducted in June (27–29 June 2017). Samples were collected in SUMMA canisters, specially designed stainless steel flasks. The inner surfaces of the flasks were electro-polished and silonite-coated to avoid gas adsorption. After sampling, all samples were delivered to the laboratory for chemical analysis within a week.
The samples were analyzed by preconcentrator (Entech 7100) and GC-MS system (Agilent 7890A GC-5975CMS) [22]. With the Entech 7100, samples were concentrated using a glass bead trap that was maintained at −165 °C with liquid nitrogen. The trapped VOCs were then desorbed at −40 °C and the majority of CO2 was removed. Then, the secondary trap was heated to transfer target VOCs to a third cryofocus trap at −170 °C. After the concentration step, the trap was rapidly heated, and VOCs were transferred to the GC-MSD/FID system. The chromatographic conditions were as follows: a DB-5 column (60 mm × 0.25 mm × 0.25 μm) was used with the GC oven temperature program. The GC oven temperature was programmed to 35 °C initially, which was held for 3 min; it then increased to 120 °C at 5 °C/min and then to 250 °C at 10 °C min, where it was held for 20 min. The MSD was used in selected ion monitoring (SIM) mode, and the ionization method was electron impacting (EI, 70 eV) with a source temperature of 220 °C.
Target compounds were identified based on their retention times and mass spectra, and quantified by external calibration methods. C4–C10 hydrocarbons were determined based on mass selective detection (MSD) signals, while C2 and C3 hydrocarbons were determined based on flame ion detection (FID) signals. The calibration standards were prepared by dynamically diluting the 100 ppbv (parts per billion by volume) PAMS (Photochemical Assessment Monitoring System) standard gas (1 ppm, Spectra, USA) to 0.5, 1, 5, 15, 50 and 100 ppbv. The calibration curves were obtained by running the five diluted standards, plus humidified zero air, the same way as the field samples. The concentration–response (peak area) correlation coefficients were 0.992–0.999. The analytical system was checked daily with humidified zero air to ensure that it was clean, and then a one-point (typically 1 ppbv) calibration was performed before running air samples. If the response was beyond ±10% of the initial calibration curve, recalibration was performed. The measurement precision was determined by repeated analysis of a standard mixture (1 ppbv) seven times, and controlled within 5%, respectively. In all, 56 species (as shown in Table 1) were identified and measured in this study. The sum of these 56 species was defined as the total VOCs in this study.
2.3. Quality Control and Quality Assurance
Prior to sampling, all the canisters were cleaned at least twenty times by repeatedly filling and evacuating them with humidified zero air. After cleaning, all canisters were refilled with pure nitrogen and stored in the laboratory for at least 24 h to check if there was any contamination in them. Additionally, pure nitrogen in canisters was analyzed in the same way as the field samples to ensure that the target NMHCs were not present or were below the method detection limits (MDLs). To ensure the stability of the instrument system, a reference standard (typically 1 ppbv) was injected every day before analyzing the air samples. If the response was beyond ±15% of the initial calibration curve, recalibration was performed [23].
2.4. Meteorological Parameters
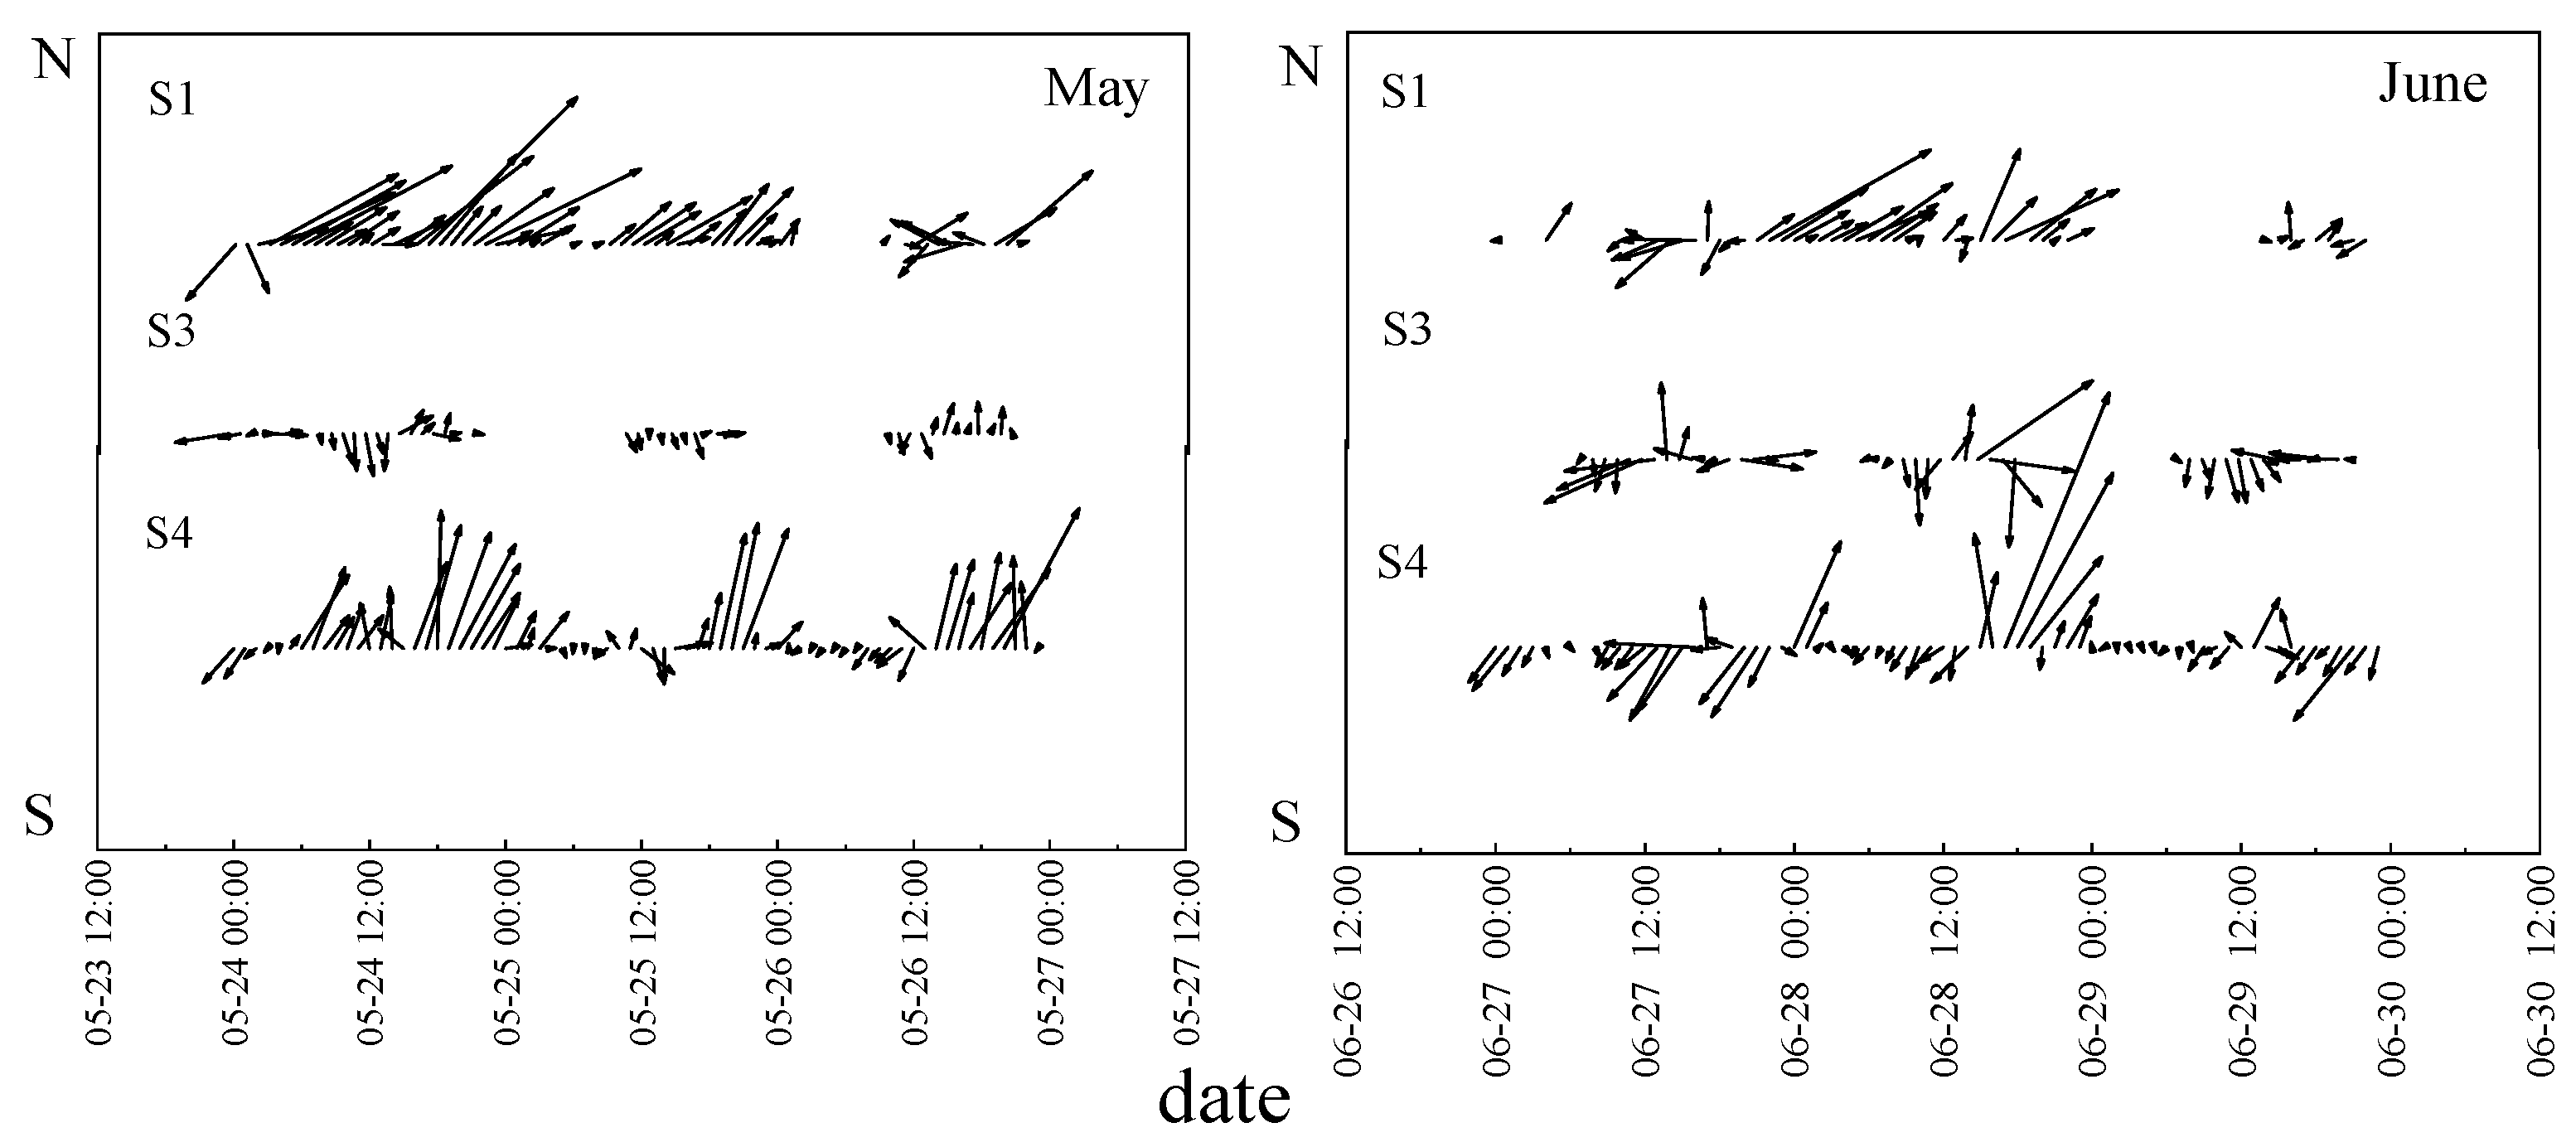
Meteorological parameters, including temperature, relative humidity, wind speed and pressure were collected simultaneously using an automatic meteorological observation monitor (WM07; Kimoto Electric). In this study, results showed that the region has low wind speed in all sampling sites and the average wind speed was less than 1 m/s (Figure 2). The frequency of calm winds was over 60%, which makes the atmosphere in Lanzhou more stable. Therefore, we ignored the influence of meteorological conditions during our study.
3. Results and Discussion
3.1. General Characteristics of NMHCs
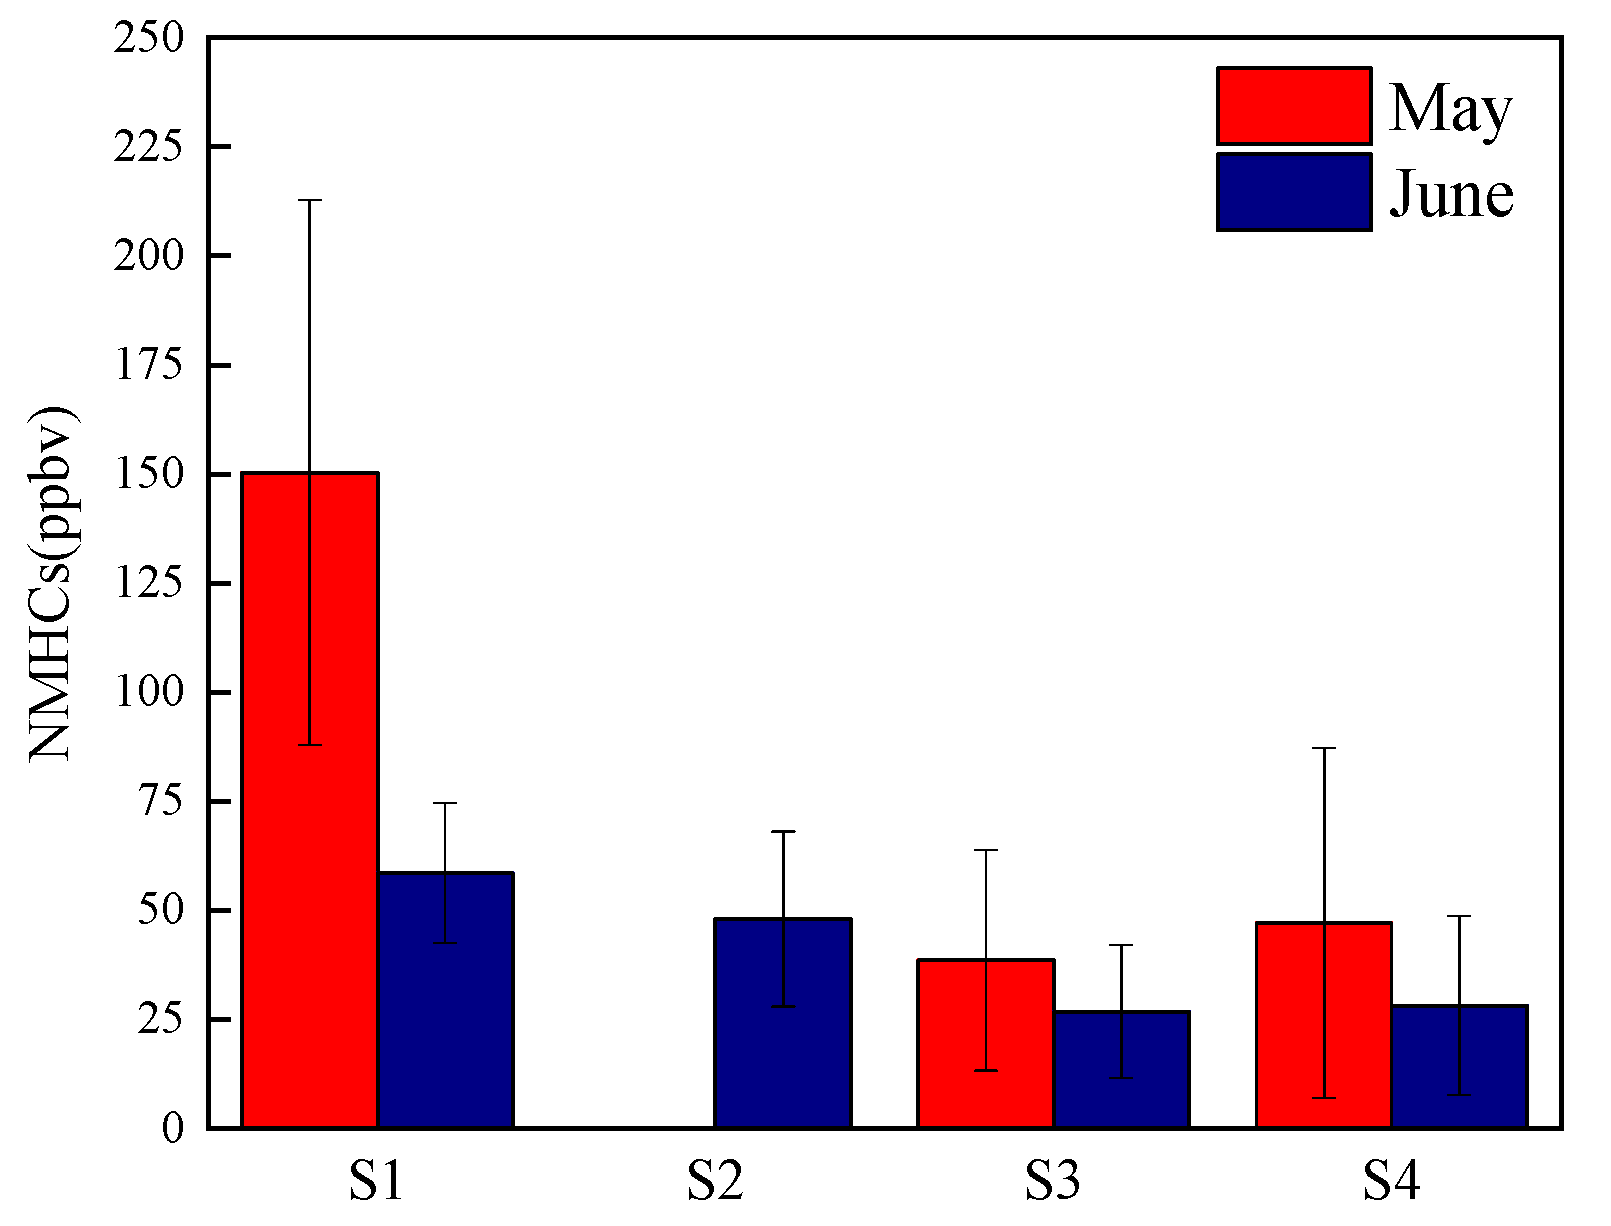
Because of the high standard deviation, all VOC data collected was reported in this study as the geometric mean. Figure 3 shows the statistical results of the concentrations of the NMHCs (the sum of total VOC species) during the observation period. The measured NMHCs could be classified into four categories, including alkanes, alkenes, alkyne and aromatics. The results indicated that the level of NMHCs in Lanzhou was high with the average concentration of 48.4 ± 48.3 ppbv at the four sites. In general, the NMHC level there was higher in May (78.6 ppbv) than in June (37.8 ppbv). The decline in NMHC concentration levels in June depends on several environmental factors [24], including the dilution from increases in the mixing layer depth, removal of NMHCs by particulate matter and dry deposition, chemical removal, especially by OH radicals during summer. The highest concentration of NMHCs was measured at S1, an industrial area, with a mean concentration of 150.3 ± 62.4 ppbv and 58.5 ± 16.0 ppbv in May and June respectively, followed by the S2 site in June 47.9 ± 20.1 ppbv. Xigu district is a typical petrochemical industrial area surrounded by most industries in Lanzhou, which affect the NMHCs concentration at the S1 site obviously. The S2 site is about 5 km away from the industrial area of Xigu District, and the sources of pollution also have a great influence there. The concentration of VOCs at the S4 site in May and June was 47.0 ± 40.12 ppbv and 22.7 ± 20.5 ppbv, respectively; this site is an urban area surrounded by commercial areas and a transportation hub. The S3 site was slightly lower than that of S4 with the NMHC concentrations of 38.5 ± 25.2 and 26.7 ± 15.3 ppbv, respectively. In general, the difference of NMHC emission sources is the key factor determining the distribution of NMHC concentration in Lanzhou. Compared with other cities, the concentration of atmospheric NMHCs in the non-industrial area of Lanzhou was close to those reported in Beijing [25], Nanjing (48.17 ± 16.01 ppbv) [26], Wuhan (23.3 ± 0.5 ppbv) [27] and Shanghai (28.9 ppbv) [28]. However, the level of NMHCs in industrial hubs in Lanzhou (S1 site) during the sampling period was higher than that of many Chinese cities. Previous studies have shown that this variation in average concentrations in locations can be attributed to traffic density, industrial activities, fuel composition and combustion, solvent usage and other human activities, and it is also influenced by local conditions such as terrain and weather [29].
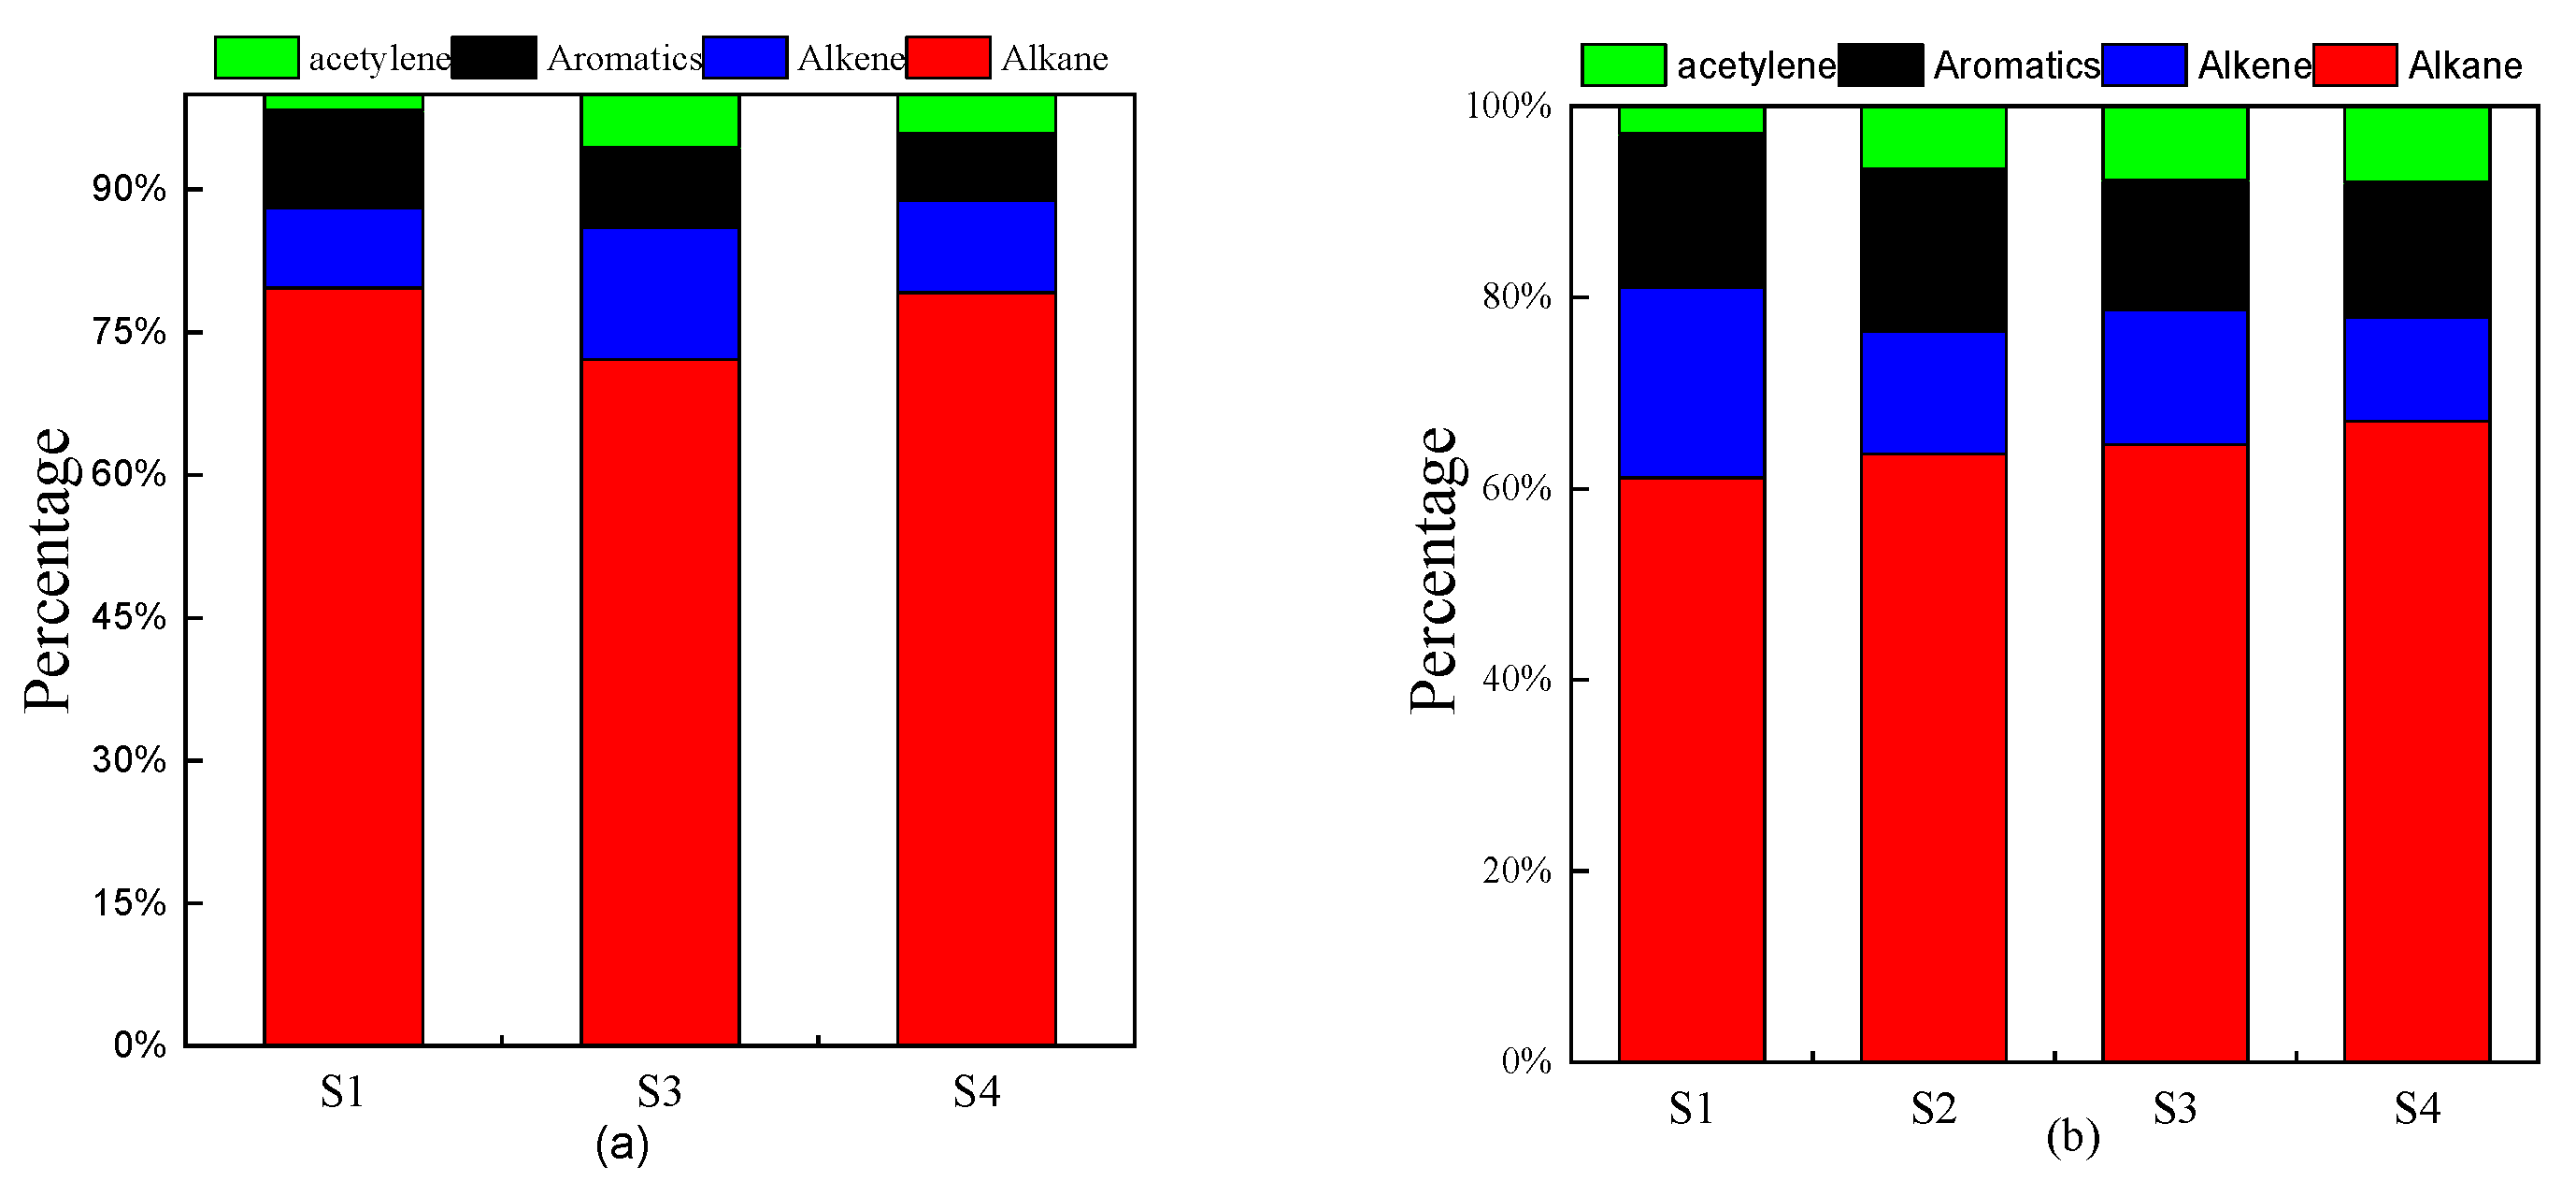
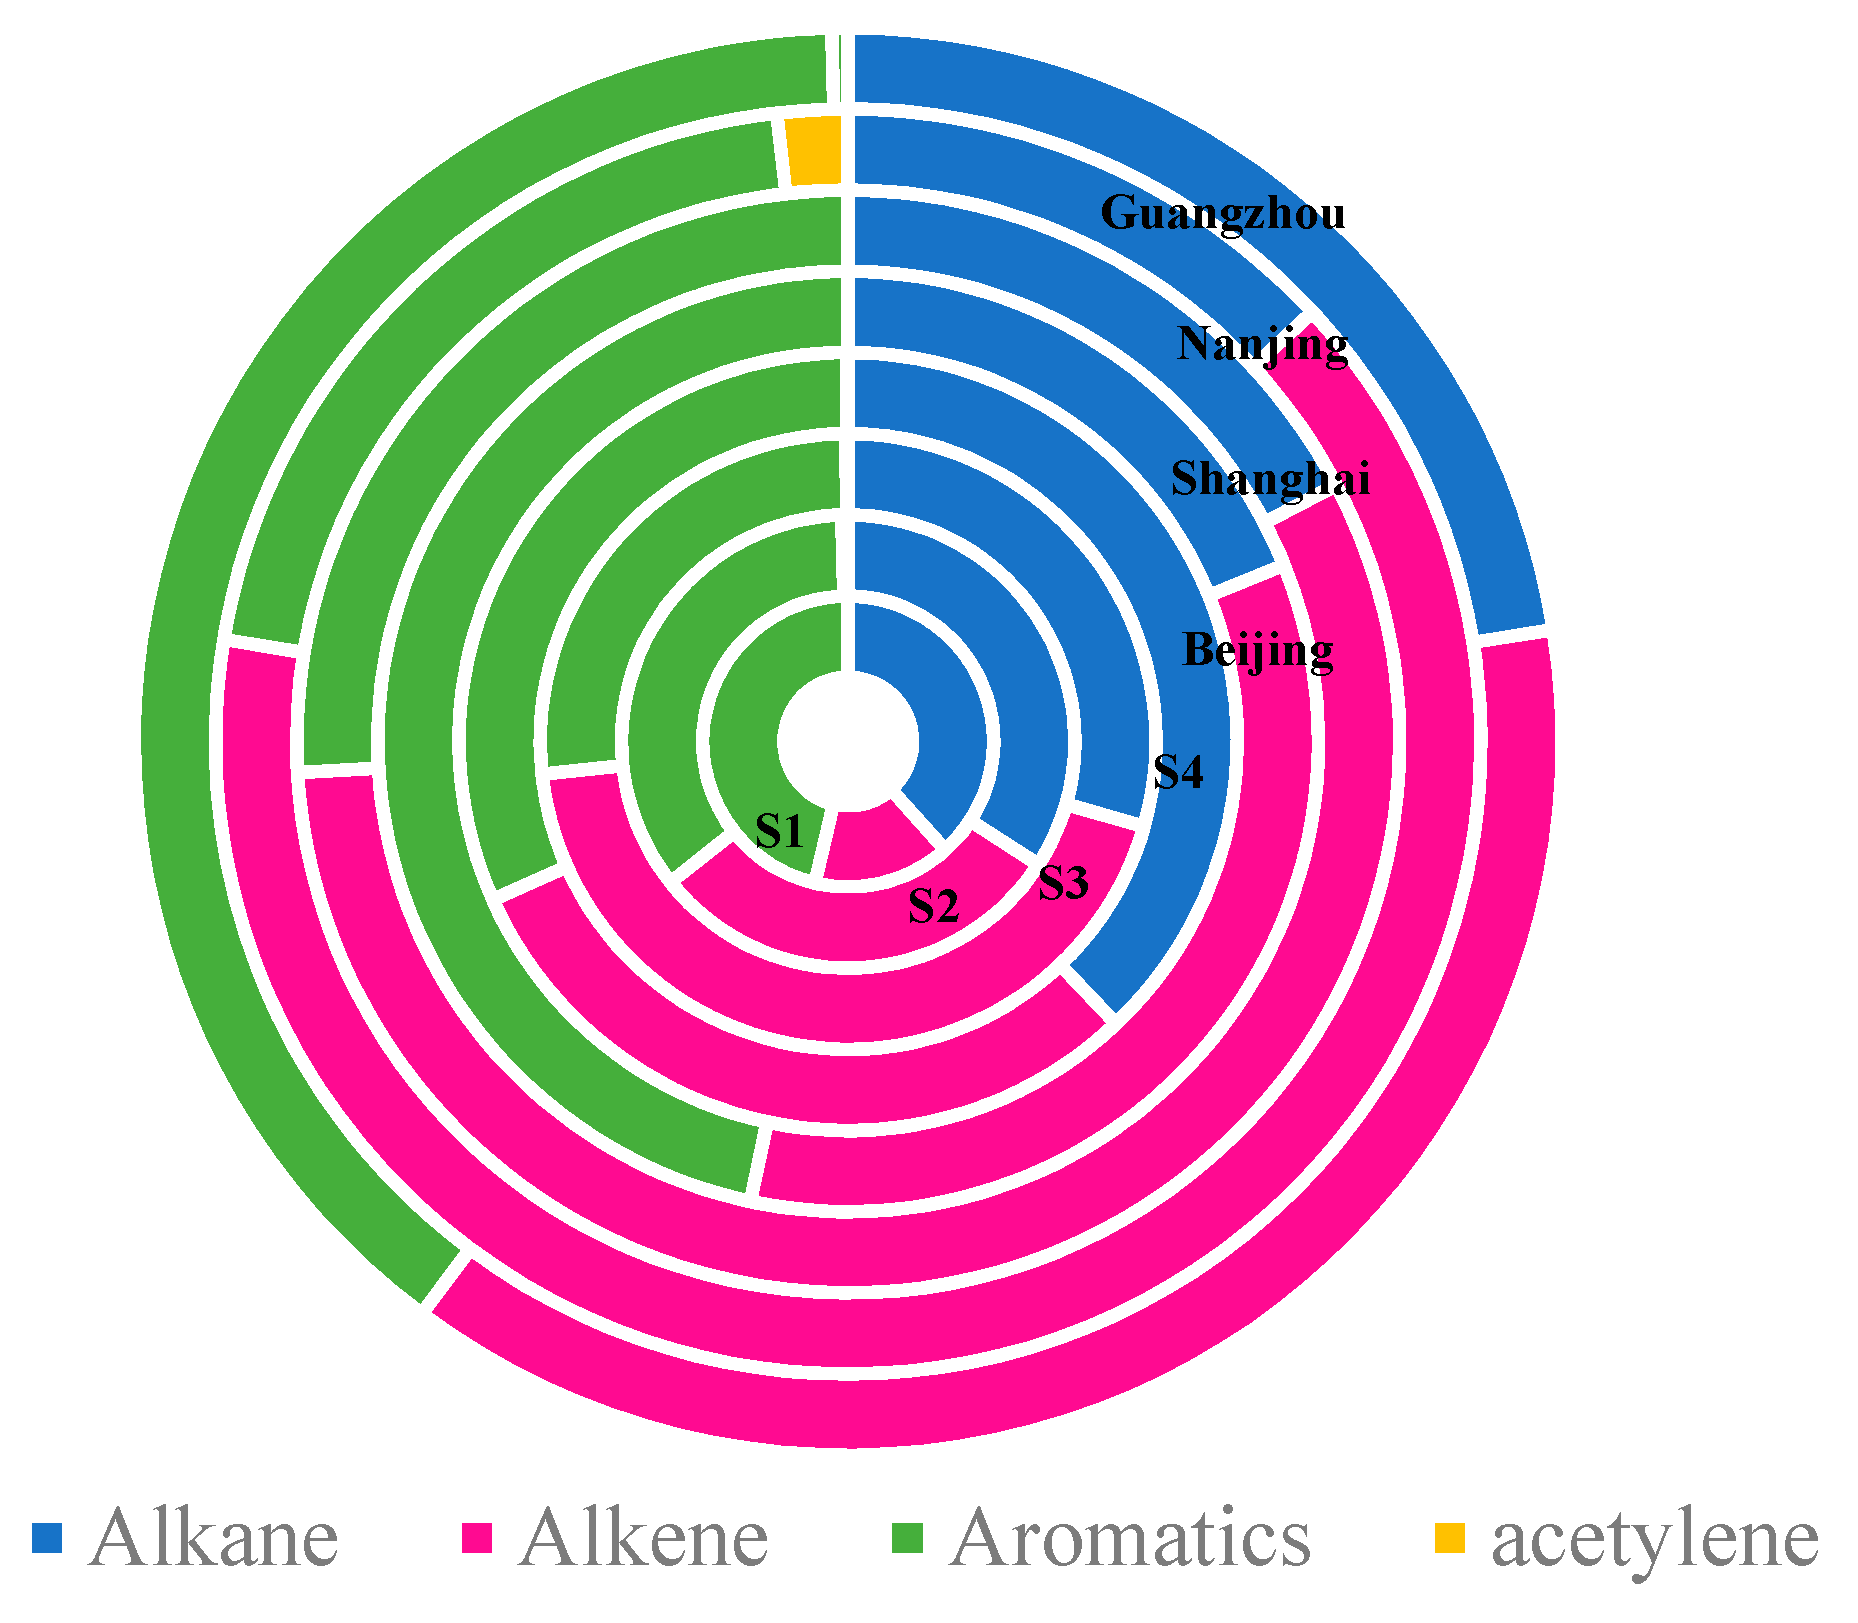
The chemical compositions of NMHCs divided into alkanes, alkenes, and aromatics groups at the sampling sites are similar as shown in Figure 4. Alkanes were the dominant group at all sites during the two sampling periods, especially in May (accounting for more than 70% of the total concentration in Lanzhou). During the observation period in May, alkanes contributed to the most advantage for NMHCs (79.7%), followed by aromatics (10.3%) and alkenes (8.4%). Other sites showed that alkanes > alkenes > aromatics > acetylene; alkanes contributed to an absolute advantage with contribution rate of more than 70%, followed by alkenes, accounting for 13.9% and 9.7% at S3 and S4, respectively. The concentration of the aromatics was similar in these two sites, with the proportions of 8.4% and 7.1% respectively. However, the ratios of NMHCs components in June were a little different from May. Though the ratio decreased, alkane was still the dominant group at all sites, with 61.1%, 70.0%, 63.6% and 67.0% of the total concentration in S1, S2, S3 and S4, respectively. The other components of the ranking were different from each site in June. The second-most dominant group at S2, S3 and S4 was the aromatics, with 14.5%, 17.0% and 14.2% of the total concentration. Alkene pollutants contributed to the total NMHCs more at S1, accounting for 19.9%, followed by aromatics (16.1%) and acetylene (2.9%).
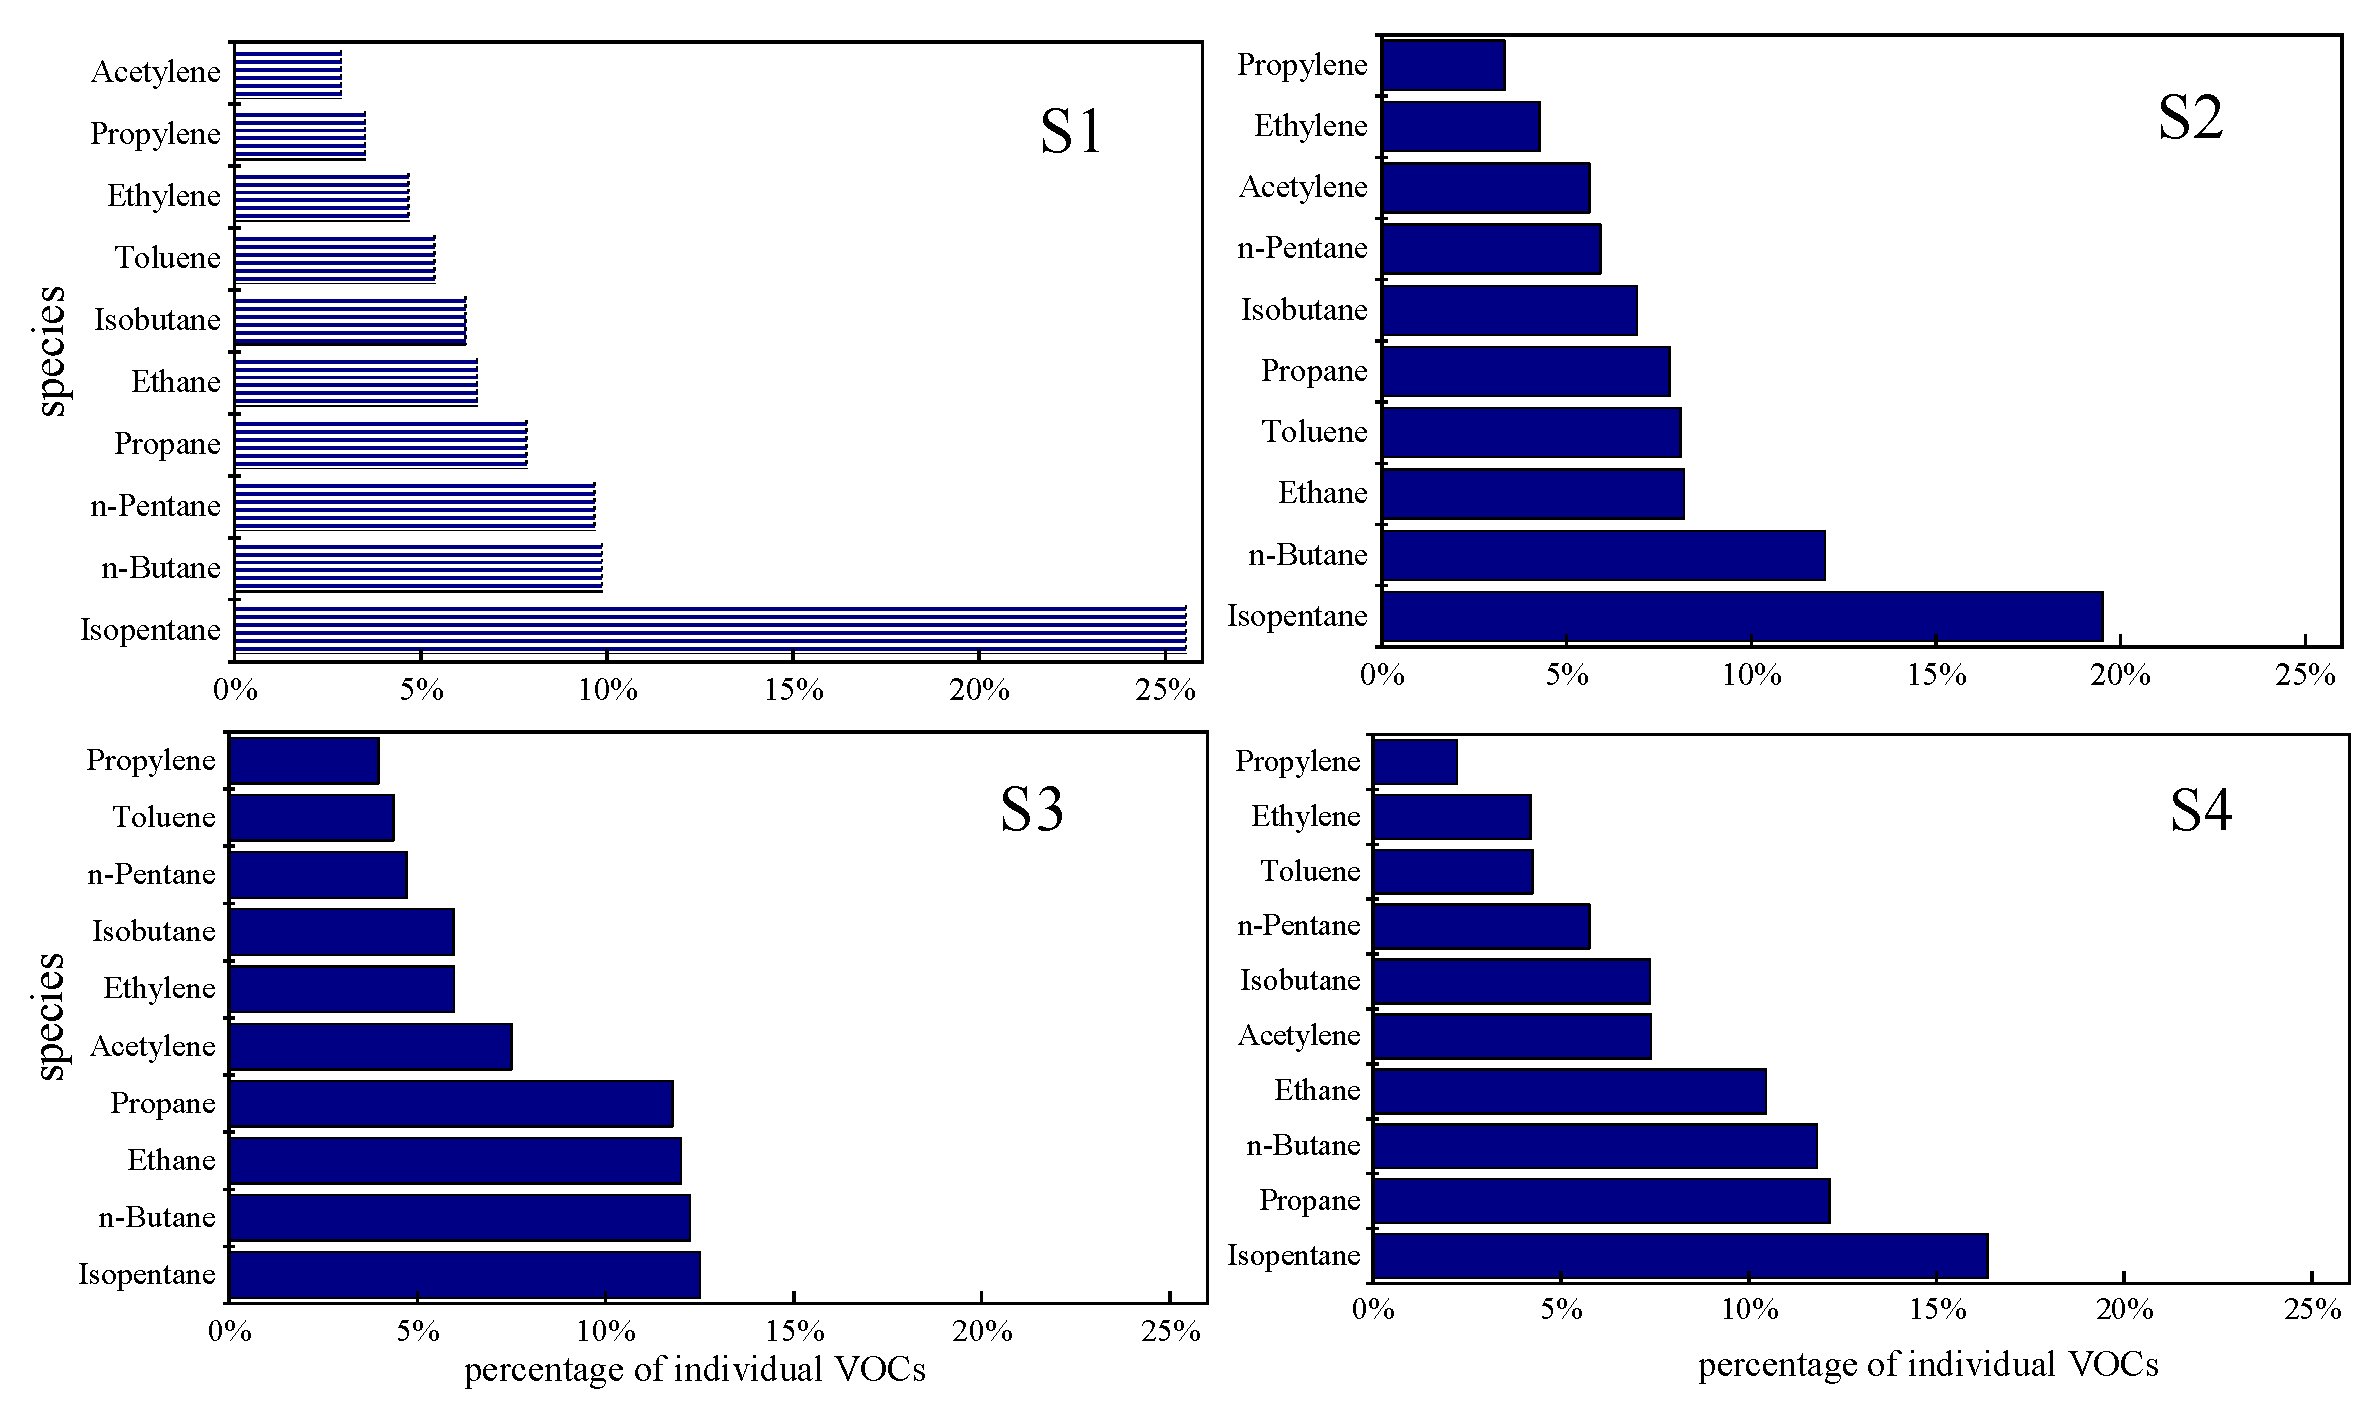
The concentrations of the 10 most abundant species based on the identified NMHCs species are shown in Figure 5. During the sampling period, the most important NMHCs species at all sites were alkane species, such as isopentane, n-butane, n-pentane, propane and ethane. It is noteworthy that isopentane occupied first place in all sites, while propane or ethane always comprised the majority of NMHCs in previous studies, such as in Beijing [2,30] and Shanghai [15]. According to our published data on sources of NMHCs in the same period [31], isopentane is one of the most abundant species in samples from the petrochemical industry, arising from the formation processes of kerosene, gasoline and diesel. As the local pillar industry, petrochemical industrial facilities are the main source of NMHCs in Lanzhou, which have an important effect on the component distribution of NMHCs in such a semi-closed basin. Isopentane in the atmosphere is thus likely to be from the petrochemical industry. The results suggest that the petrochemical industries have evident contributions to the ambient NMHCs concentrations over the whole area in Lanzhou. Besides, the share of acetylene at S4 (7.4%) was much higher than at other sites (Figure 5); acetylene is possibly mainly derived from vehicle emissions in urban areas [32]. Thus the NMHCs at S4 during the sampling period was probably affected mostly by vehicle emissions.
3.2. Ozone and SOA Formation Potential for NMHCs
To effectively reduce O3 and SOA formation in Lanzhou, it is important to identify the major VOC emissions and their transformation species. Thus, it is essential to clarify the role of VOCs by calculating both the ozone formation potential (OFP) and secondary organic aerosol potential (SOAP) values for this area.
3.2.1. Ozone Formation Potential for NMHCs
The maximum incremental reactivity (MIR) method, proposed by Carter (1994) [33], was a good indicator for comparing the ozone formation potential (OFP) of each individual NMHC species, and was defined by the following equation:
where OFP is the ozone formation potential, NMHCi is the concentration of individual NMHCi, and MIRi is the maximum incremental reactivity coefficient of individual NMHCi, which is defined by Carter [33]. In this study, considering the reaction and volatilization in sunlight, the NMHCs sampled at 07:00–09:00 h were used to calculate the OPF, when solar radiation is relatively low.
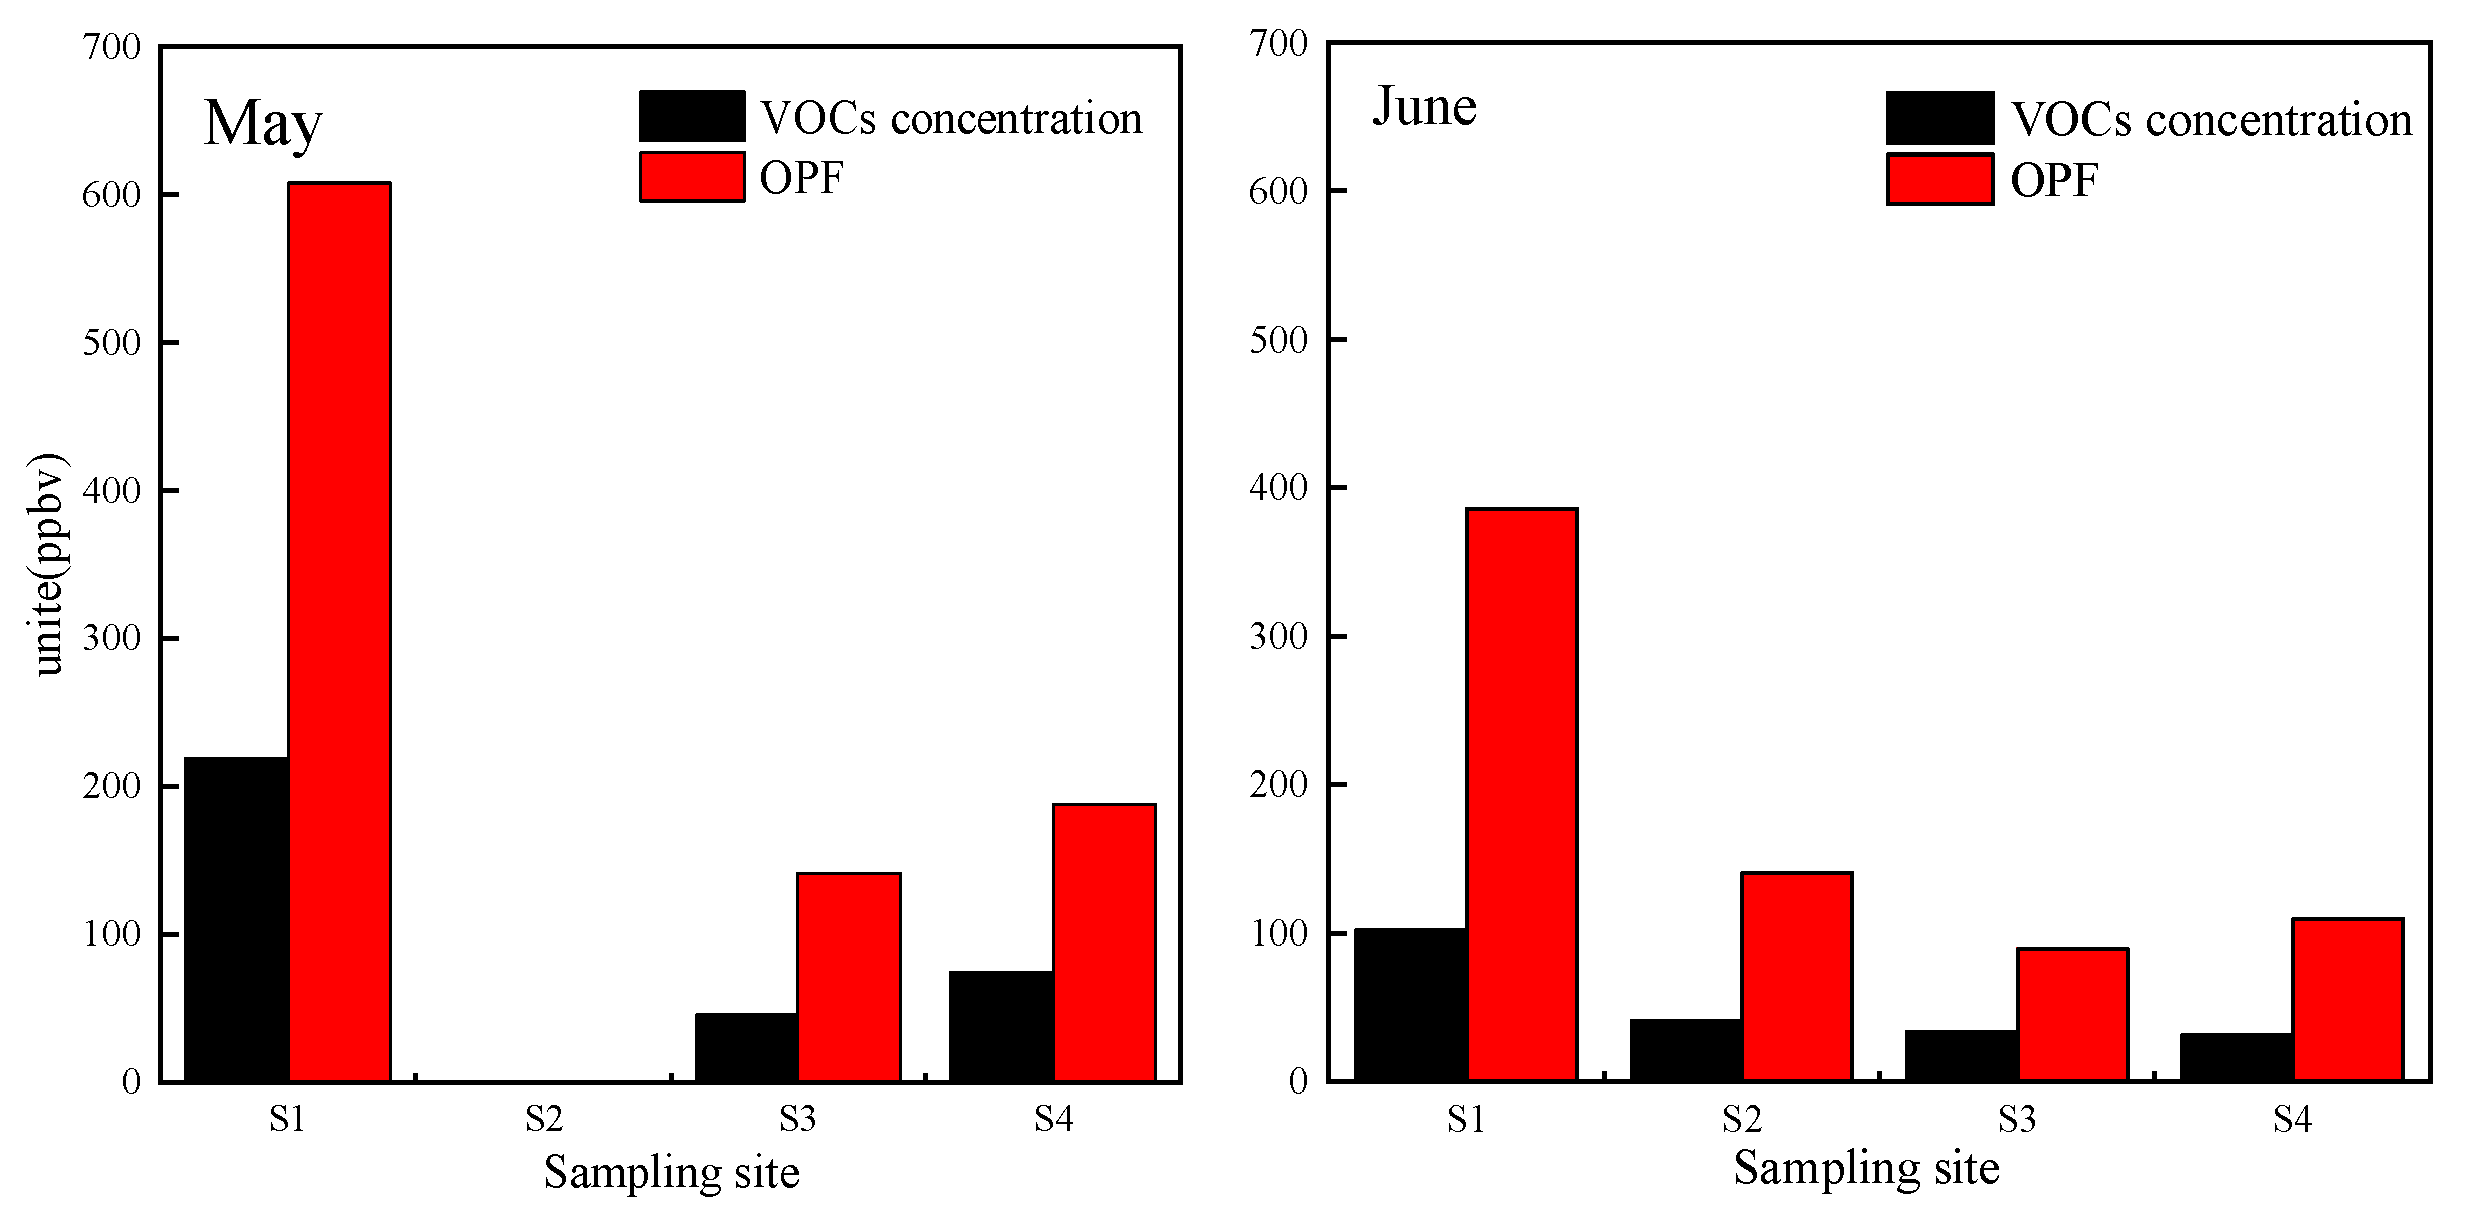
Figure 6 shows the concentration of NMHCs and the value of OFP in Lanzhou during the sampling time. There was a significant variation among OFPs at all sites in the sampling period. The OFP in May was significantly higher than that in June at all sites. Among the four sites, S1 exhibited the highest OFP, followed by S2 and S4. The contribution of NMHCs to OFP was relatively low in S3.
As shown in Figure 7, The OFP in S1 and S2 were mainly from aromatics, accounting for 46.3% and 35.2% of the total OFP, respectively. Followed by alkanes (38.4% and 34.1%) and alkene (15.3% and 30.2%). Meanwhile, the OFP in S3 was mainly from alkene (43.8%), and secondly by alkanes. The OFP in S4 was mainly from alkanes due to high ambient concentration, accounting for 37.9%. Aromatics and alkenes had a similar contribution to OFP in S4 site.
Compared with other cities (Figure 7), the contributions of NMHC groups to the total OFP in Lanzhou were significantly different. The OFP proportion of alkanes varied within a large range (29.5–37.9%), which were much higher than Beijing [2], Shanghai [34], Nanjing [35] and Guangzhou [36]. The results indicate the ozone formation was mainly influenced by aromatic and alkenes in summer. While different from other cities, the OFPs in Lanzhou were also significantly influenced by alkanes. The results can be helpful for policy makers wishing to prevent local ozone formation in different city locations.
As shown in Table 2, the top 10 NMHC species with the highest OFP were mainly from the aromatic and alkene groups. During sampling period, the top ten OFP VOCs species account for more than 77% of total OFP of all measured species in Lanzhou. Ethylbenzene, propene, toluene and styrene were the most important species in O3 formation in this region. It is noteworthy that some alkane species occupied an important position in the top 10 greatest contributions to the total OFP at all sites, such as isopentane, n-pentane, n-butane, which are inseparable from industrial sources [37]. While these species have low reactivity, their high environmental concentration was the main reason for their important contribution to ozone formation in Lanzhou. Propene had the highest OFP in the S2, S3 and S4 sampling sites; its contribution to total ozone formation potentials (OFP) were 15.38%, 15.85% and 12.39%, respectively. Ethylbenzene and propene ranked first and second of the top 10 OFP species during the sampling periods of S1 site.
3.2.2. Secondary Organic Aerosol Formation Potential
As important precursors of SOA formation, NMHCs are of great significance in the research on SOA formation potential. In this study, the parameter secondary organic aerosol potential (SOAP) developed by Grosjean et al. (1992) [38] was used to calculate the contribution of NMHC species to SOA. In their study, 26 NMHC species were considered as precursors for secondary organic aerosols to calculate the SOAP. SOAP reflects the propensity of each organic compound to form SOA on an equal mass-emitted basis. The SOAP could be expressed as Equations (2) and (3):
Here, SOAP is the changes of SOA formation potential; is the initial concentration of individual , μg/m3; is concentration in ambient air; is fractional aerosol coefficient of ; and is the fraction of NMHC reacted. The come from smoke chamber tests of Grosjean [38] and another study [39].
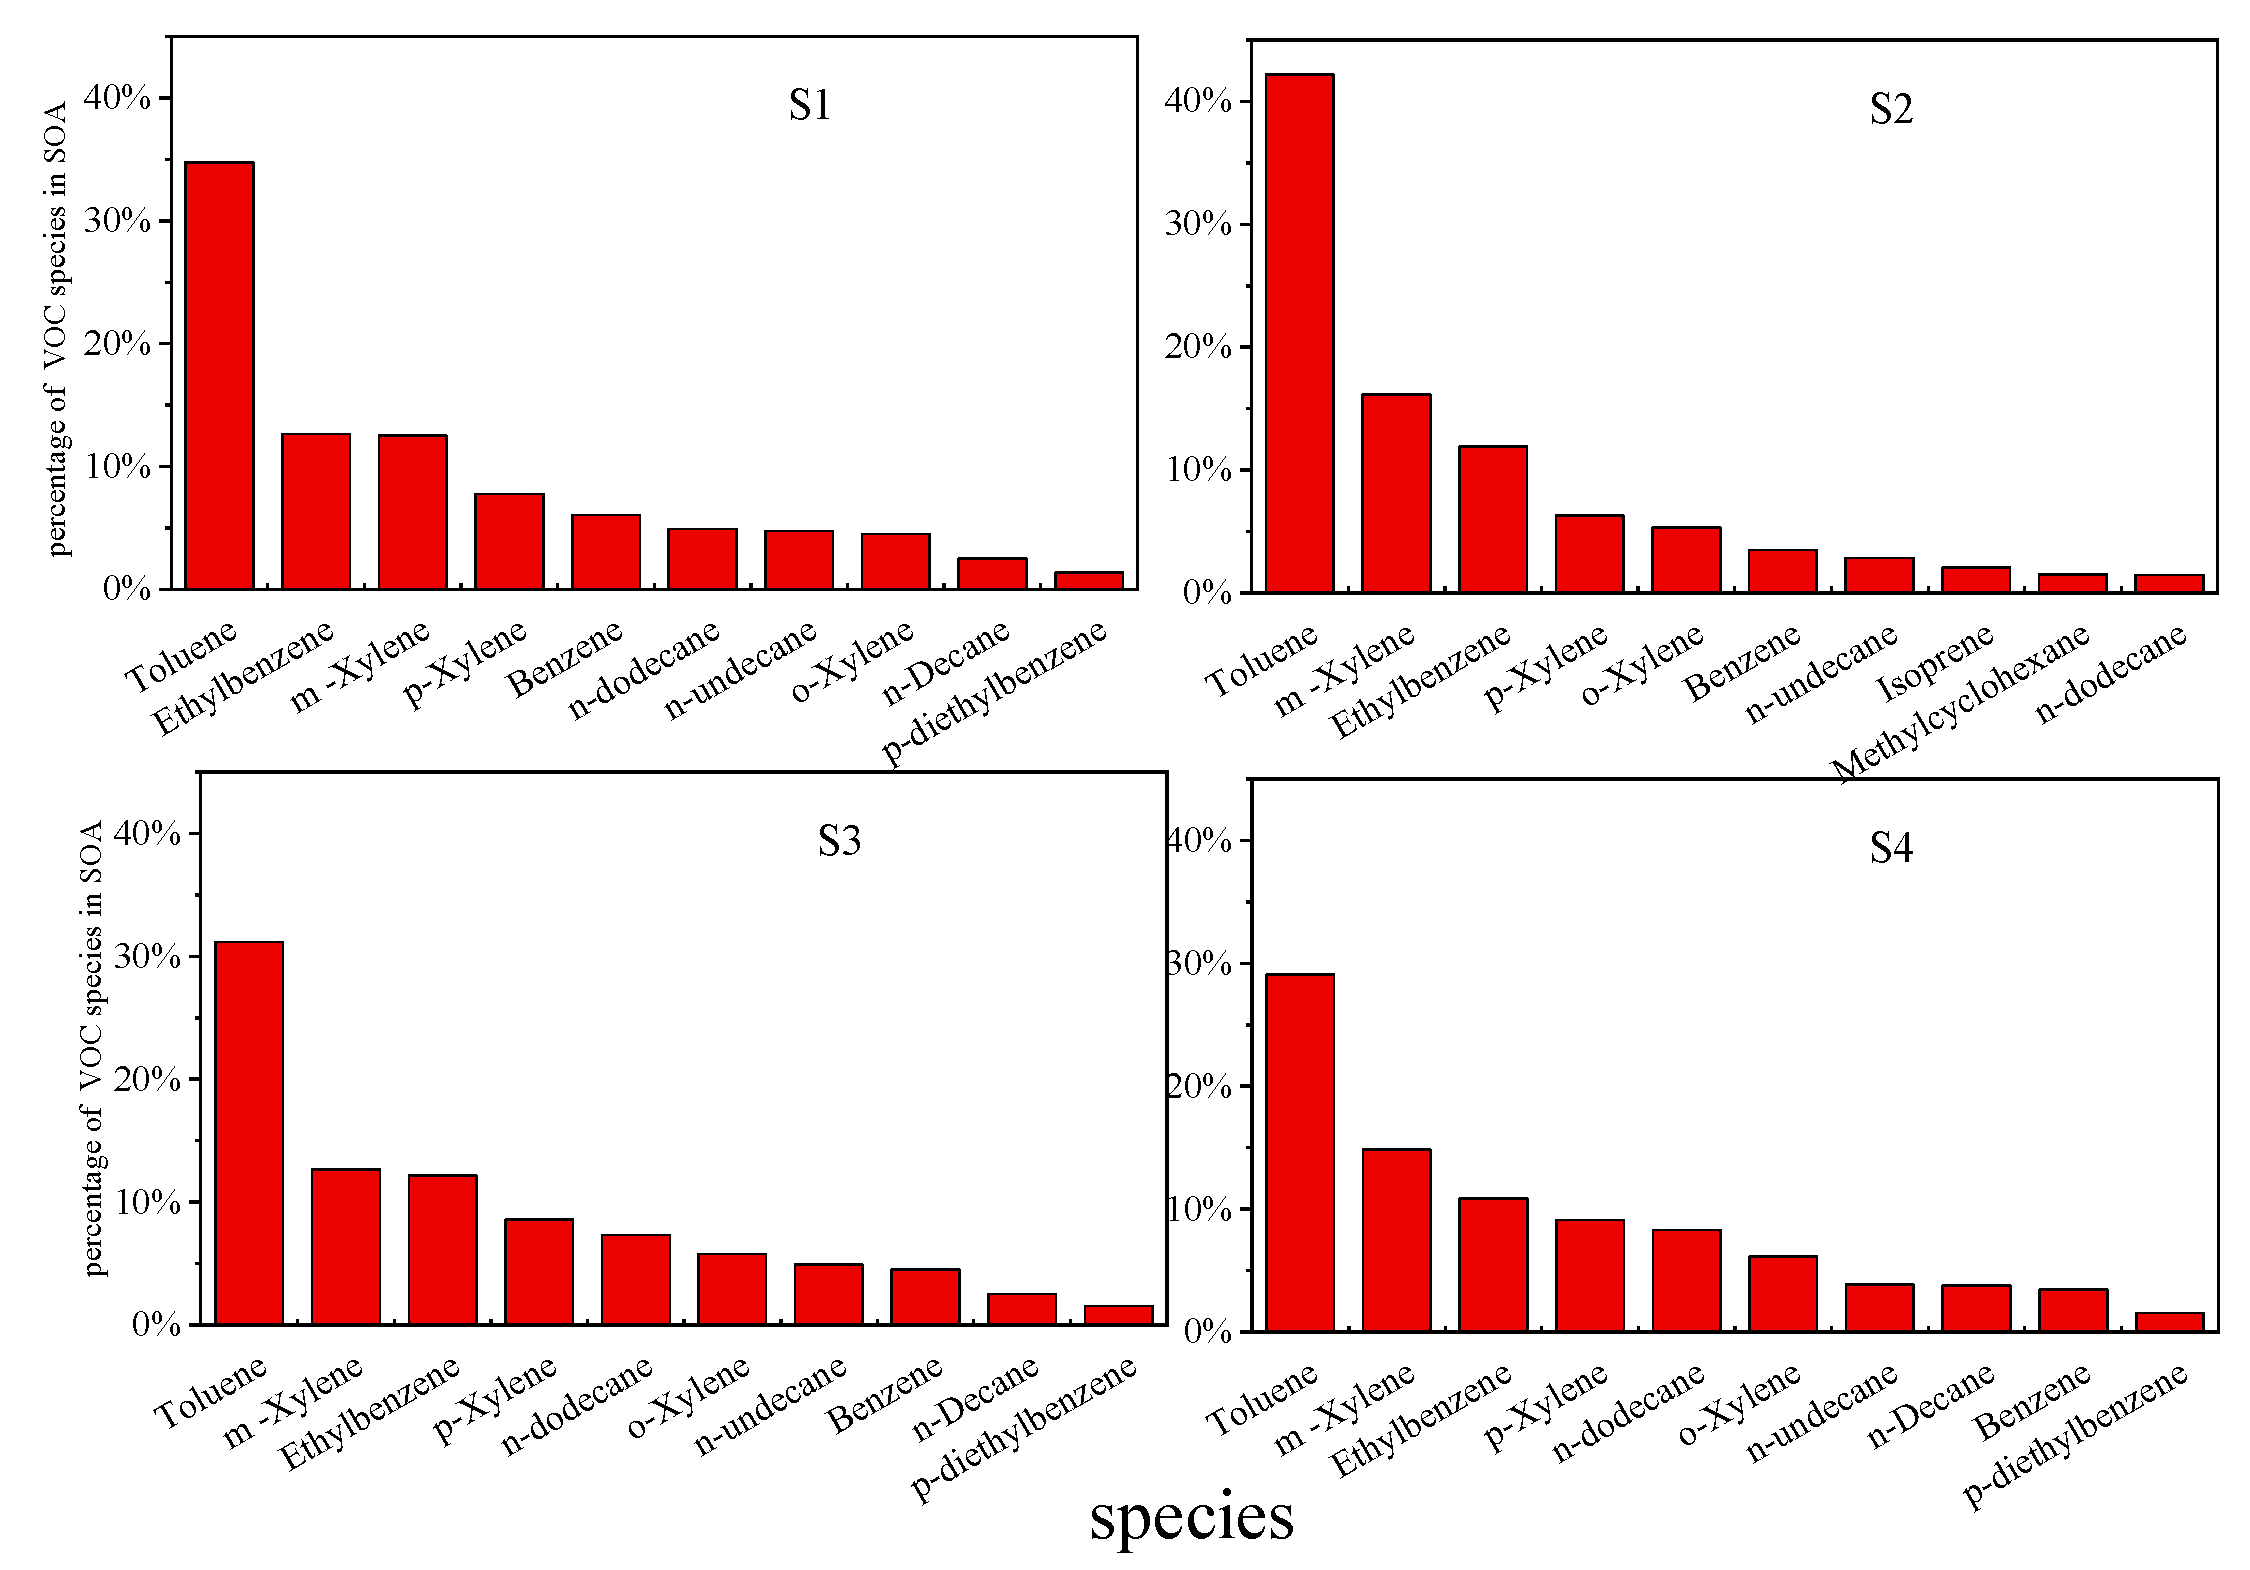
In this study, the average SOAP values were 1.38, 0.99, 0.79 and 0.84 µg/m3 at four sampling sites, respectively. The values of SOAP at our sampling site were much higher than previously reported results from an urban site in Lanzhou for autumn of 2013 [21]. Table 3 suggests that aromatic compounds contribute most to SOA formation, accounting for 84.7%,90.1%,91.7% and 81.3% of total SOAP at S1, S2, S3 and S4 followed by alkanes (14.2%,7.9%,17.0% and 17.8%), especially the long-chain alkanes, such as n-dodecane and n-undecane. The results were similar to most cities in China, such as Beijing [2] and Wuhan [3]. But the contribution of alkanes was more remarkable there due to high emissions and relatively high SOA yields. As we can see (Figure 8), although the order of contribution of NMHCs components to SOA was slightly different from each site, all of them are dominated by high-carbon alkanes and aromatic compounds for the SOA formation. For individual NMHC, the top 10 species contributing most to total SOAP were toluene (29.1–42.2%), m-xylene (12.6–16.2%), ethylbenzene (10.9–12.6%) and p-Xylene (6.3–9.1%), etc, which results from their great emissions and relatively large SOA yields compared with other NMHC species. The most important individual NMHCs were similar to previous results for China, which identified toluene, m-xylene, o-xylene, naphthalene and p-xylene as the five top NMHCs in 2017 [40]. The results highlighted the great SOA formation ability of aromatics and long-chain alkanes as well as the necessity for identifying the sources and the importance of controlling the emissions of these compounds. Actually, the SOAp calculated underestimated the actual atmosphere in this way. One of the reasons for underestimation is that compounds with high SOA formation potentials, such as terpenes and pinene, were not measured [41]. Furthermore, it is still unclear how photo-oxidation mechanisms are involved in SOA production. However, NMHCs do promote more SOA production due to atmospheric oxidation. Therefore, the SOAp of each species could be used to effectively identify the important NMHC species for SOA formation.
3.3. Source Analysis of NMHCs
3.3.1. Ratios of the Specific NMHCs
(1) Local sources and transport from remote sources
Some specific NMHC species are commonly used as indicators of photochemical and atmospheric transport processes [42,43] as well as tracers for emission sources [11], such as the ratio of m,p-xylene to ethyl-benzene (X/E) and the ratio of toluene to benzene (T/B).
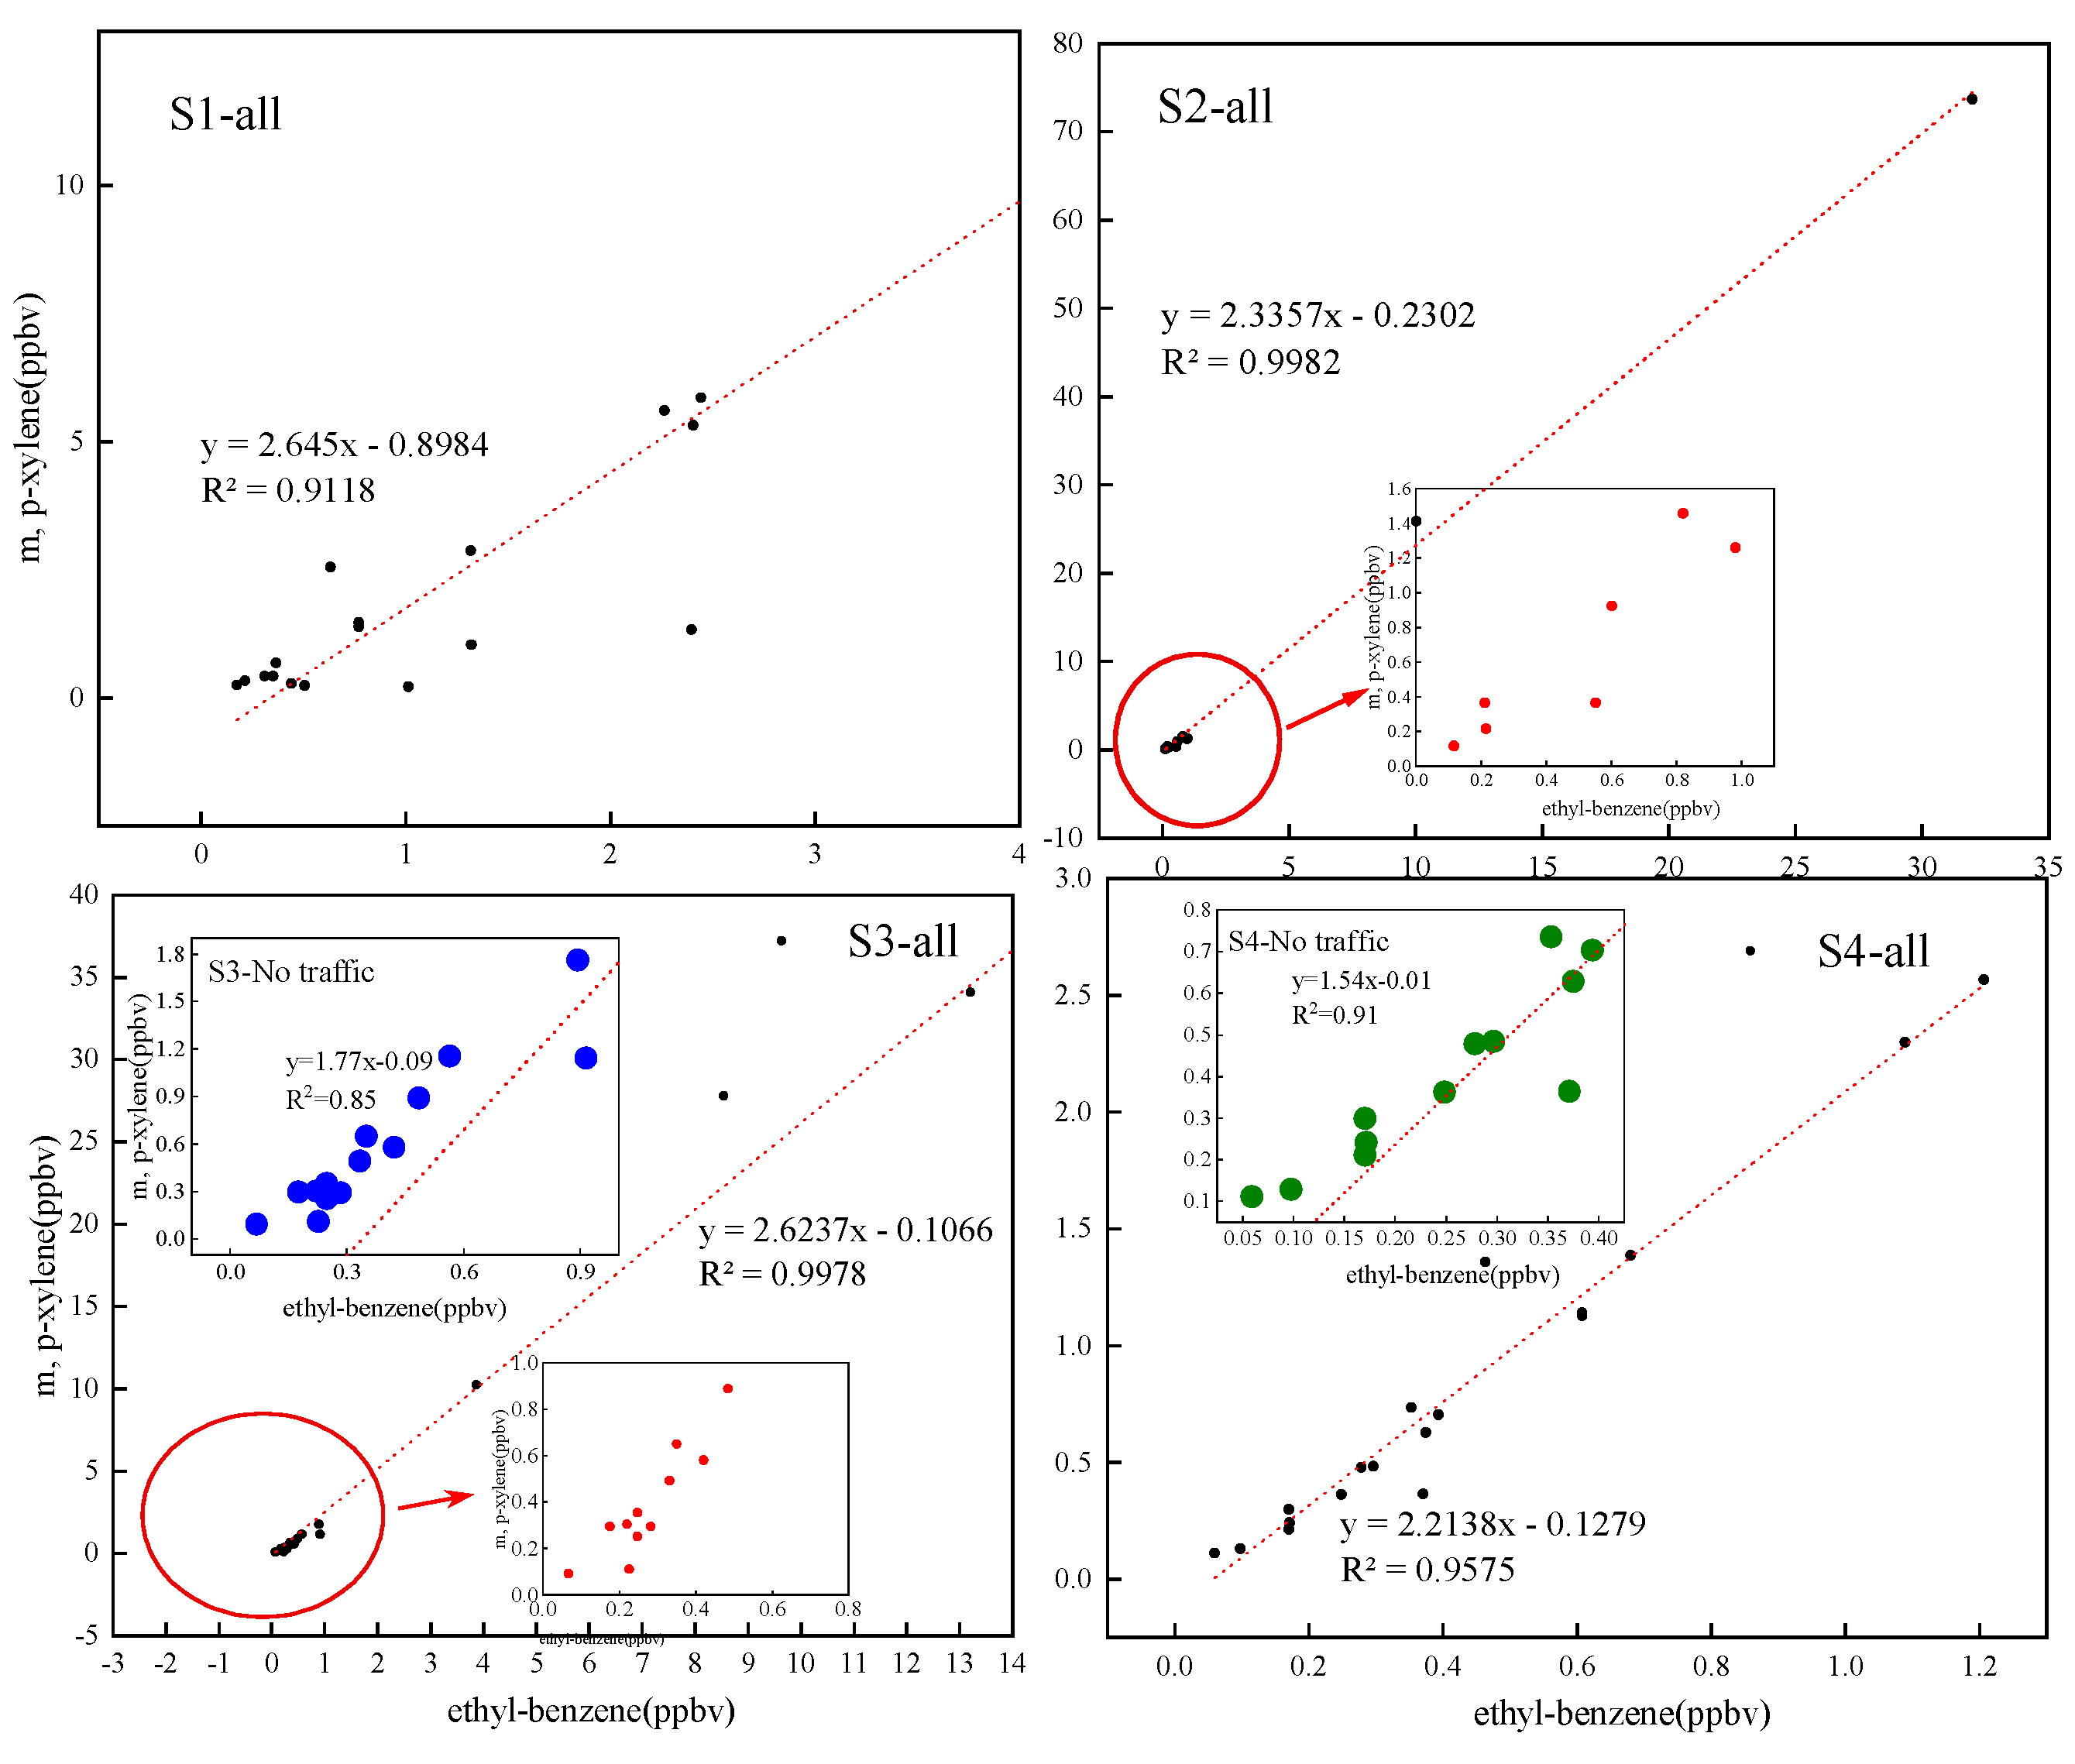
The ratio of m,p-xylene to ethyl-benzene (X/E) is commonly used as an indicator for photochemical reactions [44]. Because they are usually from common sources and the reaction rate constants are different. The ratio becomes smaller as the NMHCs stay longer in the atmosphere, because m,p-xylene is more reactive than ethylbenzene. The atmospheric life times of m,p-xylene and ethylbenzene are 3 h and 8 h, respectively. This means that as the air mass containing NMHCs travels, m,p-xylene will react more rapidly than the ethylbenzene and at the specific distance from the source the ratio will decrease [45].
In this study, high correlations (R2 > 0.85) were found between ethyl-benzene and xylene at all sites during sampling period. The X/E ratio at S1, S2, S3 and S4 was 2.65, 2.33, 2.62 and 2.21, respectively (Figure 9) during the whole observation period, which was significantly higher than those recorded in Beijing (1.13) [2], Shanghai (0.87) [34] and other cities. The results indicate that the Lanzhou would be expected to have a less photochemically aged mix of NMHCs, and the air mass experienced less aging during sampling, reflecting its greater proximity to NMHC sources [44] and obvious influence by local sources around the sampling site.
Considering the S3 and S4 sites are located within the urban area and close to traffic arteries, the influence of vehicle emission sources is significant, whereas the S1 and S2 sites are far from the major traffic area. Whether there is an impact of pollutant transport from industry on VOCs is not clear. Therefore, we analyzed the transportation of industrial sources in the whole Lanzhou region by obtaining the traffic data from the database of S3 and S4 sites that contains traffic congestion hour or period. As shown in Figure 9 (S3—No traffic and S4—No traffic). Regardless of the influence of traffic, the X/E ratio increased from west to east. Furthermore the X/E ratio at S1, S2, S3 and S4 in such circumstances were 2.65, 2.33, 1.77 and 1.54, respectively, indicating that the atmospheric oxidation capacity increased [3]. A fresh air-mass sample was collected from the S1 site, indicating that the contribution of local emissions of industry in this area is larger than other sites. Meanwhile the ratio of X/E implies a slight aged air parcel in S4, suggesting that S4 site is also affected by pollution transport to some extent. On the whole, it is believed that the higher ratio in Lanzhou is possibly due to the non-aged character of the air mass, suggesting that the ratios were strongly influenced by local sources, especially at S1 site. Besides the influence the traffic, pollution transport also influences the S3 and S4 sites.
(2) Traffic emissions and non-traffic sources
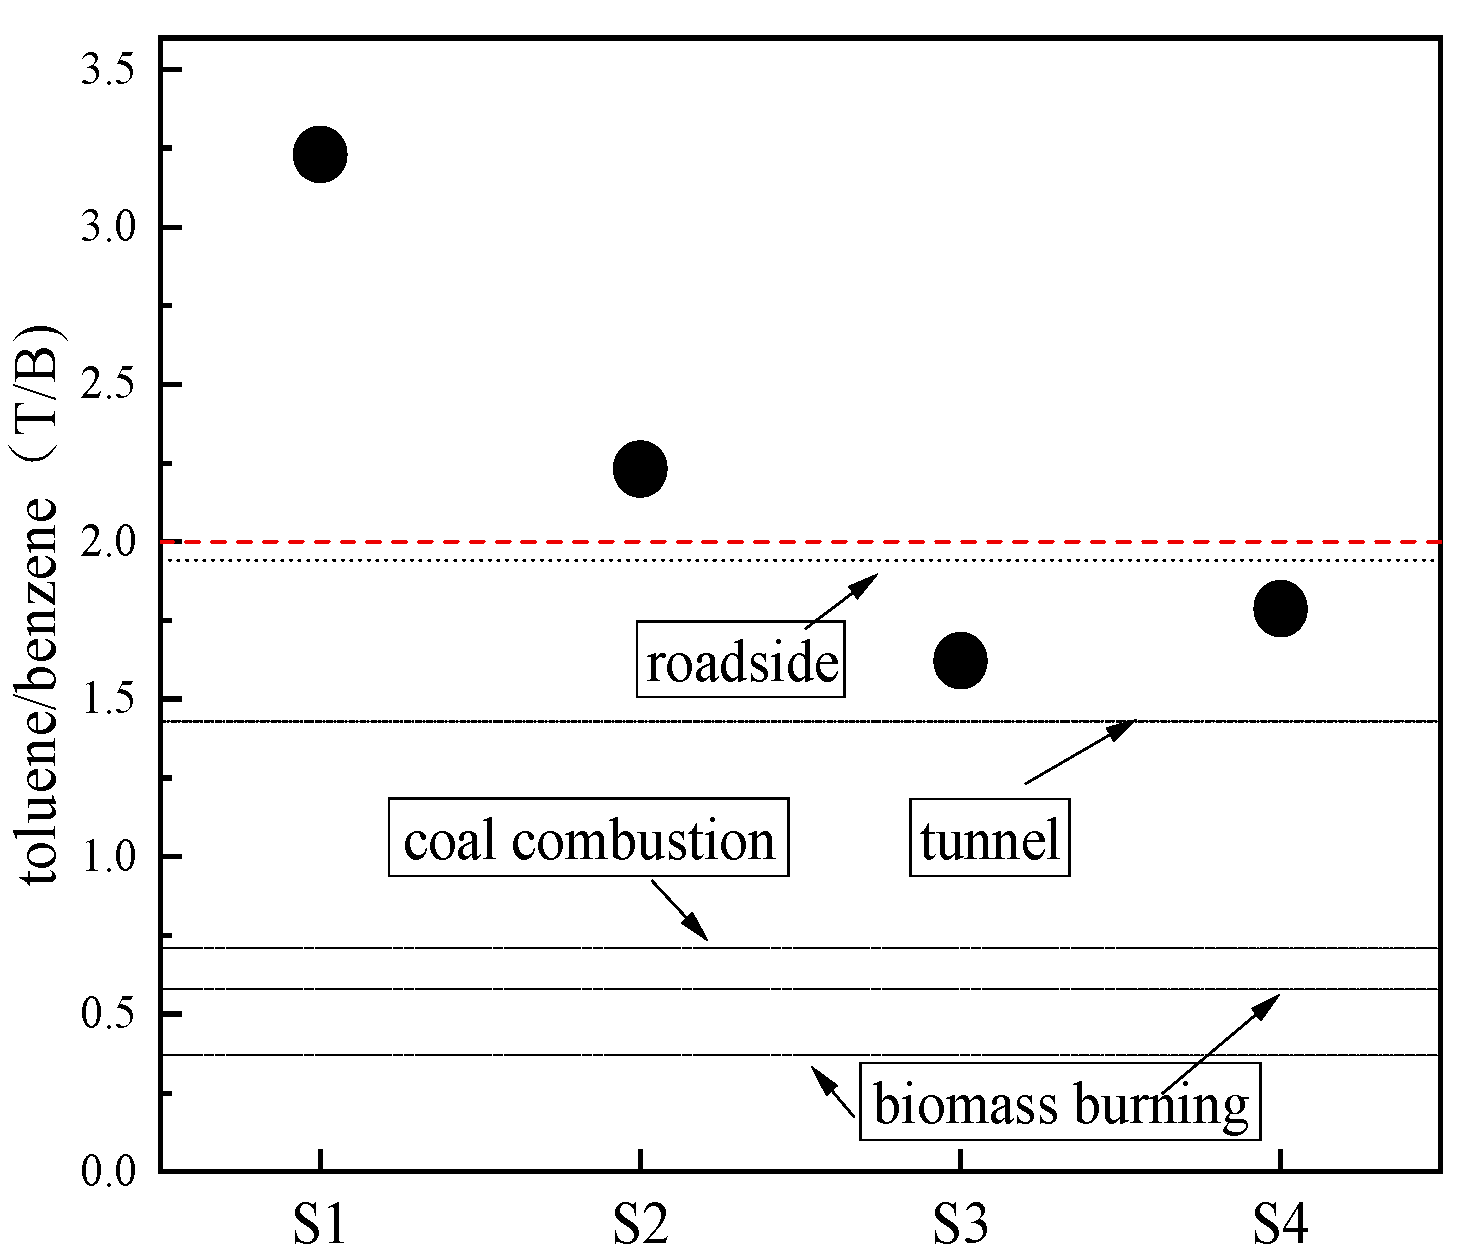
Because different emission sources have their specific NMHC profiles, the comparison of NMHC ratios between the ambient measurements and emission sources could be a reliable diagnostic tool to identify VOC sources [46,47]. The ratio of benzene/toluene (B/T) is widely used as an indicator for various sources because of the significant difference of the ratios between the vehicle exhaust and other sources, such as coal combustion, biomass burning, solvent usage and other BTEX (benzene, toluene, ethylbenzene and xylene) emission sources. To further examine the source of NMHCs, toluene to benzene ratio (T/B) was often used to identify NMHCs sources in this study.
The distinction of T/B ratios between various sources suggested that the ratio should be a useful marker during the source analysis of atmospheric VOCs. Previous research has indicated that the average ratio was 1.7, based on 27 roadside samples in 25 cities in China [39]. A T/B ratio within the range of 0.37–0.58, is considered to be an indicator of biomass burning, as reported by Wang et al. [47]. Meanwhile a T/B value of 0.71 was used as an indicator of coal combustion [47]. Mo et al. (2015) [48] found that T/B ratios in the petrochemical industry and basic chemical industry were 1.1 and 2.8, respectively. Shi et al. (2015) [49] found T/B ratios varied from 0.29 to 1.38 in the coke production industry, iron smelting industry, thermal power plants and heating station plants. A T/B value of 1.43 was found in a traffic tunnel [50].
As shown in Figure 10, the T/B ratios were relatively large and ranged 1.78–3.23 in Lanzhou. This result indicates that the observation points were greatly affected by the surrounding industrial agglomeration areas, particularly in the S1 site (3.23) and S2 site (2.23). Higher T/B at S1, on the other hand, reflected a contribution mostly originating from non-traffic sources, such as coal combustion, biomass burning, and petrochemical industrial emissions. There the result was closer to that of the industrial area in Nanjing [23]. Finally, the ratios at S3, S4 were 1.62 and 1.78, respectively, which suggests the main BTEX source at both sites was traffic.
3.3.2. Source attribution of NMHCs by PCA
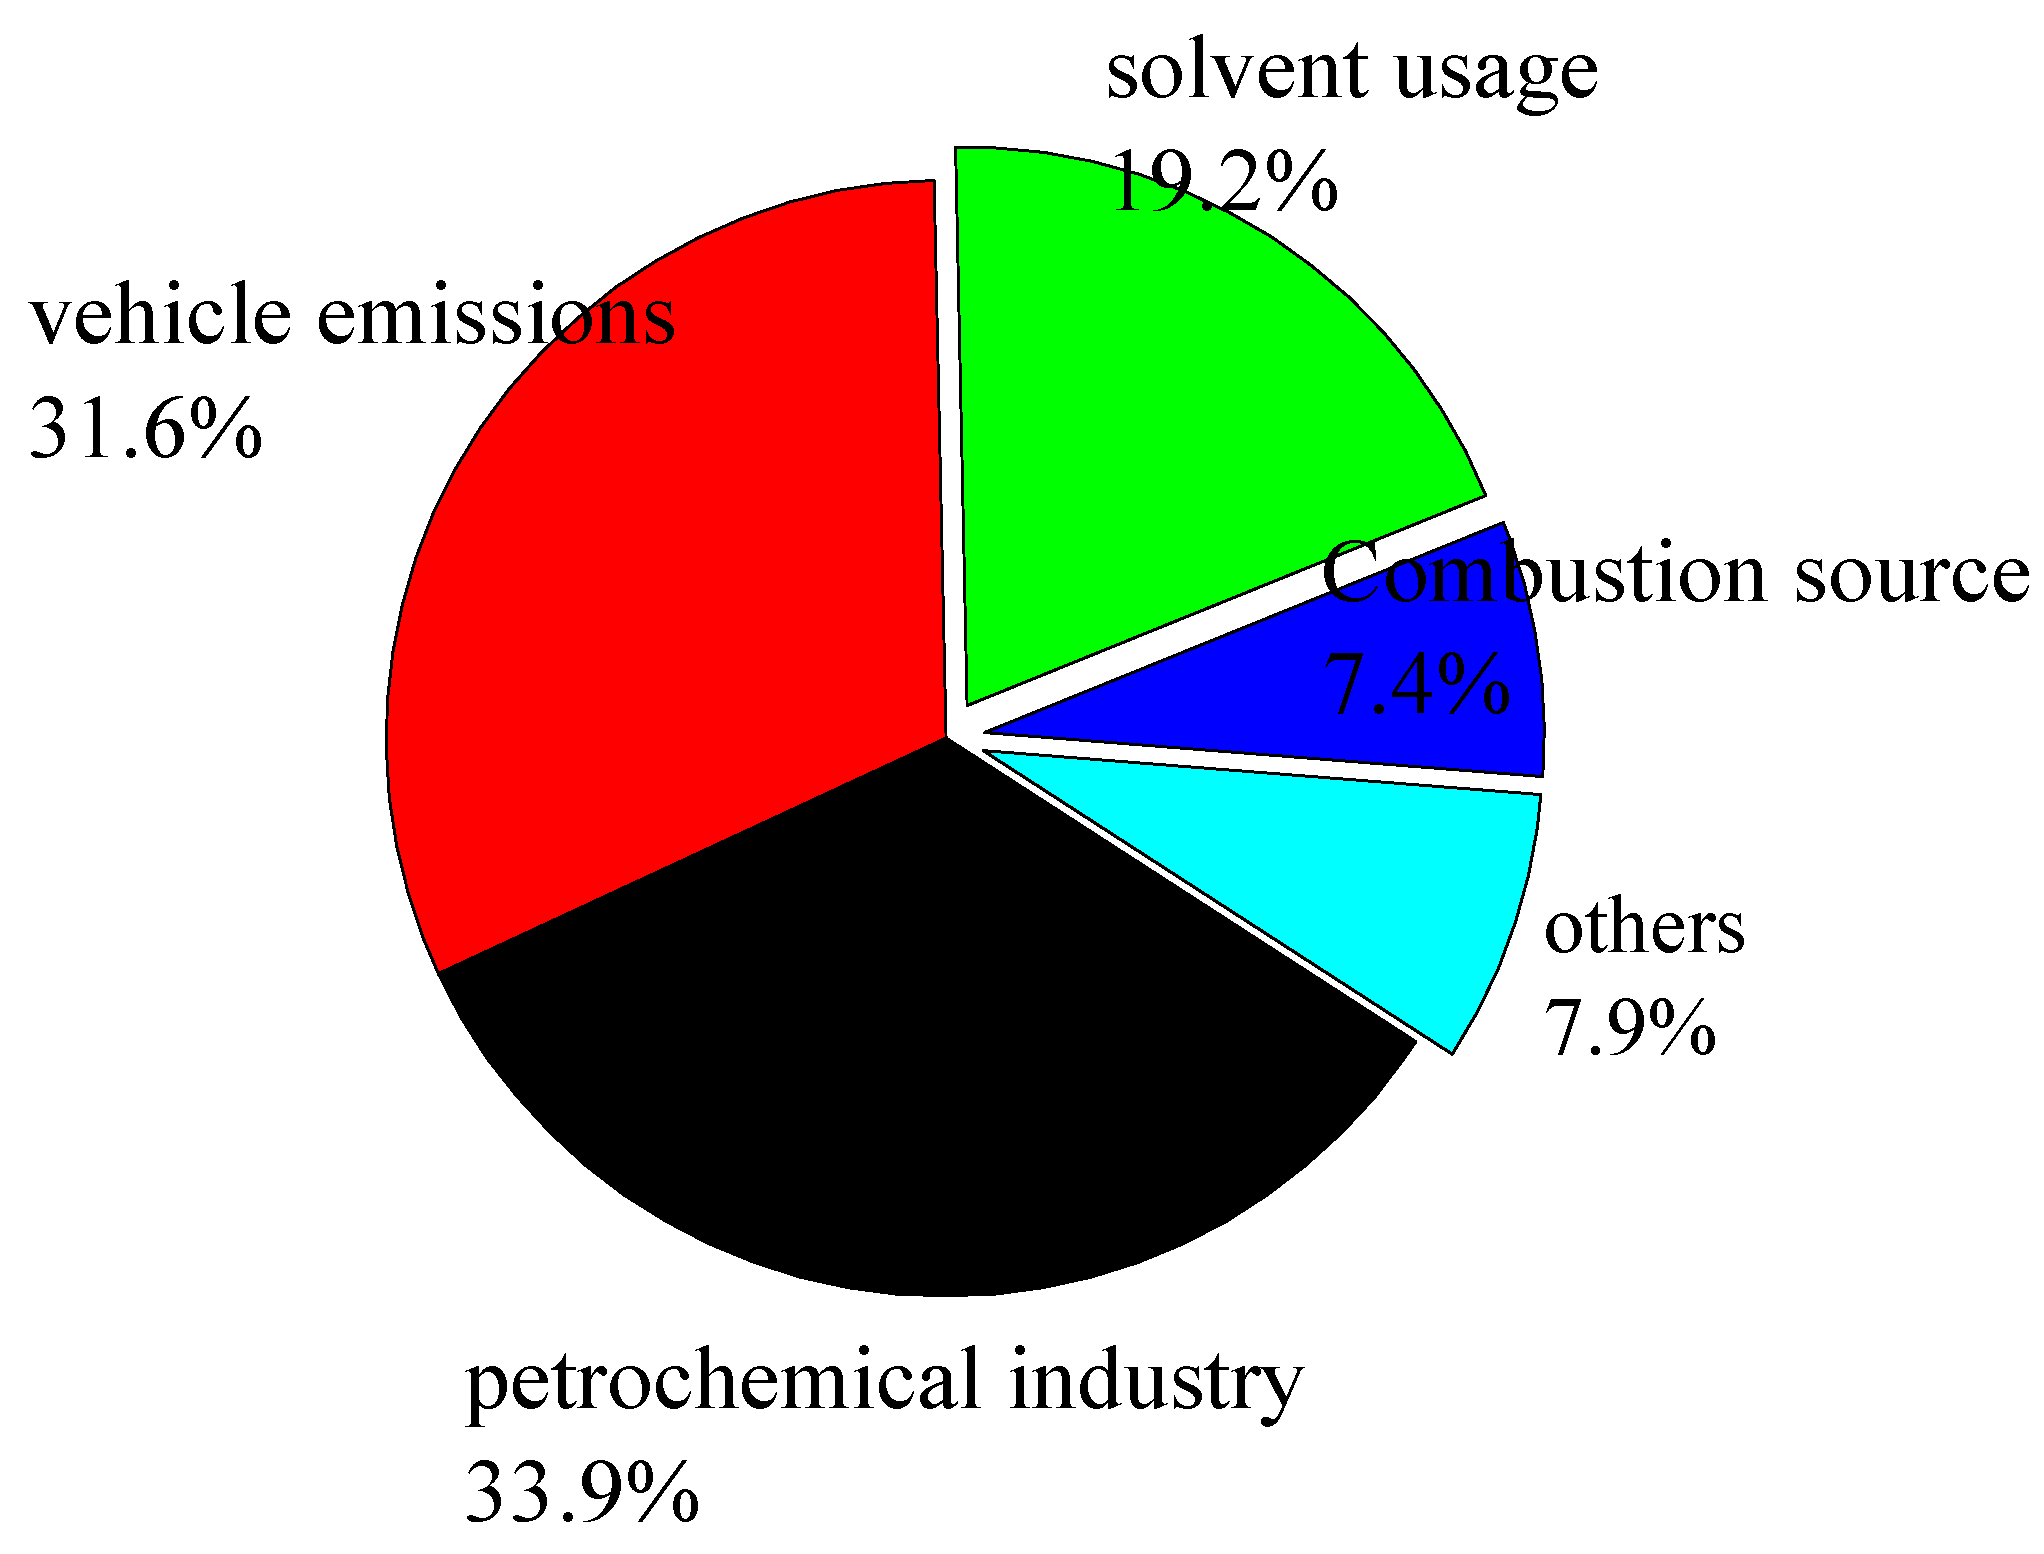
Due to the small amount of data from a single site, data from all four sites are used together for source analysis comprehensively by Principal component analysis (PCA). Thirteen typical components of the NMHCs were selected, and a PCA mode was used to analyze the sources of the NMHCs in Lanzhou during the observation period. These are the most abundant compounds (accounting for 60% of the total NMHCs) and are good tracers for major sources such as vehicle exhaust, solvent usage and the petrochemical industry. According to the results from the study conducted by Thurston and Spengler (1985) [51], when n > m + 50 (n represents the number of samples and m represents the number of pollutants for analysis), a reliable PCA result can be obtained; the number of data samples in the present study met this requirement. During the factor extraction process, Kaiser’s criteria were adopted to determine appropriate number of factors to be retained (only those factors with eigenvalue >1) [51]. Table 4 lists the results of the PCA analysis and source apportionment of Lanzhou. Four factors were extracted from the application of PCA to the data. As shown in Figure 9, the factors were identified as vehicular emissions, petrochemical industry emissions, solvent usage and combustion.
Factor 1 (PC1) consists mainly of isopentane, ethylbenzene and styrene which are major components of petrochemical industry sources [37,52]. Further, isopentaneandethyl benzene are the main species in the petrochemical plants of Lanzhou [31]. Therefore, source 1 was identified as petrochemical industry emissions. Factor 2 (PC2) from the PCA explained 31.6% of the total variance. High loadings were found on hexane, ethane, ethylene, propylene, benzene and acetylene. It has been known that propylene and acetylene are the typical species of vehicle emissions, and C3–C6 alkanes are associated with unburned vehicular emissions [53,54]. Propylene and benzene in urban areas also mainly come from automobile exhaust. All these VOCs imply emissions from vehicles, including exhaust and evaporative emissions. For Factor 3 (PC3), benzene, ethyl benzene, dodecane and propane were weighted relatively higher; a high proportion of BTEX was related to the use of solvents in painting, coating, synthetic fragrances, adhesives and cleaning agents [15,47]. Moreover, according to our published data of source of NMHCs in the same period [31], high-carbon alkanes are relatively abundant, e.g., dodecane, in the coating factory of Lanzhou. Therefore, this factor was identified as solvent usage, and the contribution to the NMHCs concentration was 19.2%. For factor 4 (PC4), acetylene, ethane and n-hexane were the species with the high factor loading, marker for combustion sources [55]. This factor was likely related to combustion emissions, including coal and biomass burning. The contribution of combustion emissions to NMHCs concentration was 7.4%.
Overall, these four factors explain 92.1% of the total variance in Lanzhou. As showed in Figure 11, petrochemical industry emissions were the major contributors of NMHCs in Lanzhou accounting for 33.9%. Vehicular exhaust and petrochemical industry emission were still the major control sources for reducing NMHCs concentration in Lanzhou.
4. Conclusions
NMHCs were collected using the SUMMA canister sampling method in four sampling sites in Lanzhou, including Lanyuan Hotel (S1), Anning district (S2), Qilihe (S3) and at the Environmental Protection Bureau of Lanzhou (S4) in May and June of 2017. A total of 56 NMHCs data sets were collected in order to analyze their compositions and concentration distributions, illustrate overall characteristics of different classes of NMHCs, and evaluate the OFPs and SOAp, and source apportionment of NMHCs using diagnostic ratios and PCA model. The results showed that the level of concentration of VOCs in Lanzhou was 48.4 ± 48.3 ppbv during the two observations. The concentration of NMHCs was higher in May (78.6 ppbv) than in June (37.8 ppbv), alkanes contributed the most to NMHCs in all sites, and the chemical composition of NMHCs was stable. The OFP and SOAp of NMHCs showed that the photochemical reactivity was high in Lanzhou and the S1 site contributed the most to the both of these parameters. Ethylbenzene, propene, toluene and styrene were found to be more reactive, with relatively high contributions to ozone formation in Lanzhou, while aromatics and high carbon alkanes were major contributors to SOAp (i.e., n-dodecane, n-undecane, toluene, m-xylene and ethylbenzene). The ratio of m,p-xylene to ethylbenzene (X/E) indicated that the air mass was fresh in Lanzhou, which showed local emission is the main source of VOCs in atmosphere of Lanzhou. The principal component analysis (PCA) and toluene/benzene (T/B) confirmed that industry and traffic were the larger sources of NMHCs in Lanzhou. Overall, local emissions are the main source of NMHCs and the petrochemical industry has a great influence on the distribution of NMHCs in the whole region of Lanzhou.
Author Contributions
Conceptualization, S.W. and F.C.; methodology, J.H. and H.L.; data analysis and discussion of the results, Y.W. and H.W.; sample collection and data determination and validation, H.L. and H.Z.; writing—original draft preparation, Y.W.; writing—review and editing, S.W.; All of the author were involved in the preparation, revision and review of the manuscript.
Funding
This research was founded by an Environmental Protection Public Welfare Scientific Research Project, Ministry of Environmental Protection of the People’s Republic of China (No. 201509002).
Conflicts of Interest
The authors declare no conflict of interest.
References
- Allen, S.K.; Plattner, G.K.; Nauels, A.; Xia, Y.; Stocker, T.F. Climate Change 2013: The Physical Science Basis. An overview of the Working Group 1 contribution to the Fifth Assessment Report of the Intergovernmental Panel on Climate Change (IPCC). Comput. Geom. 2007, 18, 95–123. [Google Scholar]
- Duan, J.; Tan, J.; Yang, L.; Wu, S.; Hao, J. Concentration, sources and ozone formation potential of volatile organic compounds (VOCs) during ozone episode in Beijing. Atmos. Res. 2008, 88, 25–35. [Google Scholar] [CrossRef]
- Jie, S.; Wu, F.; Hu, B.; Tang, G.; Wang, Y. VOC characteristics, emissions and contributions to SOA formation during hazy episodes. Atmos. Environ. 2016, 141, 560–570. [Google Scholar]
- Mills, G.; Hayes, F.; Simpson, D.; Emberson, L.; Norris, D.; Harmens, H. Evidence of widespread effects of ozone on crops and (semi-)natural vegetation in Europe (1990–2006) in relation to AOT40- and flux-based risk maps. Glob. Chang. Biol. 2015, 17, 592–613. [Google Scholar] [CrossRef]
- Nie, T.; Li, X.; Wang, X.; Shao, M.; Zhang, Y. Characteristics of the Spatial Distributions of Ozone-Precursor Sensitivity Regimes in summer over Beijing. Acta Sci. Nat. Univ. Pekin. 2014, 50, 557–564. [Google Scholar]
- Seinfeld, J.H.; Pandis, S.N. Atmospheric Chemistry and Physics: From Air Pollution to Climate Change; John Wiley & Sons: Hoboken, NJ, USA, 2006. [Google Scholar]
- Kroll, J.H.; Seinfeld, J.H. Chemistry of secondary organic aerosol: Formation and evolution of low-volatility organics in the atmosphere. Atmos. Environ. 2008, 42, 3593–3624. [Google Scholar] [CrossRef]
- Huang, R.-J.; Zhang, Y.; Bozzetti, C.; Ho, K.F.; Cao, J.J.; Han, Y.; Daellenbach, K.R.; Slowik, J.G.; Platt, S.M.; Canonaco, F.; et al. High secondary aerosol contribution to particulate pollution during haze events in China. Nature 2014, 514, 218–222. [Google Scholar]
- Kampa, M.; Castanas, E. Human health effects of air pollution. Environ. Pollut. 2008, 151, 362–367. [Google Scholar] [CrossRef]
- Bale, A.S.; Meacham, C.A.; Benignus, V.A.; Bushnell, P.J.; Shafer, T.J. Volatile organic compounds inhibit human and rat neuronal nicotinic acetylcholine receptors expressed in Xenopus oocytes. Toxicol. Appl. Pharmacol. 2005, 205, 77–88. [Google Scholar] [CrossRef]
- Ying, L.; Shao, M.; Lu, S.; Chang, C.C.; Wang, J.L.; Fu, L. Source apportionment of ambient volatile organic compounds in the Pearl River Delta, China: Part II. Atmos. Environ. 2008, 42, 6261–6274. [Google Scholar]
- Baker, A.; Beyersdorf, A.J.; Doezema, L.A.; Katzenstein, A.; Meinardi, S.; Simpson, I.J. Measurements of nonmethane hydrocarbons in 28 United States cities. Atmos. Environ. 2008, 42, 170–182. [Google Scholar] [CrossRef]
- Lu, S.; Ying, L.; Min, S.; Shan, H. Chemical speciation and anthropogenic sources of ambient volatile organic compounds (VOCs) during summer in Beijing, 2004. Front. Environ. Sci. Eng. China 2007, 1, 147–152. [Google Scholar] [CrossRef]
- Han, M.; Lu, X.; Zhao, C.; Ran, L.; Han, S. Characterization and Source Apportionment of Volatile Organic Compounds in Urban and Suburban Tianjin, China. Adv. Atmos. Sci. 2015, 32, 439–444. [Google Scholar] [CrossRef]
- Cai, C.; Geng, F.; Tie, X.; Yu, Q.; An, J. Characteristics and source apportionment of VOCs measured in Shanghai, China. Atmos. Environ. 2010, 44, 5005–5014. [Google Scholar] [CrossRef]
- Geng, F.; Zhao, C.; Tang, X.; Lu, G.; Tie, X. Analysis of ozone and VOCs measured in Shanghai: A case study. Atmos. Environ. 2007, 41, 989–1001. [Google Scholar] [CrossRef]
- Xue, L.; Wang, T.; Gao, J.; Ding, A.; Zhou, X.; Blake, D. Ground-level ozone in four Chinese cities: Precursors, regional transport and heterogeneous processes. Atmos. Chem. Phys. 2014, 14, 13175–13188. [Google Scholar] [CrossRef]
- Zhang, L.; Chen, C.H.; Li, S.X.; Zhang, F. Air Pollution and Potential Control Schemes in Lanzhou. Res. Environ. 2000, 13, 18–21. [Google Scholar]
- Tang, X.Y.; Li, J.L.; Dong, Z.X. Photochemical pollution in Lanzhou, China—A case study. J. Environ. Sci. 1989, 1, 31–38. [Google Scholar]
- Cheng, C.; Huang, J.; Ren, Z.; Peng, X. Meteorological conditions of photochemical smog in Xigu industrial area, lanzhou. Acta Sci. Circumstantiae 1986, 6, 334–342. [Google Scholar]
- Jia, C.; Mao, X.; Huang, T.; Liang, X.; Wang, Y.; Shen, Y.; Jiang, W.; Wang, H.; Bai, Z.; Ma, M.; et al. Non-methane hydrocarbons (NMHCs) and their contribution to ozone formation potential in a petrochemical industrialized city, Northwest China. Atmos. Res. 2016, 169, 225–236. [Google Scholar] [CrossRef]
- Yan, Y.; Peng, L.; Li, R.; Li, Y.; Li, L.; Bai, H. Concentration, ozone formation potential and source analysis of volatile organic compounds (VOCs) in a thermal power station centralized area: A study in Shuozhou, China. Environ. Pollut. 2017, 223, 295–304. [Google Scholar] [CrossRef]
- An, J.; Zhu, B.; Wang, H.; Li, Y.; Lin, X.; Yang, H. Characteristics and source apportionment of VOCs measured in an industrial area of Nanjing, Yangtze River Delta, China. Atmos. Environ. 2014, 97, 206–214. [Google Scholar] [CrossRef]
- Ho, K.F.; Lee, S.C.; Guo, H.; Tsai, W.Y. Seasonal and diurnal variations of volatile organic compounds (VOCs) in the atmosphere of Hong Kong. Sci. Total Environ. 2004, 322, 155–166. [Google Scholar] [CrossRef]
- Li, L.; Xie, S.; Zeng, L.; Wu, R.; Li, J. Characteristics of volatile organic compounds and their role in ground-level ozone formation in the Beijing-Tianjin-Hebei region, China. Atmos. Environ. 2015, 113, 247–254. [Google Scholar] [CrossRef]
- Li, Y.Y.; Zhu, B.; An, J.L.; Gao, J.H.; Tang, L.L. Characteristics of VOCs and Their Photochemical Reactivity in Autumn in Nanjing Northern Suburb. Environ. Sci. 2013, 34, 2933–2942. [Google Scholar]
- Lyu, X.P.; Chen, N.; Guo, H.; Zhang, W.H.; Liu, M. Ambient volatile organic compounds and their effect on ozone production in Wuhan, central China. Sci. Total Environ. 2016, 548, 483. [Google Scholar] [CrossRef]
- Cai, C.J.; Geng, F.H.; Tie, X.X.; Yu, Q.; Peng, L.; Zhou, G.Q. Characteristics of ambient volatile organic compounds (VOCs) measured in Shanghai, China. Sensors 2010, 10, 7843–7862. [Google Scholar] [CrossRef]
- Alghamdi, M.A.; Khoder, M.; Harrison, R.M.; Hyvärinen, A.P.; Hussein, T.; Al-Jeelani, H.; Abdelmaksoud, A.S.; Goknil, M.H.; Shabbaj, I.I.; Almehmadi, F.M.; et al. Temporal variations of O3 and NOx in the urban background atmosphere of the coastal city Jeddah, Saudi Arabia. Atmos. Environ. 2014, 94, 205–214. [Google Scholar] [CrossRef]
- Liu, P.; Zhang, C.; Mu, Y.; Liu, C.; Xue, C.; Ye, C. The levels, variation characteristics and sources of atmospheric non-methane hydrocarbon compounds during wintertime in Beijing, China. Atmos. Chem. Phys. Discuss. 2017, 17, 10633–10649. [Google Scholar] [CrossRef]
- Wu, Y.J.; Hu, J.; Zhang, H.F.; Zhang, J.Q.; Zhang, M.; Chai, F.H.; Wang, S.L. Characteristics and Chemical Reactivity of Fugitive Volatile Organic Compounds from Typical Industries in Lanzhou City. Res. Environ. Sci. 2019, 32, 802–812. [Google Scholar]
- Watson, J.G.; Chow, J.C.; Fujita, E.M. Review of volatile organic compound source apportionment by chemical mass balance. Atmos. Environ. 2001, 35, 1567–1584. [Google Scholar] [CrossRef]
- Carter, W.P.L. Development of Ozone Reactivity Scales for Volatile Organic Compounds. Air Waste 1994, 44, 881–899. [Google Scholar] [CrossRef]
- Wang, H. Chemical Loss of Volatile Organic Compounds and Its Impact on the Formation of Ozone in Shanghai. Environ. Sci. 2015, 36, 3159–3167. [Google Scholar]
- Lin, X.; Zhu, B.; An, J.L.; Yang, H. Potential contribution of secondary organic aerosols and ozone of VOCs in the Northern Suburb of Nanjing. China Environ. Sci. 2015, 35, 976–986. [Google Scholar]
- Yu, X.; Cheng, P.; Gu, Y.; Li, M.; Tian, Z. Formation potential of ozone and secondary organic aerosol from VOCs oxidation in summer in Guangzhou, China. China Environ. Sci. 2018, 38, 830–837. [Google Scholar]
- Ying, L.; Shao, M.; Fu, L.; Lu, S.; Zeng, L.; Tang, D. Source profiles of volatile organic compounds (VOCs) measured in China: Part I. Atmos. Environ. 2008, 42, 6247–6260. [Google Scholar]
- Grosjean, D. In situ organic aerosol formation during a smog episode: Estimated production and chemical functionality. Atmos. Environ. 1992, 26, 953–963. [Google Scholar] [CrossRef]
- Lv, Z.; Hao, J.M.; Duan, J.C.; Li, J.H. Estimate of the Formation Potential of Secondary Organic Aerosol in Beijing Summertime. Environ. Sci. 2009, 30, 969–975. [Google Scholar]
- Wu, W.; Zhao, B.; Wang, S.; Hao, J. Ozone and secondary organic aerosol formation potential from anthropogenic volatile organic compounds emissions in China. J. Environ. Sci. 2017, 53, 224–237. [Google Scholar] [CrossRef]
- Dechapanya, W.; Russell, M.; Allen, D.T. Estimates of Anthropogenic Secondary Organic Aerosol Formation in Houston, Texas Special Issue of Aerosol Science and Technology on Findings from the Fine Particulate Matter Supersites Program. Aerosol Sci. Technol. 2004, 38, 156–166. [Google Scholar] [CrossRef]
- Zhang, Y.; Wang, X.; Barletta, B.; Simpson, I.J.; Blake, D.R.; Fu, X. Source attributions of hazardous aromatic hydrocarbons in urban, suburban and rural areas in the Pearl River Delta (PRD) region. J. Hazard. Mater. 2013, 250, 403–411. [Google Scholar] [CrossRef] [PubMed]
- Barletta, B.; Meinardi, S.; Rowland, F.S.; Chan, C.Y.; Wang, X.; Zou, S. Volatile organic compounds in 43 Chinese cities. Atmos. Environ. 2005, 39, 5979–5990. [Google Scholar] [CrossRef]
- Garzón, J.P.; Huertas, J.I.; Magaña, M.; Huertas, M.E.; Cárdenas, B.; Watanabe, T.; Blanco, S. Volatile organic compounds in the atmosphere of Mexico City. Atmos. Environ. 2015, 119, 415–429. [Google Scholar] [CrossRef]
- Mehta, D.; Nguyen, A.; Montenegro, A.; Li, Z. A Kinetic Study of the Reaction of OH with Xylenes Using the Relative Rate/Discharge Flow/Mass Spectrometry Technique. J. Phys. Chem. A 2009, 113, 12942–12951. [Google Scholar] [CrossRef]
- Baldasano, J.M.; Delgado, R.; Calbó, J. Applying Receptor Models to Analyze Urban/Suburban VOCs Air Quality in Martorell (Spain). Environ. Sci. Technol. 2001, 32, 405–412. [Google Scholar] [CrossRef]
- Wang, M.; Shao, M.; Lu, S.H.; Yang, Y.D.; Chen, W.T. Evidence of coal combustion contribution to ambient VOCs during winter in Beijing. Chin. Chem. Lett. 2013, 24, 829–832. [Google Scholar] [CrossRef]
- Mo, Z.; Shao, M.; Lu, S.; Qu, H.; Zhou, M.; Sun, J. Process-specific emission characteristics of volatile organic compounds (VOCs) from petrochemical facilities in the Yangtze River Delta, China. Sci. Total Environ. 2015, 533, 422–431. [Google Scholar] [CrossRef]
- Shi, J.; Deng, H.; Bai, Z.; Kong, S.; Wang, X.; Hao, J.; Han, X. Emission and profile characteristic of volatile organic compounds emitted from coke production, iron smelt, heating station and power plant in Liaoning Province, China. Sci. Total Environ. 2015, 515, 101–108. [Google Scholar] [CrossRef]
- Na, K. Determination of VOC source signature of vehicle exhaust in a traffic tunnel. J. Environ. Manag. 2006, 81, 392–398. [Google Scholar] [CrossRef]
- Thurston, G.D.; Spengler, J.D. A quantitative assessment of source contributions to inhalable particulate matter pollution in metropolitan Boston. Atmos. Environ. 1987, 19, 9–25. [Google Scholar] [CrossRef]
- Cetin, E.; Odabasi, M.; Seyfioglu, R. Ambient volatile organic compound (VOC) concentrations around a petrochemical complex and a petroleum refinery. Sci. Total Environ. 2003, 312, 103–112. [Google Scholar] [CrossRef]
- Chang, C.C.; Wang, J.L.; Lung, S.C.C.; Liu, S.C.; Shiu, C.J. Source characterization of ozone precursors by complementary approaches of vehicular indicator and principal component analysis. Atmos. Environ. 2009, 43, 1771–1778. [Google Scholar] [CrossRef]
- Scheff, P.A.; Wadden, R.A. Receptor modeling of volatile organic compounds. 1. Emission inventory and validation. Environ. Sci. Technol. 1993, 27, 617–625. [Google Scholar] [CrossRef]
- Barletta, B.; Meinardi, S.; Simpson, I.J.; Khwaja, H.A.; Blake, D.R.; Rowland, F.S. Mixing ratios of volatile organic compounds (VOCs) in the atmosphere of Karachi, Pakistan. Atmos. Environ. 2002, 36, 3429–3443. [Google Scholar] [CrossRef]
Figure 1.
Map of this study’s sampling sites in Lanzhou.

Figure 2.
Wind speed data for study sampling sites S1, S3 and S4 in Lanzhou in May and June.

Figure 3.
Concentrations of NMHCs in different sampling sites in Lanzhou.

Figure 4.
NMHCs components in May (a) and June (b) at different sampling sites.

Figure 5.
The top 10 species of NMHCs at each sample site over the sampling period of May and June.

Figure 6.
Contributions of NMHC groups to the total OFP in Lanzhou.

Figure 7.
Contributions of NMHC groups to the total OFP in different cities.

Figure 8.
Top 10 abundant NMHC species with high SOA potential.

Figure 9.
M,p-xylene/ethyl-benzene (X/E) of different sampling sites.

Figure 10.
Toluene/Benzene (T/B) ratio at different sampling sites.

Figure 11.
Relative contribution of each factor in the PCA analysis.


Table 1.
The non-methane hydrocarbons (NMHCs) compounds measured in this study.
| Alkanes | Alkenes and Alkyne | Aromatics | |
|---|---|---|---|
| Ethane | 2,3-dimethylpentane | Ethylene | Benzene |
| Propane | 3-methylhexane | Propylene | Toluene |
| Isobutane | 2,2,4-trimethylpentane | Trans-2-butene | Ethylbenzene |
| N-butane | N-heptane | 1-butene | m, p-xylene |
| Cyclopentane | Methylcyclohexane | Cis-2-butene | O-xylene |
| Isopentane | 2,3,4-trimethylpentane | 1-pentene | Styrene |
| N-pentane | 2-methylheptane | Trans-2-pentene | Iso-propylbenzene |
| 2,2-dimethylbutane | 3-methylheptane | Isoprene | N-propylbenzene |
| 2,3-dimethylbutane | N-octane | Cis-2-pentene | M-ethyltoluene |
| 2-methylpentane | N-nonane | 1-hexene | P-ethyltoluene |
| 3-methylpentane | N-decane | Acetylene | 1,3,5-trimethylbenzene |
| N-hexane | N-undecane | O-ethyltoluene | |
| 2,4-dimethylpentane | N-dodecane | 1,2,4-trimethylbenzene | |
| Methylcyclopentane | 1,2,3-trimethylbenzene | ||
| 2-methylhexane | M-diethylbenzene | ||
| Cyclohexane | P-diethylbenzene | ||
Table 2.
The top 10 species with the highest ozone formation potential (OFP) in different sites in sampling period (May and June).
Table 2.
The top 10 species with the highest ozone formation potential (OFP) in different sites in sampling period (May and June).
| S1 | OFP | S2 | OFP | S3 | OFP | S4 | OFP |
|---|---|---|---|---|---|---|---|
| ethylbenzene | 14.13% | propene | 15.38% | propene | 15.85% | propene | 12.39% |
| propene | 12.97% | toluene | 14.94% | n-butene | 13.01% | ethylbenzene | 11.47% |
| styrene | 12.48% | isopentane | 11.19% | ethylbenzene | 9.09% | n-Pentane | 10.50% |
| n-pentane | 9.18% | m/p-xylene | 10.49% | styrene | 8.92% | styrene | 10.29% |
| m/p-xylene | 9.16% | ethylene | 7.85% | m/p-xylene | 7.58% | Trans-2-butene | 10.25% |
| n-butene | 7.76% | styrene | 4.60% | 1-Pentene | 5.59% | m/p-xylene | 6.41% |
| toluene | 5.28% | cis-2-butene | 4.00% | isopentane | 5.27% | 1-Butene | 5.87% |
| Trans-2-butene | 4.73% | n-pentane | 3.89% | n-pentane | 4.33% | isopentane | 5.17% |
| 2,2-Dimethylbutane | 2.72% | n-butane | 3.80% | toluene | 4.14% | 1-Pentene | 4.04% |
| 1-Pentene | 2.32% | n-butene | 3.35% | isobutane | 3.26% | Benzene | 2.71% |
Table 3.
Secondary organic aerosol formation potential (SOAp) at different sites in Lanzhou.
| Species | FAC | Fvocr | SOAp (μg/m3) | ||||
|---|---|---|---|---|---|---|---|
| S1 | S2 | S3 | S4 | ||||
| alkane | Methylcyclopentane | 0.002 | 0.100 | 0.001 | 0.001 | 0.001 | 0.001 |
| Cyclohexane | 0.002 | 0.140 | 0.001 | 0.000 | 0.000 | 0.001 | |
| n-Heptane | 0.001 | 0.140 | 0.000 | 0.001 | 0.000 | 0.000 | |
| Methylcyclohexane | 0.027 | 0.200 | 0.012 | 0.015 | 0.008 | 0.007 | |
| 2-Methylheptane | 0.005 | 0.100 | 0.001 | 0.001 | 0.001 | 0.001 | |
| 3-Methylheptane | 0.005 | 0.100 | 0.001 | 0.001 | 0.001 | 0.001 | |
| n-octane | 0.001 | 0.170 | 0.001 | 0.001 | 0.000 | 0.000 | |
| n-Nonane | 0.015 | 0.200 | 0.011 | 0.006 | 0.006 | 0.005 | |
| n-Decane | 0.020 | 0.220 | 0.035 | 0.011 | 0.020 | 0.032 | |
| n-undecane | 0.025 | 0.250 | 0.065 | 0.028 | 0.039 | 0.032 | |
| n-dodecane | 0.030 | 0.260 | 0.068 | 0.014 | 0.058 | 0.070 | |
| alkene | Isoprene | 0.026 | 0.230 | 0.016 | 0.020 | 0.010 | 0.008 |
| aromatic | Benzene | 0.020 | 0.100 | 0.084 | 0.035 | 0.035 | 0.029 |
| Toluene | 0.054 | 0.120 | 0.480 | 0.418 | 0.246 | 0.244 | |
| Ethylbenzene | 0.054 | 0.150 | 0.175 | 0.118 | 0.096 | 0.091 | |
| m -Xylene | 0.047 | 0.340 | 0.173 | 0.160 | 0.100 | 0.124 | |
| p-Xylene | 0.047 | 0.340 | 0.107 | 0.062 | 0.068 | 0.076 | |
| o-Xylene | 0.050 | 0.260 | 0.062 | 0.052 | 0.046 | 0.051 | |
| iso-Propylbenzene | 0.040 | 0.130 | 0.008 | 0.003 | 0.004 | 0.004 | |
| n-Propylbenzene | 0.016 | 0.120 | 0.003 | 0.002 | 0.002 | 0.002 | |
| m-ethyltoluene | 0.063 | 0.310 | 0.011 | 0.006 | 0.008 | 0.011 | |
| p-ethyltoluene | 0.025 | 0.210 | 0.004 | 0.002 | 0.003 | 0.004 | |
| 1,3,5-Trimethylbenzene | 0.029 | 0.740 | 0.005 | 0.002 | 0.003 | 0.003 | |
| o-ethyltoluene | 0.056 | 0.230 | 0.005 | 0.003 | 0.004 | 0.004 | |
| 1,2,4-Trimethylbenzene | 0.020 | 0.580 | 0.009 | 0.005 | 0.005 | 0.006 | |
| 1,2,3-Trimethylbenzene | 0.036 | 0.510 | 0.009 | 0.006 | 0.006 | 0.010 | |
| m-diethylbenzene | 0.063 | 0.470 | 0.017 | 0.007 | 0.007 | 0.009 | |
| p-diethylbenzene | 0.063 | 0.470 | 0.019 | 0.011 | 0.012 | 0.013 | |
| NMHCs | SUM | - | - | 1.38 | 0.99 | 0.79 | 0.84 |
Table 4.
Component analysis of VOCs in Lanzhou.
| VOCs | Principal Component | |||
|---|---|---|---|---|
| PC1 | PC2 | PC3 | PC4 | |
| Ethane | - | 0.83 | 0.5 | 0.1 |
| Propane | 0.13 | 0.11 | 0.97 | 0.04 |
| n-hexane | 0.2 | 0.85 | - | 0.35 |
| Isopentane | 0.83 | 0.02 | 0.48 | 0.07 |
| Dodecane | 0.12 | 0.06 | 0.95 | - |
| Ethylene | - | 0.92 | - | - |
| Propylene | - | 0.85 | 0.47 | 0.03 |
| Isoprene | 0.12 | 0.87 | - | - |
| Acetylene | - | 0.13 | 0.05 | 0.98 |
| Benzene | - | 0.98 | 0.63 | 0.01 |
| ethyl benzene | 0.98 | 0.05 | 0.75 | - |
| p-xylene | 0.08 | 0.02 | 0.95 | - |
| Styrene | 0.95 | 0.03 | - | - |
| variance contribution | 33% | 32% | 19% | 7% |
Note List the factor load >0.01 only; Extract Method: Principal component analysis; Rotation Method: Varimax orthogonal rotation.
© 2019 by the authors. Licensee MDPI, Basel, Switzerland. This article is an open access article distributed under the terms and conditions of the Creative Commons Attribution (CC BY) license (http://creativecommons.org/licenses/by/4.0/).
Share and Cite
MDPI and ACS Style
Wu, Y.; Hu, J.; Wang, H.; Li, H.; Zhang, H.; Chai, F.; Wang, S. The Characteristics of Ambient Non-Methane Hydrocarbons (NMHCs) in Lanzhou, China. Atmosphere 2019, 10, 745. https://doi.org/10.3390/atmos10120745
AMA Style
Wu Y, Hu J, Wang H, Li H, Zhang H, Chai F, Wang S. The Characteristics of Ambient Non-Methane Hydrocarbons (NMHCs) in Lanzhou, China. Atmosphere. 2019; 10(12):745. https://doi.org/10.3390/atmos10120745
Chicago/Turabian StyleWu, Yajun, Jun Hu, Han Wang, Hui Li, Hefeng Zhang, Fahe Chai, and Shulan Wang. 2019. "The Characteristics of Ambient Non-Methane Hydrocarbons (NMHCs) in Lanzhou, China" Atmosphere 10, no. 12: 745. https://doi.org/10.3390/atmos10120745
Note that from the first issue of 2016, this journal uses article numbers instead of page numbers. See further details here.