Cross-City Convergence in Urban Green Space Coverage in China


1
Key Laboratory of Western China’s Environmental Systems (Ministry of Education), College of Earth and Environmental Sciences, Lanzhou University, Lanzhou 730000, China
2
Institute for Circular Economy in Western China, Lanzhou University, Lanzhou 730000, China
3
Key Lab of Pollution Ecology and Environmental Engineering, Institute of Applied Ecology, Chinese Academy of Sciences, Shenyang 10016, China
4
Institute for Advanced Sustainability Studies (IASS), Potsdam 14467, Germany
5
College of Geography and Environment Science, Northwest Normal University, Lanzhou 730070, China
*
Authors to whom correspondence should be addressed.
Sustainability 2019, 11(17), 4707; https://doi.org/10.3390/su11174707
Submission received: 20 July 2019
/
Revised: 26 August 2019
/
Accepted: 27 August 2019
/
Published: 29 August 2019
(This article belongs to the Section Sustainable Urban and Rural Development)
Abstract
:Cross-city convergence in green space coverage could contribute to our understanding of the law of motion of distribution dynamics of environmental sustainability across cities and provide crucial information for designing policies regarding complex processes relating to human–environment interactions in an urban system. The relationship between socioeconomic factors and green space coverage has been widely discussed, but research on the distribution dynamics of green space coverage across cities is limited. This paper explored the pattern of convergence in green space coverage of a group of 285 Chinese cities over the period of 2002–2012 by using hybrid approaches, including the nonparametric estimation technique, unconditional β-convergence model, and conditional β-convergence model. The results indicated that the green space coverage level in most cities has been substantially improved; the spatial disparity across Chinese cities has shrunk, and the level of green space coverage has converged to 104% of the average level. The β-convergence estimation results demonstrate the existence of unconditional and conditional convergence in green space coverage among Chinese cities, which indicates that cities with a low initial level of green space coverage grow faster than those with an initial high level. Faster sprawling, more compact and wealthier cities are likely to converge to a higher level of green space coverage. Expansion of the population and spatial scale of cities contributes to increasing green space coverage, sprawling of built-up area leads to a decrease of the green space coverage, and economic growth has little impact on green space coverage.
1. Introduction
Currently, more than 50% of the global population lives in cities, and by 2050 this number will increase to 80% [1]. With sustained population concentration in cities, many cities tend towards sprawling, especially in built-up areas. Therefore, the remaining nature within cities becomes extremely important to the ecological health and habitability of cities. As the main part of the nature system in cities, green spaces, which can be defined as urban spaces primarily covered by vegetation which are available for urban residents [2], have been called the “lungs of the city” [3]. The interconnected network of green spaces, known as the green infrastructure, contributes to carbon sequestration [4], air purification [5,6], heat island effect mitigation [7,8], stormwater runoff reduction [9], biodiversity conservation [10], and thus improvement of the habitability of cities and public health (both physical and psychological) [11,12]. Therefore, green space coverage can be considered a measurement of environmental sustainability and ecological health for cities [13].
Insights into the distribution of urban green space coverage are important from the perspective of urban habitability, environmental sustainability, and equity [14]. Numerous studies have investigated the spatial distribution of green spaces, both within cities and across cities. Most of the current studies have focused on the green space distribution of a certain city and have often applied remote sensing and landscape ecology methods to investigate the spatial variation of green spaces among various landscape components or land use categories at a fine scale [15,16,17]. They have found that the green space distribution is highly related to the population density [18], commercial facilities [19], land use pattern [20], and other socioeconomic variations [21]. Furthermore, other scholars have conducted in-depth research by integrating spatiotemporal analysis and socioeconomic activities or processes, such as the accessibility to green spaces [22,23], green justice (or equity) [12,21,24], and environmental effects [25,26,27] and health impacts [28] of green space distribution.
Regarding green space distribution across cities, a number of relevant studies have investigated the temporal changes in cross-city spatial disparity and its driving factors at the national and above scale, and have found that there is a high level of heterogeneity in the distribution of urban spaces due to urban space expansion, intensive land usage, and increasing population density [14,29,30,31,32,33]. Studies of European cities have shown that the green space provision within a city is primarily related to city area rather than the population size it serves, and a decrease in population does not lead to a decline in residential areas and a subsequent increase in urban green space on a large scale [14,32]. In the case of Southeast Asia, the provision of green space decreased with population density but increased with GDP [34]. In China, the green space coverage of Chinese cities substantially increased with urbanization, which contributed to the increase in green space coverage at an average level, which is different to the phenomenon observed in European cities [33]. However, the existing studies have failed to identify some important features in the evolution of cross-city green space distribution, specifically the distribution dynamics and the process of cross-city convergence.
Cross-city convergence is a method for researching the evolution over time of an entire cross-city distribution of green space. Numerous studies have been conducted to probe the convergence of income or productivities across countries and regions. Recently, the environment-related literature has included studies on the convergence in energy consumption [35,36], water consumption [37], carbon-dioxide emissions [38,39,40], and eco-efficiency [41]. However, to our knowledge, the cross-city convergence of green space has so far received little attention in the literature. Moreover, little is known about the distribution dynamics of urban green spaces across a large number of cities in China, which possesses the largest number of cities located in geographically and economically diverse regions [42]. This study aims to contribute to the literature on cross-city convergence in green space coverage. By using a large cross-city data set covering the period of 2002–2012 and applying kernel density estimation and β-convergence test techniques, the cross-city convergence patterns of green space coverage, which were indicated by the green space coverage ratio, were investigated. As pointed out by other scholars, a comprehensive understanding of the social–ecology interaction can allow us to better assess how human-induced urbanization impacts green spaces and their ecological services [43]. Thus, this study also explored the impacts of socioeconomic factors on changes in green space coverage.
2. Methodology
2.1. Spatial Distribution Analysis
A nonparametric estimation technique—kernel density estimation (KDE)—was applied to explore the spatial distribution of green space coverage ratio (GCR) measured by the ratio of green space coverage area in total in relation to built-up areas between 2002 and 2012. KDE is an effective technique for estimating the probability density function of GCR and investigating the external shape of the spatial distribution [44]. For the KDE, the computed result is sensitive to the selection of the bandwidth or smoothing parameter. In this case, we used Gaussian kernel functions as the kernel weighting function, and the value of the bandwidth was selected following the method outlined by Silverman ([45], p. 47)
2.2. Cross-City Convergence Analysis
Convergence was first introduced to describe the process of equalization of growth rates across regions (or countries), and much of the related discussions have been conducted to investigate convergence in economic growth [46,47,48]. Numerous scholars have investigated convergence in environmental indicators, such as resource consumption [37,49,50,51], atmosphere pollutant emissions [52], CO2 emissions [53,54,55,56], environmental quality [57,58], and ecological efficiency [41,59,60,61]. The investigation of convergence in environmental variables is important from the perspective of compatibility between economic growth and environmental preservation in the long run and could provide useful information for the design of policies regarding the complex processes featured in the interactions between economic and ecological processes [48,62]. In this paper, the definition of cross-city convergence is the process of equalization of development rates across city districts. On the contrary, divergence is the process of expanding disparities among city districts in green space coverage [63,64].
There are two main types of convergence: α-convergence and β-convergence, which can be further distinguished between absolute (or unconditional) and conditional β-convergence, and each notion of convergence is linked to different methodological models [46,48,49,63,64,65]. β-convergence is the negative relationship between the growth rate of the variable and the initial level of the variable and refers to the fact that regions with a low initial level grow faster than regions with an initially high level in a given variable. In most recent studies, β-convergence has been estimated by employing the following function:
where Ri,t refers to the value of the variable in region i at time t, Ri,t+1 refers to the value of the variable in region i at time t+1, α and β are estimated coefficients, and ε is the random error term. A negative value of β implies β-convergence. Equation (1) models absolute (unconditional) β-convergence, in which all regions tend to move toward a common value. If the regression equation includes other variables (Equation (2)), it depicts a model of conditional β-convergence.
where xi,t,j refers to the conditional variables j in region i at time t, and λ is estimated coefficient. The other variables are same as in Equation (1). Both Equations (1) and (2) are estimated by panel data.
This paper used Equations (1) and (2) to test β-convergence. The indicator of urban green space coverage was the green space coverage ratio (GCR), which was measured by the ratio of green space coverage area in total in relation to built-up areas.
To study β-convergence, the letter E in Equation (1) represents GCR. Thus, Equation (1) represents unconditional β-convergence, which refers to the fact that cities are converging toward a common level of GCR. However, due to differences in city-specific characteristics, such as population scale, population density, spatial scale, built-up areas, and economic growth, all cities may not converge to a common level, but may converge to different levels depending on city-specific characteristics; this is conditional β-convergence. The model for conditional β-convergence estimation can be specified by adding the appropriate conditioning variables that may affect the change in GCR over time to Equation (1). In this paper we chose the population (indicating the city scale), population density (indicating the compactness of the city), area of the city district (indicating the spatial scale of the city), the built-up area (indicating the spatial sprawl of the city), and the GDP per capita (indicating the economic growth) as the conditioning factors.
2.3. Data Source
The dataset of the municipal districts consists of 285 cities located in mainland China, including all prefecture-level and above cities (except Lhasa city and Chaohu city, due to the unavailability of data). All data relating to the indicators, including GCR, GDP, population, built-up area, and city area, were extracted from The China Urban Statistical Yearbook. Since we could only obtain all the required data on green space coverage for the 285 cities from the year 2002, this paper focuses on the time period of 2002–2012.
3. Results
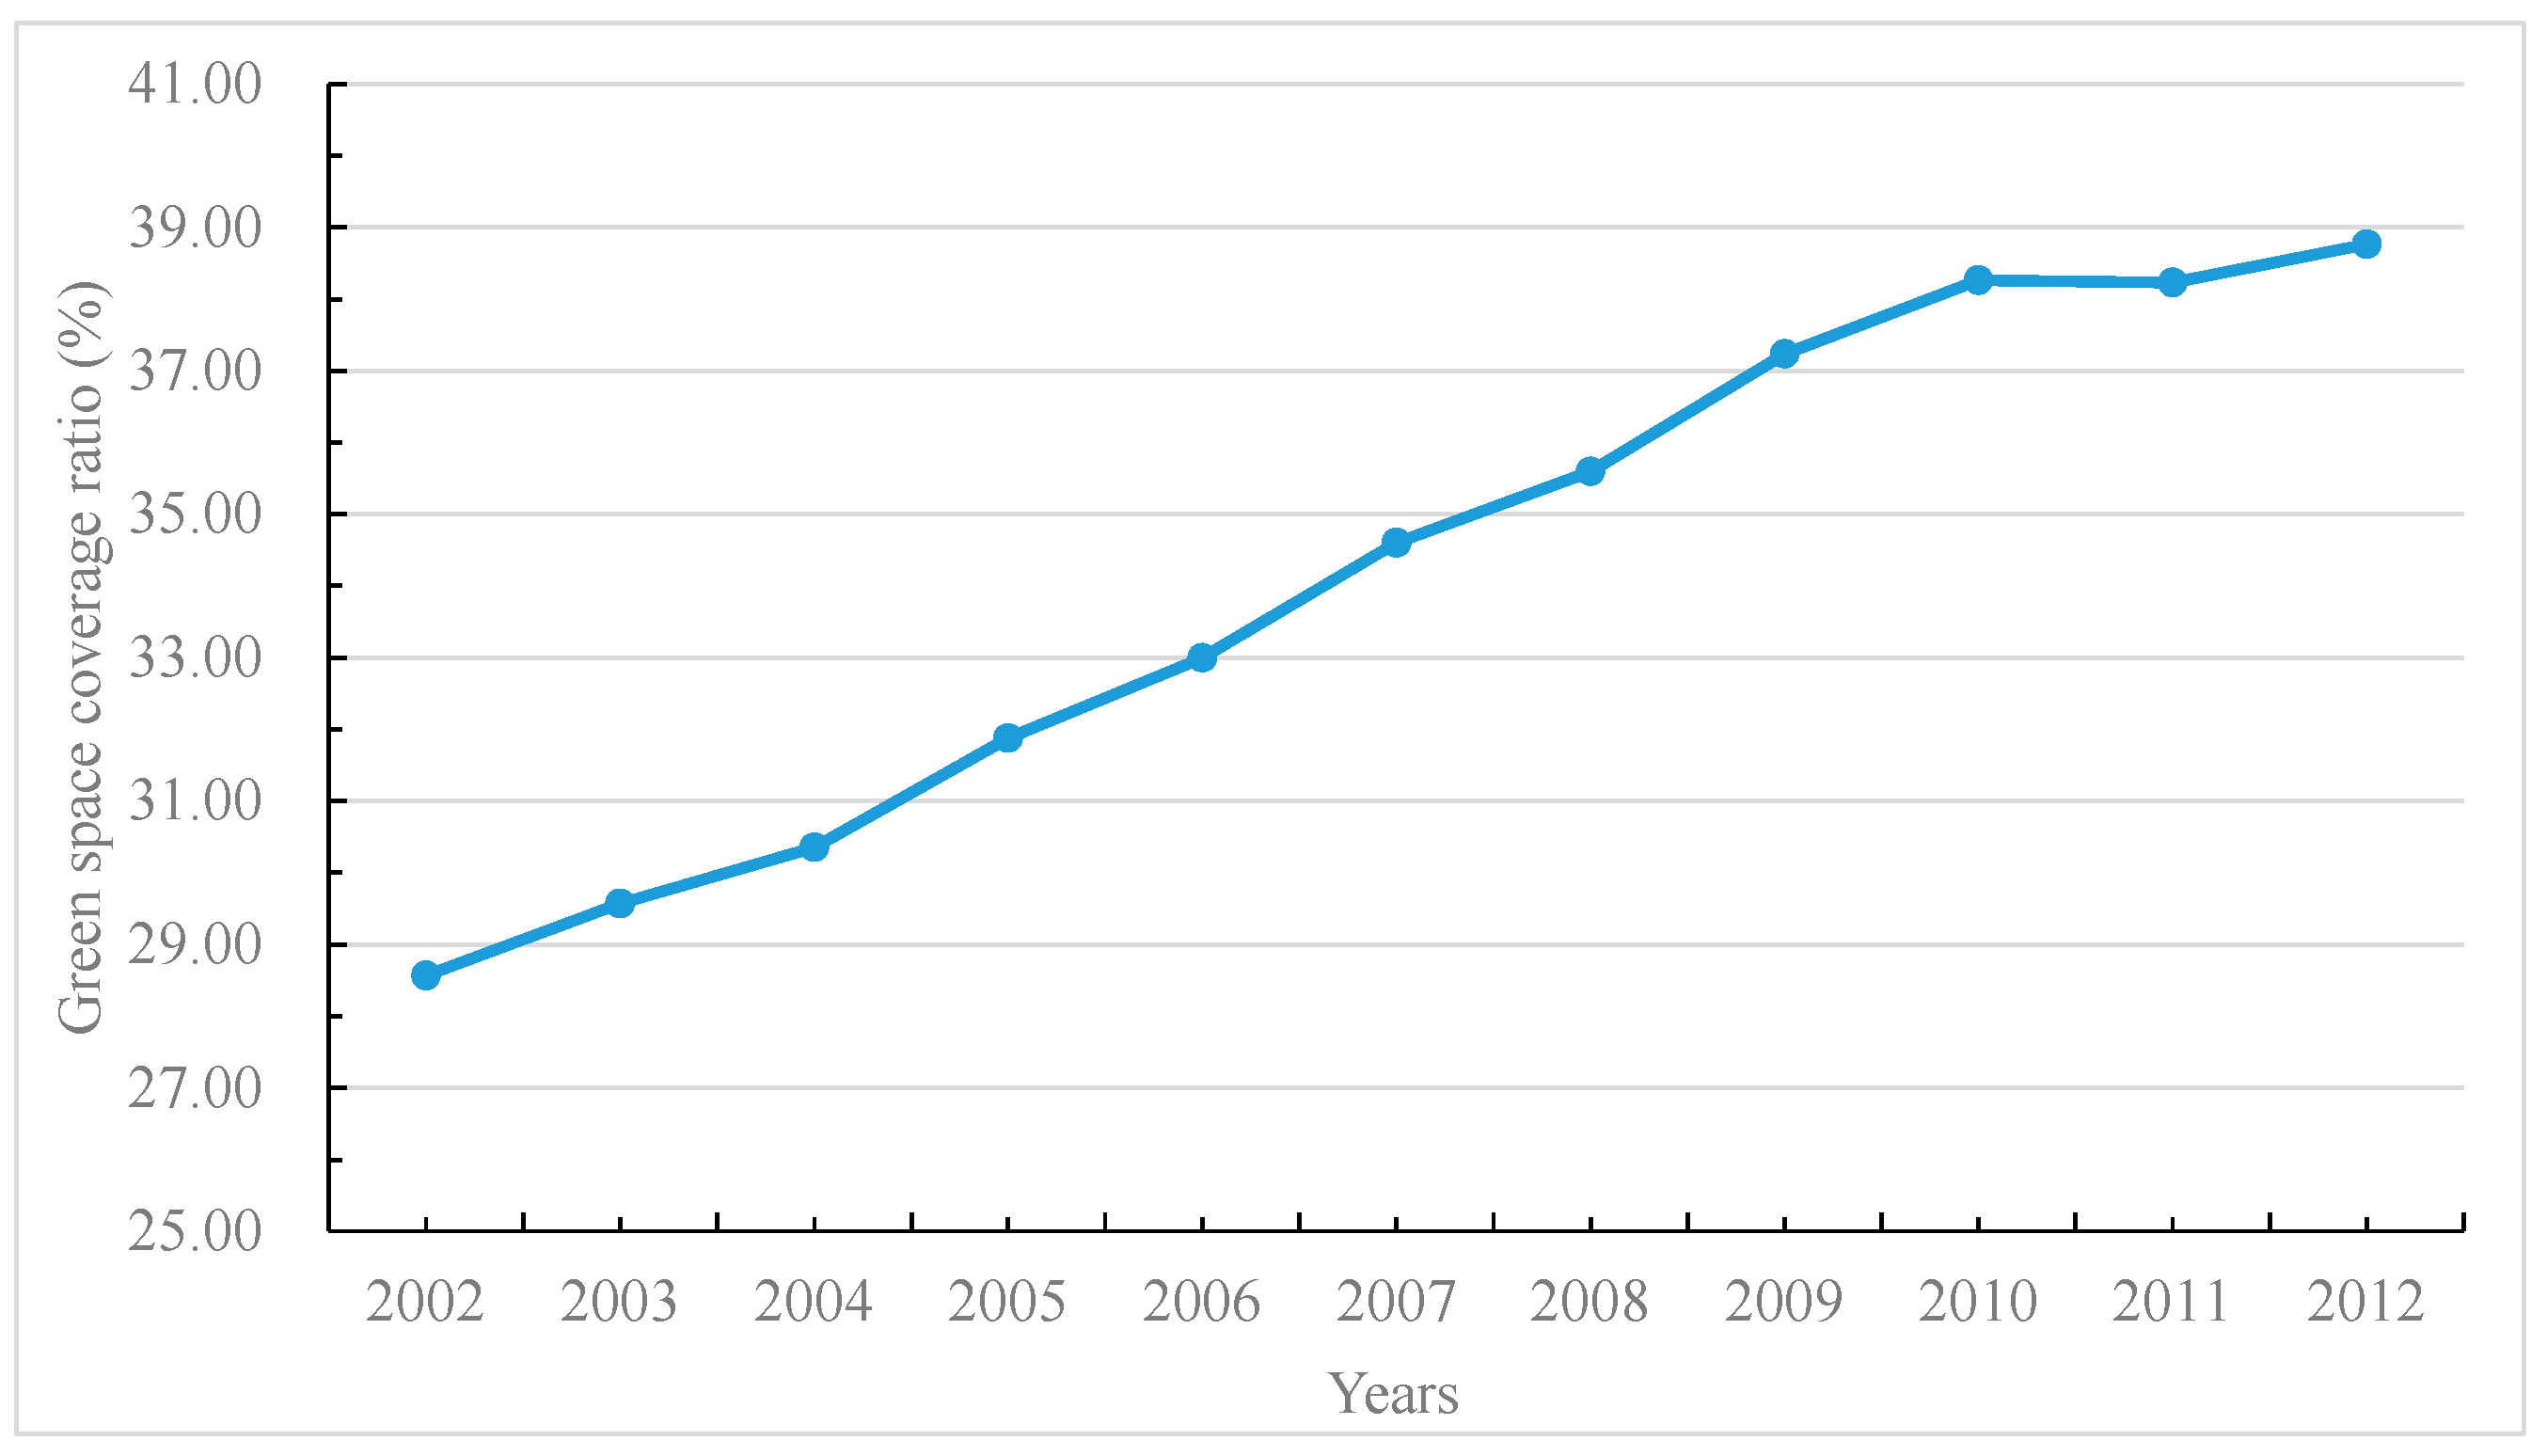
Figure 1 presents the temporal changes in average green space coverage of Chinese cities. For ease of comparison, the value of the GCR was standardized such that the value of the GCR for 2002 was set to equal to 100; that is, 2002=100 (Figure 1). Along with the fast economic growth and urbanization that occurred in China, the green space coverage ratio (GCR) has increased by 1.35 times since 2002.
3.1. Spatial Distribution
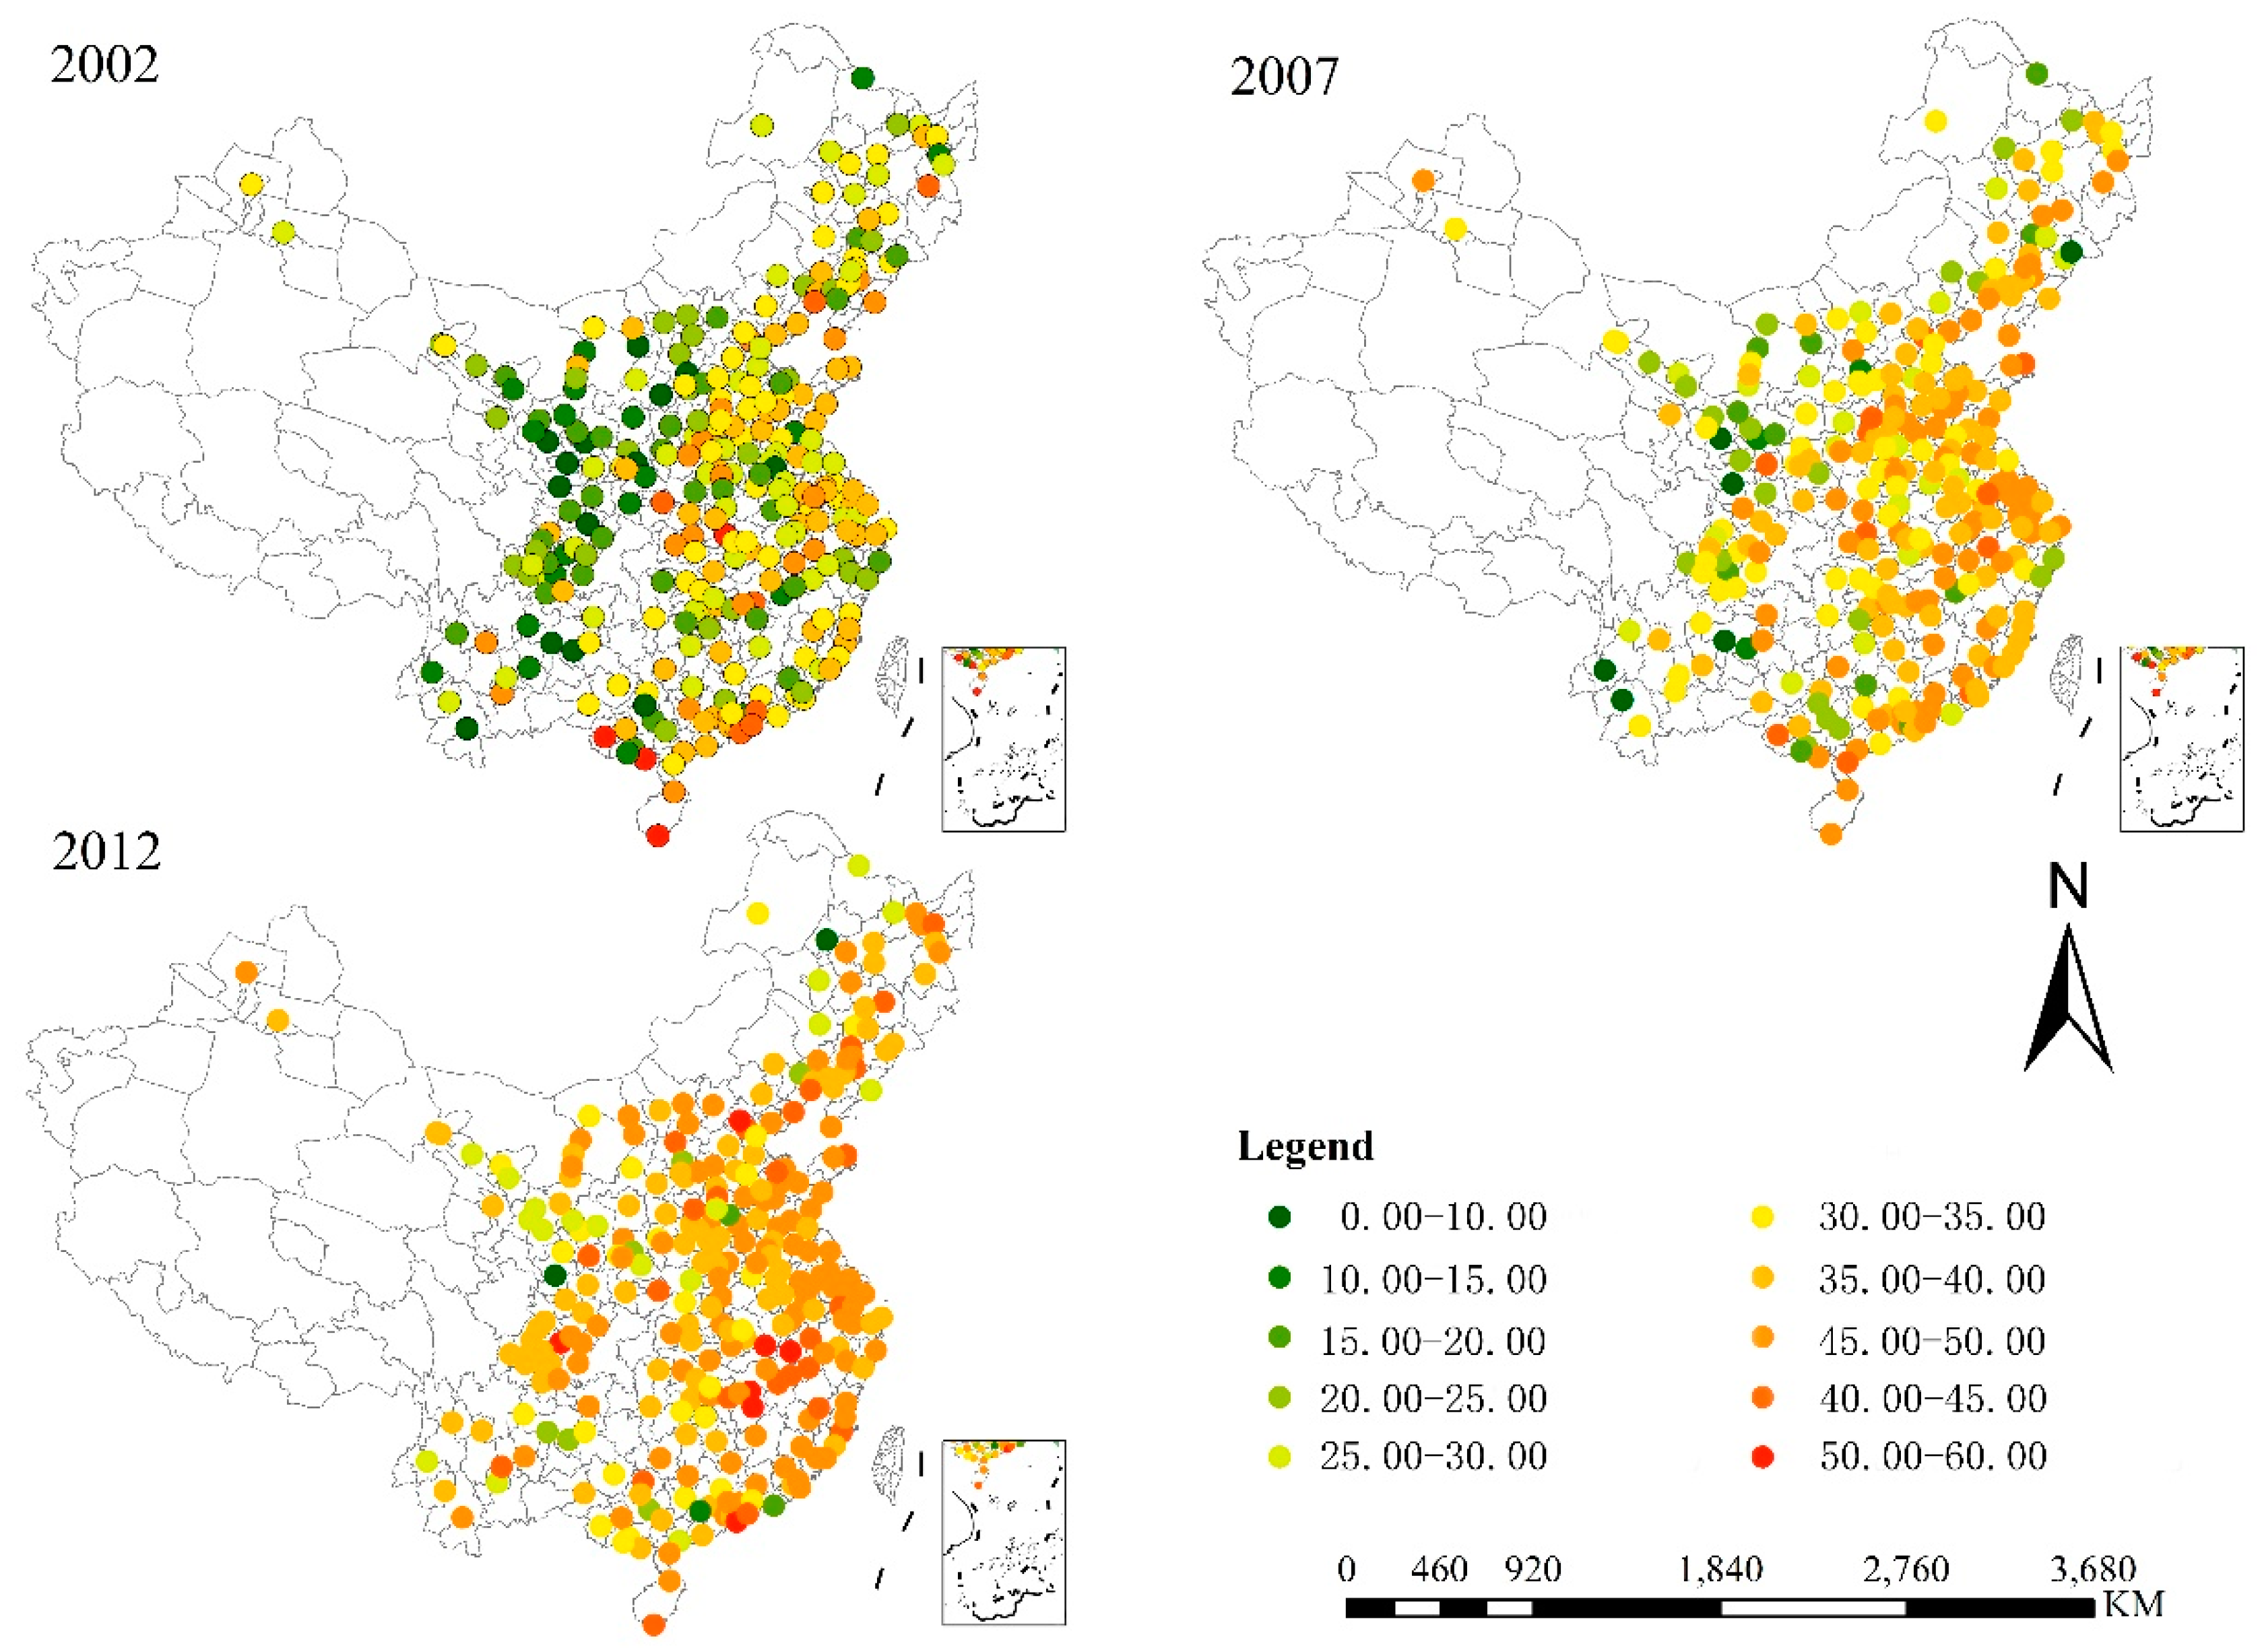
The 285 Chinese prefecture-level cities accounted for 1.26 billion (93% of the Chinese population) people, and the municipal districts of the 285 cities accounted for 0.401 billion inhabitants (30% of the Chinese population) in 2012. Green space coverage varied remarkably (averaging 28.6% and ranging from 1.06 to 57.9 in 2002; averaging 34.6% and ranging from 3.71 to 49.2 in 2007; averaging 38.6% and ranging from 2.98 to 57.1 in 2012) and showed a clear eastern tendency (Figure 2). Although the green space coverage in most of the cities has been substantially improved, the regional variation among Chinese cities formed a clear spatial pattern, with the highest level in eastern China, followed by central China, and decreasing into western China.
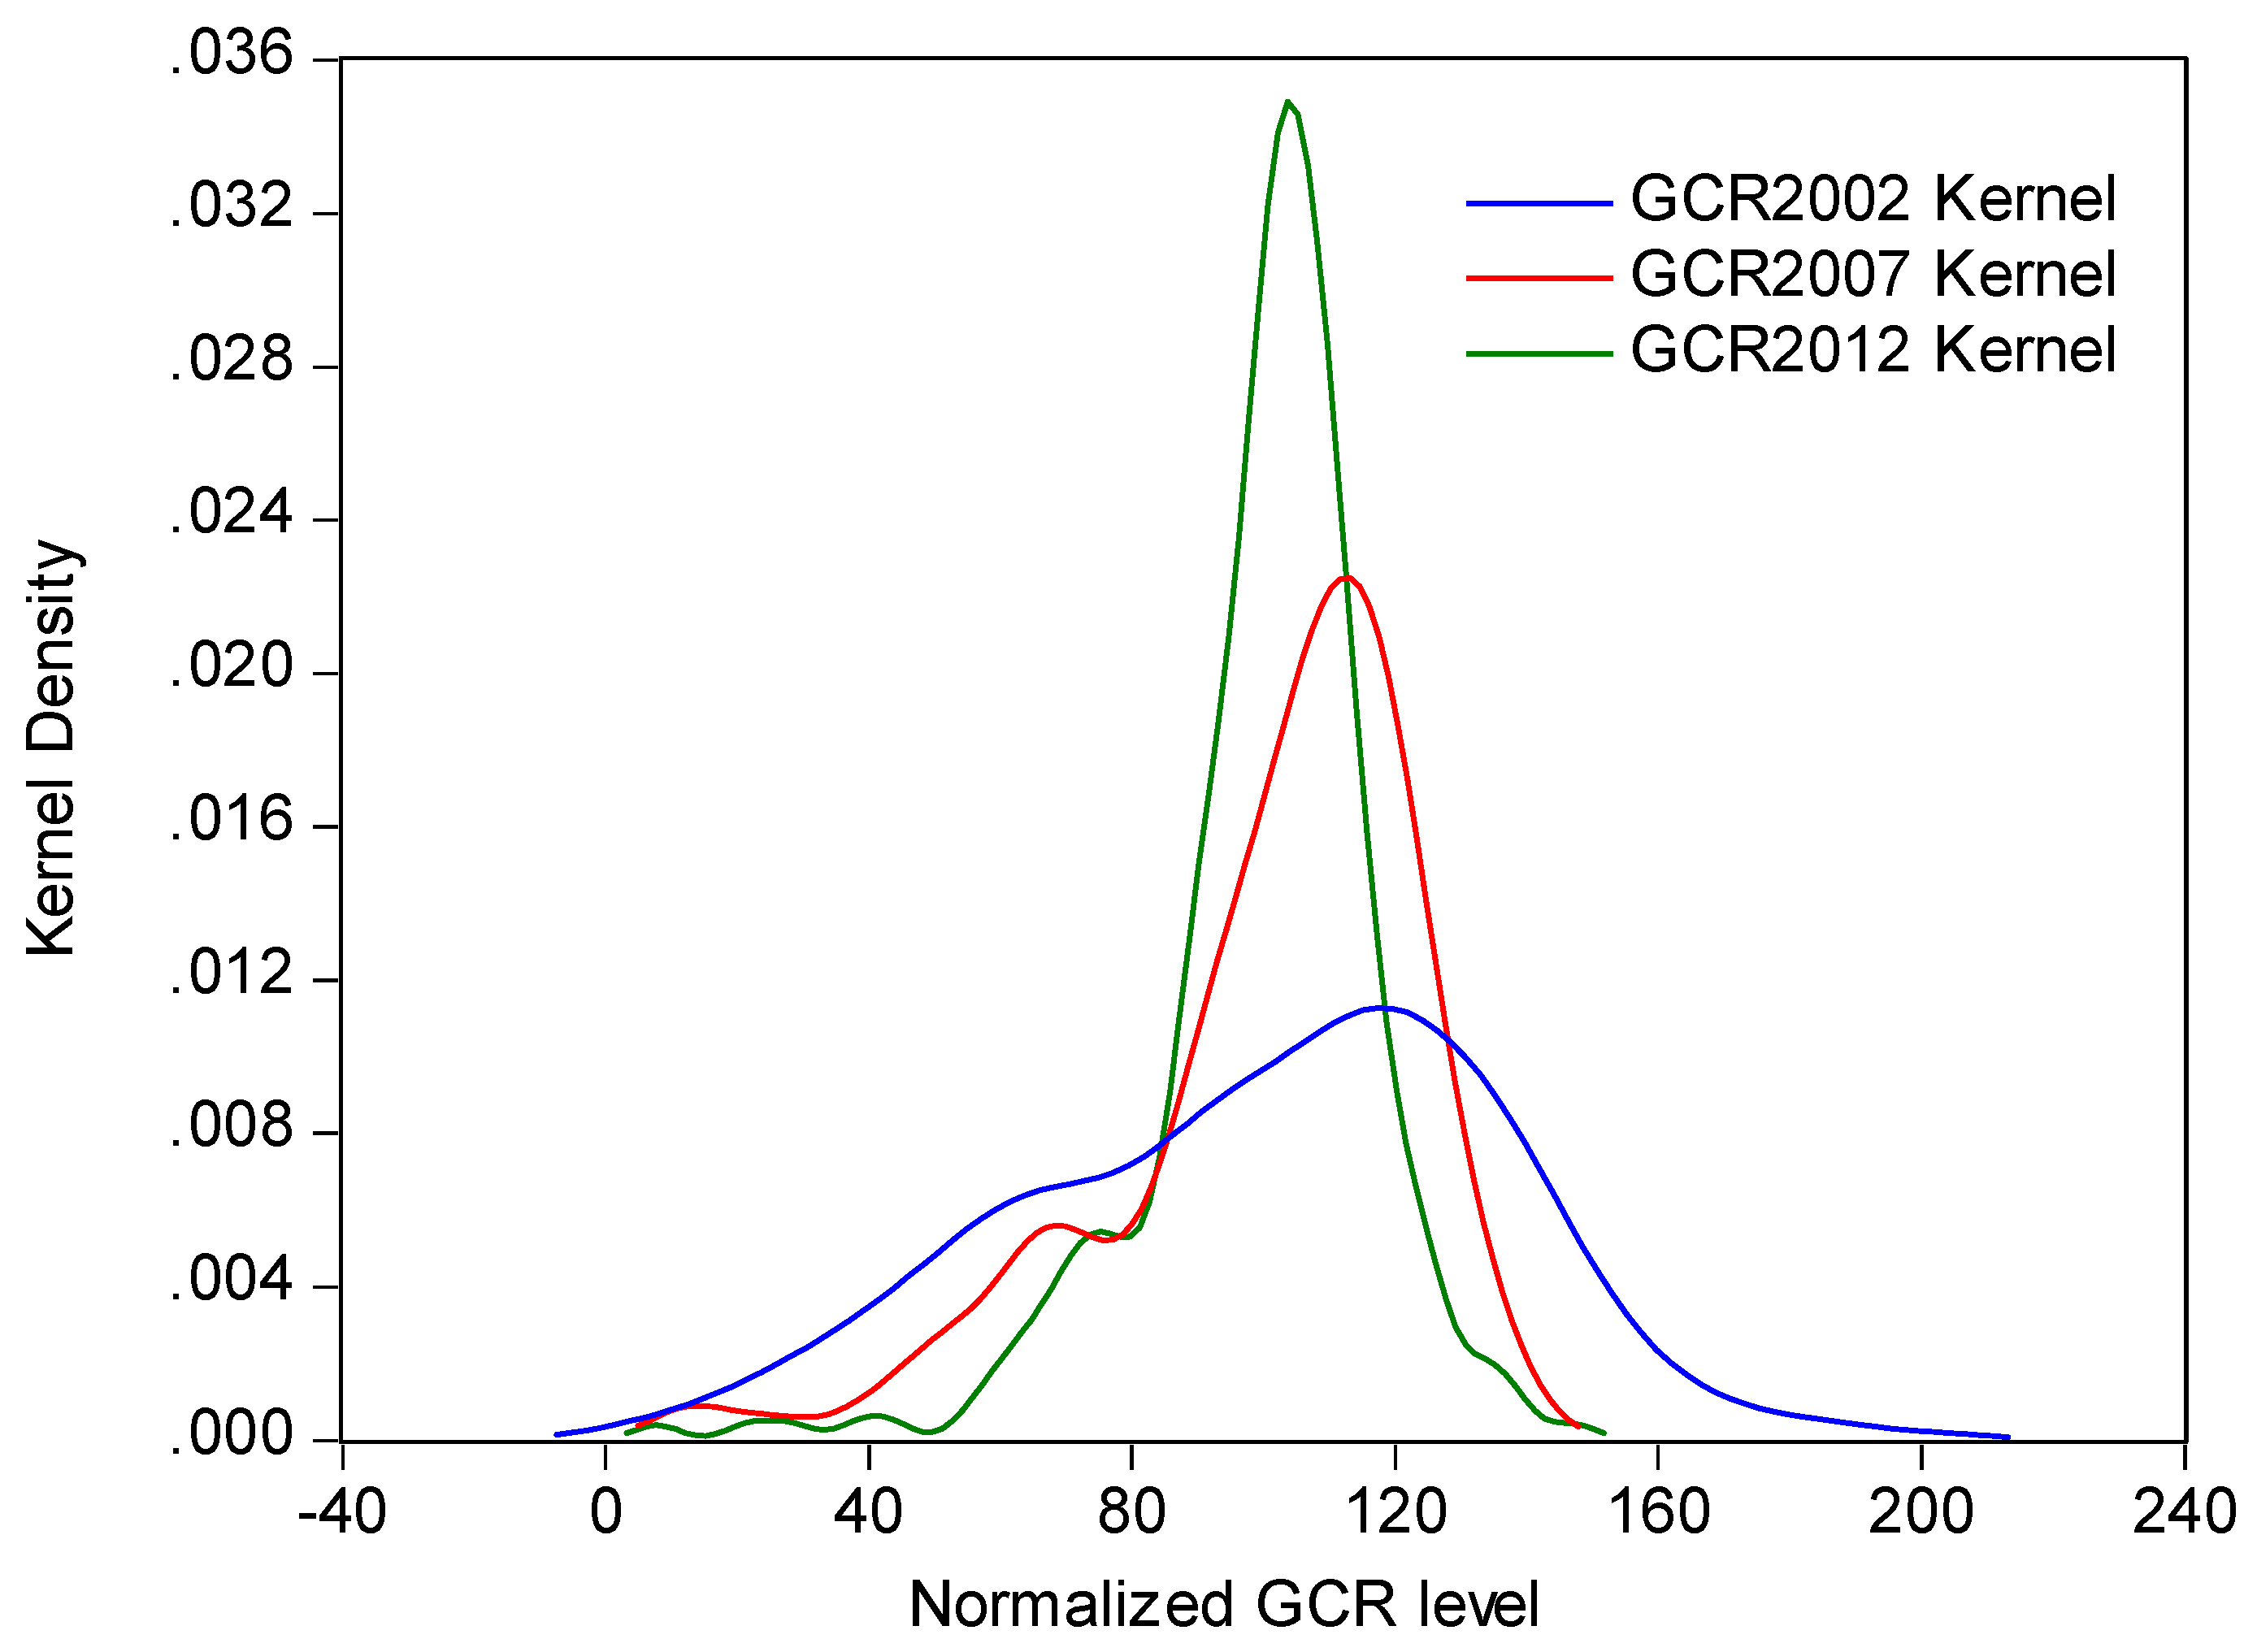
Figure 3 presents the density function for the GCR, which was estimated according to the kernel density estimation approach for three years (2002, 2007, and 2012), of the period 2002–2012. To remove the influence of changes in green coverage at the city level [39], we normalized each city’s level of GCR according to the average of the distribution for the years, and the average was assigned a value of 100. The probability mass of the GCR was concentrated around a low level, and the probability mass decreased from 120% to 104%. Meanwhile, the distance between both ends of the distribution shrank. The shift in the distribution of the GCR indicates the existence of a process of cross-city convergence (α-convergence) in the GCR. Specifically, the probability of finding values both at the lower end of the distribution (less than 80% of the average) and higher end of the distribution (higher than 150% of the average) has significantly decreased, while the probability of finding values around 104% of the average level has greatly increased. In short, the value of the GCR has converged to 104% of the average level.
3.2. Convergence Analysis
This paper attempted to discover whether the tendency of cross-city convergence in the GCR would remain statistically significant for China by applying multiple regression aims to test the unconditional (Column 1, Table 1) and conditional β-convergence phenomenon (Column 2, Table 1). To figure out if the cities in China are converging toward a common value for the GCR, we conducted a β-convergence test for China. The estimated coefficients are statistically significant at conventional levels (Table 1).
The negative value of the β-coefficient in Table 1 indicates that changes in the GCR appear to have a negative relationship with the levels in the base year (2002), and thus the value of the GCR converges to the base levels of value. The cross-city convergence in the GCR suggests that Chinese cities tend to be greener than before, and the inter-city inequity of the GCR is decreasing.
Our results show that unconditional cross-city β-convergence does exist for green space convergence in China. However, would the tendency of β-convergence in green space coverage still remain statistically significant when other potential factors are taken into account? That is, is there a conditional β-convergence phenomenon in Chinese cities? To figure out the answer to this question, we conducted a conditional β-convergence test (Column 2, Table 1).
The β-coefficients of the conditional convergence estimation are statistically significant at the 1% confidence level, and the coefficients of PD, AOB, and Y are significantly positive. This suggests that, when controlling the population density, built-up area, and per capital GDP, the convergence mechanism of green space across cities still exists. The negative value of β supports the hypothesis that lagging cities tend to catch up with advanced cities, with convergence tending to be conditional on city-specific characteristics. The higher value of the estimated coefficient compared with the unconditional convergence test model implies that the convergence speed is higher when socioeconomic factors are considered. The results of the conditional model confirmed that the factors of compactness of the city (PD), spatial sprawl (AOB), and economic growth (y) are significant for cross-city convergence. The positive value of the estimation coefficient indicates that more compact cities, cities possessing larger built-up areas, and wealthier cities are likely to converge to a higher level of GCR; that is, the three factors increased the improvement of the green coverage ratio and also had an auxiliary effect on the uneven inter-city GCR. In short, faster sprawling, more compact, and wealthier cities are likely to converge to higher level of green space coverage; the compactness of the city, urban sprawl, and economic growth may mitigate the convergence speed of the GCR.
3.3. Socioeconomic Drivers
Given that both unconditional and conditional convergence exist for green space coverage in China, the effects of conditional factors on cross-city convergence have been investigated. To explore the impact of conditional factors on the changes in green coverage space, we conducted a panel multiple regression analysis to estimate the impacts of socioeconomic factors, including the population scale, economic growth, spatial sprawl, and spatial scale of the city, and the compactness of the city (Column 3 in Table 1). The results verified that all the estimated coefficients of the factors are statistically significant (the factors of population scale (P), spatial sprawl (built-up areas, AOB), spatial scale (AOC), and economic growth (y) are significant at the 1% confidence level, and compactness of city (PD) is significant at the 10% confidence level). Although the estimated coefficient of the factor of economic growth is statistically significant, the value is zero, which indicates that economic growth has no direct impact on the changes in the GCR. When the other conditions are constant, a 1% increase of the population scale, built-up area, and spatial scale are associated with an 0.049% increase of the GCR, 0.136% drop of the GCR, and 0.036% increase of the GCR, respectively. Further, we also found a significant relationship between population density and the GCR (a 1% increase of the population density is associated with a 0.012% increase of the GCR).
4. Discussion
The green space coverage in Chinese cities was substantially improved between 2002 and 2012 due to the implementation of the National Garden City and National Ecological City Project, which mainly focused on the improvement of the level of green space provision. Alongside an unprecedented urbanization process, the green space coverage of cities in China has been substantially improved. However, after the year of 2010 which is the end of the tenth five-years plan of China and the urbanization rate exceeded 50%, the increasing rate of GCR has declined along with the rapid urbanization in China. This phenomenon indicated that the urbanization (by the way of sprawl or densification) greatly impacted on the provision of green space.
The spatial disparity of the green space coverage across Chinese cities is conspicuous due to the unbalanced development of different Chinese cities. Overall, the cities in eastern China show the highest level of green space coverage, followed by those in central China and western China. The spatial pattern of green space coverage is similar to the spatial pattern of economic growth and urbanization in China.
The study confirmed the existence of cross-city convergence in green space coverage in China. The absolute convergence in the GCR implies the decline in spatial disparity of green space provision (or green inequity) across Chinese cites. The convergence mechanism or distribution dynamics in green space coverage could be driven by different impact factors. According to the conditional convergence test, as noted in Section 3.2, the population density, built-up areas, and economic growth are the three main factors that have affected the evolution over time of the overall cross-city distribution of green space. Thus, increasing population density, expanding built-up areas, and improving the economic growth level will lead to an expansion of the gap in green space coverage across cities in China. The increasing population density or expanding built-up area indicate the city expand through densification or sprawl, i.e., the two different ways of urbanization. Thus, the expanding of the gaps in urbanization (whether urban sprawling or compacting) and economic level will lead to an increase in inequality of green space provision among cities.
Previous studies have shown that the changes in green space coverage were not driven by a single factor but the combined effects of urbanization and greening policies [66]. In our case, we found that the enlarging of the spatial scale of a city may lead to an increase in the GCR and expansion of the built-up areas, however, the expansion of built-up areas results in a decrease in the GCR. The economic growth has little impact on green space coverage, which suggests that economic development does not always lead to improvement in green space coverage, and China requires the design and implementation of specific policies, which have also been reported to contribute to the increase in the urban green space area [67,68] and to guarantee green space demand.
Combining the results of the conditional convergence test and socioeconomic drivers analysis, we found that an increasing level of urban compactness impedes cross-city convergence in the GCR and meanwhile leads to improvement of the GCR. The continual sprawling of built-up areas impedes cross-city convergence but leads to a decline in the GCR. Economic growth impedes convergence but has no effect on the GCR. These findings indicate that economic growth and urban sprawl cannot guarantee both urban sustainability and inter-city equity relative to green space coverage. Only compactness can guarantee both, which should be considered in the future direction of urban development.
5. Conclusions
This study is probably the first study of cross-city convergence in green space. The distribution dynamics of green space coverage across 285 cities were investigated, and we also explored the impacts of socioeconomic driving factors on the changes in green space coverage. The α-convergence test certified the existence of the shrinking process of spatial disparity across Chinese cities, and the level of green space coverage converged to 104% of the average level. The β-convergence estimation results also demonstrated the existence of unconditional and conditional convergence in green space coverage among Chinese cities, which indicated that cities with a low initial level of green space coverage tend to grow faster than cities with an initial high level; that is, the lagging cities tend to catch up with more advanced cities. Faster sprawling, more compact, and wealthier cities are more likely to converge to a higher level of green space coverage. Unbalanced economic growth, population density, and sprawling of built-up areas resulted in the expansion of the gap in green space coverage across cities in China. Both population growth and city spatial expansion contribute to green space coverage increases. The sprawling of built-up areas leads to a decrease of the green space coverage level, and economic growth has little impact on green space coverage, which suggests that economic development does not always lead to improvement of green space coverage, and China needs to design and implement series policies.
The cross-city convergence in environmental variables (such as green space coverage) could contribute to discovering the law of motion of distribution dynamics of environmental sustainability across cites, and provide crucial information for the design of policies regarding complex processes featured in the human–environment interactions in urban systems. Cities with a higher level of green space coverage have better environmental quality and a healthy ecological system, and therefore increasing pressure should be placed on policymakers to enact effective green space planning and management. For these cities, urban planning should carry out incremental green land planning on the premise of ensuring the stock of green space. For cities with less green space development, although the catch-up effect has already emerged, most of these cities are located in less developed regions (like central and western China) and have an urgent need to expand their built-up areas, which will lead to a decrease in the level of green space coverage. Therefore, for these cities, future urban planning should pay more attention to ensuring enough public green space and should introduce mandatory quantitative indicators to ensure green land is maintained in and around the built-up areas.
Author Contributions
Conceptualization, Y.J.W. and B.X.; methodology, Z.L.Z.; software, C.Y.L.; validation, Y.J.W. and Z.L.Z.; formal analysis, Y.J.W.; data curation, C.Y.L.; writing—original draft preparation, Y.J.W. and Z.L.Z.; writing—review and editing, X.P.C., Z.L.Z., and B.X.; supervision, X.P.C.
Funding
This research was funded by the National Key R&D Program of China (2018YFC0704702); Natural Science Foundation of China (41301652); the Fundamental Research Funds for Central Universities (lzujbky-2018–137); International Postdoctoral Exchange Fellowship Program under China Postdoctoral Council (2014–0050); and the CAS Youth Innovation Promotion Association (2016181).
Acknowledgments
The authors wish to thank the anonymous reviewers for their helpful comments.
Conflicts of Interest
The authors declare no conflict of interest.
References
- Heilig, G.K. World Urbanization Prospects the 2011 Revision; Population Estimates and Projections Section, Population Division, Department of Economic and Social Affairs (DESA), United Nations: New York, NY, USA, 2012. [Google Scholar]
- Baycan-Levent, T.; Vreeker, R.; Nijkamp, P. A multi-criteria evaluation of green spaces in european cities. Eur. Urban. Reg. Stud. 2009, 16, 193–213. [Google Scholar] [CrossRef]
- Astell-Burt, T.; Feng, X.Q.; Mavoa, S.; Badland, H.M.; Giles-Corti, B. Do low-income neighbourhoods have the least green space? A cross-sectional study of australia’s most populous cities. BMC Public Health 2014, 14, 11. [Google Scholar] [CrossRef]
- Bolund, P.; Hunhammar, S. Ecosystem services in urban areas. Ecol. Econ. 1999, 29, 293–301. [Google Scholar] [CrossRef]
- Makhelouf, A. The effect of green spaces on urban climate and pollution. Iran. J. Environ. Health Sci. Eng. 2009, 6, 35–40. [Google Scholar]
- Jim, C.Y.; Chen, W.Y. Assessing the ecosystem service of air pollutant removal by urban trees in Guangzhou (China). J. Environ. Manag. 2008, 88, 665–676. [Google Scholar] [CrossRef]
- Ng, E.; Chen, L.; Wang, Y.N.; Yuan, C. A study on the cooling effects of greening in a high-density city: An experience from hong kong. Build. Environ. 2012, 47, 256–271. [Google Scholar] [CrossRef]
- Bowler, D.E.; Buyung-Ali, L.; Knight, T.M.; Pullin, A.S. Urban greening to cool towns and cities: A systematic review of the empirical evidence. Landsc. Urban. Plan. 2010, 97, 147–155. [Google Scholar] [CrossRef]
- Zhang, B.; Li, N.; Wang, S. Effect of urban green space changes on the role of rainwater runoff reduction in beijing, china. Landsc. Urban. Plan. 2015, 140, 8–16. [Google Scholar] [CrossRef]
- Gomez-Baggethun, E.; Barton, D.N. Classifying and valuing ecosystem services for urban planning. Ecol. Econ. 2013, 86, 235–245. [Google Scholar] [CrossRef]
- Richardson, E.A.; Mitchell, R.; Hartig, T.; de Vries, S.; Astell-Burt, T.; Frumkin, H. Green cities and health: A question of scale? J. Epidemiol. Community Health 2012, 66, 160–165. [Google Scholar] [CrossRef]
- Wolch, J.R.; Byrne, J.; Newell, J.P. Urban green space, public health, and environmental justice: The challenge of making cities ‘just green enough’. Landsc. Urban. Plan. 2014, 125, 234–244. [Google Scholar] [CrossRef]
- Pan, H.; Page, J.; Zhang, L.; Chen, S.; Cong, C.; Destouni, G.; Kalantari, Z.; Deal, B. Using comparative socio-ecological modeling to support climate action planning (cap). J. Clean. Prod. 2019, 232, 30–42. [Google Scholar] [CrossRef]
- Fuller, R.A.; Gaston, K.J. The scaling of green space coverage in european cities. Biol. Lett. 2009, 5, 352–355. [Google Scholar] [CrossRef] [PubMed]
- Kanniah, K.D. Quantifying green cover change for sustainable urban planning: A case of kuala lumpur, malaysia. Urban. For. Urban. Green. 2017, 27, 287–304. [Google Scholar] [CrossRef]
- Sharifi, A.; Hosseingholizadeh, M. The effect of rapid population growth on urban expansion and destruction of green space in tehran from 1972 to 2017. J. Indian Soc. Remote Sens. 2019, 47, 1063–1071. [Google Scholar] [CrossRef]
- Dlugonski, A.; Szumanski, M. Analysis of green infrastructure in lodz, poland. J. Urban. Plan. Dev. 2015, 141, 9. [Google Scholar] [CrossRef]
- Tan, P.Y.; Wang, J.; Sia, A. Perspectives on five decades of the urban greening of singapore. Cities 2013, 32, 24–32. [Google Scholar] [CrossRef]
- Li, F.Z.; Zhang, F.; Li, X.; Wang, P.; Liang, J.H.; Mei, Y.T.; Cheng, W.W.; Qian, Y. Spatiotemporal patterns of the use of urban green spaces and external factors contributing to their use in central beijing. Int. J. Environ. Res. Public Health 2017, 14, 17. [Google Scholar] [CrossRef]
- Li, W.F.; Bai, Y.; Zhou, W.Q.; Han, C.M.; Han, L.J. Land use significantly affects the distribution of urban green space: Case study of shanghai, china. J. Urban. Plan. Dev. 2015, 141, 9. [Google Scholar] [CrossRef]
- Lin, B.; Meyers, J.; Barnett, G. Understanding the potential loss and inequities of green space distribution with urban densification. Urban. For. Urban. Green. 2015, 14, 952–958. [Google Scholar] [CrossRef]
- Cetin, M. Using gis analysis to assess urban green space in terms of accessibility: Case study in kutahya. Int. J. Sustain. Dev. World Ecol. 2015, 22, 420–424. [Google Scholar] [CrossRef]
- Higgs, G.; Fry, R.; Langford, M. Investigating the implications of using alternative gis-based techniques to measure accessibility to green space. Environ. Plan. B Plan. Des. 2012, 39, 326–343. [Google Scholar] [CrossRef]
- Nesbitt, L.; Meitner, M.J.; Sheppard, S.R.J.; Girling, C. The dimensions of urban green equity: A framework for analysis. Urban. For. Urban. Green. 2018, 34, 240–248. [Google Scholar] [CrossRef]
- Chen, W.Y. The role of urban green infrastructure in offsetting carbon emissions in 35 major chinese cities: A nationwide estimate. Cities 2015, 44, 112–120. [Google Scholar] [CrossRef]
- Chen, M.; Dai, F.; Yang, B.; Zhu, S.W. Effects of neighborhood green space on pm2.5 mitigation: Evidence from five megacities in china. Build. Environ. 2019, 156, 33–45. [Google Scholar] [CrossRef]
- Cai, Y.B.; Chen, Y.H.; Tong, C. Spatiotemporal evolution of urban green space and its impact on the urban thermal environment based on remote sensing data: A case study of fuzhou city, china. Urban. For. Urban. Green. 2019, 41, 333–343. [Google Scholar] [CrossRef]
- Lee, A.C.K.; Maheswaran, R. The health benefits of urban green spaces: A review of the evidence. J. Public Health 2011, 33, 212–222. [Google Scholar] [CrossRef]
- Liquete, C.; Kleeschulte, S.; Dige, G.; Maes, J.; Grizzetti, B.; Olah, B.; Zulian, G. Mapping green infrastructure based on ecosystem services and ecological networks: A pan-european case study. Environ. Sci. Policy 2015, 54, 268–280. [Google Scholar] [CrossRef]
- Yang, J.; Huang, C.H.; Zhang, Z.Y.; Wang, L. The temporal trend of urban green coverage in major chinese cities between 1990 and 2010. Urban. For. Urban. Green. 2014, 13, 19–27. [Google Scholar] [CrossRef]
- Chen, W.Y.; Wang, D.T. Economic development and natural amenity: An econometric analysis of urban green spaces in china. Urban. For. Urban. Green. 2013, 12, 435–442. [Google Scholar] [CrossRef]
- Kabisch, N.; Haase, D. Green spaces of european cities revisited for 1990–2006. Landsc. Urban. Plan. 2013, 110, 113–122. [Google Scholar] [CrossRef]
- Zhao, J.J.; Chen, S.B.; Jiang, B.; Ren, Y.; Wang, H.; Vause, J.; Yu, H.D. Temporal trend of green space coverage in china and its relationship with urbanization over the last two decades. Sci. Total Environ. 2013, 442, 455–465. [Google Scholar] [CrossRef] [PubMed]
- Richards, D.R.; Passy, P.; Oh, R.R.Y. Impacts of population density and wealth on the quantity and structure of urban green space in tropical southeast asia. Landsc. Urban. Plan. 2017, 157, 553–560. [Google Scholar] [CrossRef]
- Mulder, P.; de Groot, H.L.F.; Pfeiffer, B. Dynamics and determinants of energy intensity in the service sector: A cross-country analysis, 1980–2005. Ecol. Econ. 2014, 100, 1–15. [Google Scholar] [CrossRef]
- Ezcurra, R. Distribution dynamics of energy intensities: A cross-country analysis. Energy Policy 2007, 35, 5254–5259. [Google Scholar] [CrossRef]
- Portnou, B.A.; Meir, I. Urban water consumption in israel: Convergence or divergence? Environ. Sci. Policy 2008, 11, 347–358. [Google Scholar] [CrossRef]
- Bassetti, T.; Benos, N.; Karagiannis, S. Co2 emissions and income dynamics: What does the global evidence tell us? Environ. Resour. Econ. 2013, 54, 101–125. [Google Scholar] [CrossRef]
- Ezcurra, R. Is there cross-country convergence in carbon dioxide emissions? Energy Policy 2007, 35, 1363–1372. [Google Scholar] [CrossRef]
- Huang, G.; Ouyang, X.; Yao, X. Dynamics of china’s regional carbon emissions under gradient economic development mode. Ecol. Indic. 2015, 51, 197–204. [Google Scholar] [CrossRef]
- Camarero, M.; Castillo, J.; Picazo-Tadeo, A.J.; Tamarit, C. Eco-efficiency and convergence in oecd countries. Environ. Resour. Econ. 2013, 55, 87–106. [Google Scholar] [CrossRef]
- Chen, X. Beyond the reach of globalization: China’s border regions and cities in transition. Glob. Chin. City 2006, 21–46. [Google Scholar]
- Pan, H.; Zhang, L.; Cong, C.; Deal, B.; Wang, Y. A dynamic and spatially explicit modeling approach to identify the ecosystem service implications of complex urban systems interactions. Ecol. Indic. 2019, 102, 426–436. [Google Scholar] [CrossRef]
- Herrerias, M.J. World energy intensity convergence revisited: A weighted distribution dynamics approach. Energy Policy 2012, 49, 383–399. [Google Scholar] [CrossRef]
- Silverman, B.W. Density Estimation for Statistics and Data Analysis; CRC press: Boca Raton, FL, USA, 1986; Volume 26. [Google Scholar]
- Islam, N. What have we learnt from the convergence debate? J. Econ. Surv. 2003, 17, 309–362. [Google Scholar] [CrossRef]
- Abreu, M.A.; de Groot, H.L.F.; Florax, R. A meta-analysis of beta-convergence: The legendary 2%. J. Econ. Surv. 2005, 19, 389–420. [Google Scholar] [CrossRef]
- Mohammadi, H.; Ram, R. Cross-country convergence in energy and electricity consumption, 1971–2007. Energy Econ. 2012, 34, 1882–1887. [Google Scholar] [CrossRef]
- Miketa, A.; Mulder, P. Energy productivity across developed and developing countries in 10 manufacturing sectors: Patterns of growth and convergence. Energy Econ. 2005, 27, 429–453. [Google Scholar] [CrossRef]
- Maza, A.; Villaverde, J. The world per capita electricity consumption distribution: Signs of convergence? Energy Policy 2008, 36, 4255–4261. [Google Scholar] [CrossRef]
- Sun, C.Z.; Zhao, L.S.; Zou, W.; Zheng, D.F. Water resource utilization efficiency and spatial spillover effects in china. J. Geogr. Sci. 2014, 24, 771–788. [Google Scholar] [CrossRef]
- Criado, C.O.; Valente, S.; Stengos, T. Growth and pollution convergence: Theory and evidence. J. Environ. Econ. Manag. 2011, 62, 199–214. [Google Scholar] [CrossRef] [Green Version]
- Huang, B.; Meng, L.N. Convergence of per capita carbon dioxide emissions in urban china: A spatio-temporal perspective. Appl. Geogr. 2013, 40, 21–29. [Google Scholar] [CrossRef]
- Herrerias, M.J. The environmental convergence hypothesis: Carbon dioxide emissions according to the source of energy. Energy Policy 2013, 61, 1140–1150. [Google Scholar] [CrossRef]
- Westerlund, J.; Basher, S.A. Testing for convergence in carbon dioxide emissions using a century of panel data. Environ. Resour. Econ. 2008, 40, 109–120. [Google Scholar] [CrossRef]
- Panopoulou, E.; Pantelidis, T. Club convergence in carbon dioxide emissions. Environ. Resour. Econ. 2009, 44, 47–70. [Google Scholar] [CrossRef]
- Bimonte, S. Growth and environmental quality: Testing the double convergence hypothesis. Ecol. Econ. 2009, 68, 2406–2411. [Google Scholar] [CrossRef]
- Pinto, V.G.; Heller, L.; Bastos, R.K.X. Drinking water standards in south american countries: Convergences and divergences. J. Water Health 2012, 10, 295–310. [Google Scholar] [CrossRef] [PubMed]
- Brown, M.T.; Cohen, M.J.; Sweeney, S. Predicting national sustainability: The convergence of energetic, economic and environmental realities. Ecol. Model. 2009, 220, 3424–3438. [Google Scholar] [CrossRef]
- Camarero, M.; Picazo-Tadeo, A.J.; Tamarit, C. Is the environmental performance of industrialized countries converging? A ‘sure’ approach to testing for convergence. Ecol. Econ. 2008, 66, 653–661. [Google Scholar] [CrossRef]
- Camarero, M.; Castillo-Gimenez, J.; Picazo-Tadeo, A.J.; Tamarit, C. Is eco-efficiency in greenhouse gas emissions converging among european union countries? Empir. Econ. 2014, 47, 143–168. [Google Scholar] [CrossRef]
- Saluati, L.; Zitti, M. Regional convergence of environmental variables: Empirical evidences from land degradation. Ecol. Econ. 2008, 68, 162–168. [Google Scholar] [CrossRef]
- Martin, R. Emu versus the regions? Regional convergence and divergence in euroland. J. Econ. Geogr. 2001, 1, 51–80. [Google Scholar] [CrossRef]
- Sala-i-Martin, X.X. Regional cohesion: Evidence and theories of regional growth and convergence. Eur. Econ. Rev. 1996, 40, 1325–1352. [Google Scholar] [CrossRef]
- Robert, B.J.; Sala-i-Martin, X. Convergence. J. Political Econ. 1992, 100, 223–351. [Google Scholar]
- Gan, M.Y.; Deng, J.S.; Zheng, X.Y.; Hong, Y.; Wang, K. Monitoring urban greenness dynamics using multiple endmember spectral mixture analysis. PLoS ONE 2014, 9, 12. [Google Scholar] [CrossRef] [PubMed]
- Kong, F.H.; Nakagoshi, N. Spatial-temporal gradient analysis of urban green spaces in jinan, china. Landsc. Urban. Plan. 2006, 78, 147–164. [Google Scholar] [CrossRef]
- Zhou, X.; Wang, Y.C. Spatial–temporal dynamics of urban green space in response to rapid urbanization and greening policies. Landsc. Urban. Plan. 2011, 100, 268–277. [Google Scholar] [CrossRef]
Figure 1.
The changes in average green space coverage (GCR) of Chinese cities, 2002–2012 (year 2002=100).
Figure 1.
The changes in average green space coverage (GCR) of Chinese cities, 2002–2012 (year 2002=100).

Figure 2.
The spatial distribution of the green space coverage ratio (GCR) in China (2002, 2007, and 2012).
Figure 2.
The spatial distribution of the green space coverage ratio (GCR) in China (2002, 2007, and 2012).

Figure 3.
Shifts in the distribution of the GCR for Chinese cities.


Table 1.
The estimation results of the cross-city convergence test and the socioeconomic driving factors.
Table 1.
The estimation results of the cross-city convergence test and the socioeconomic driving factors.
| Model 1 | Model 2 | Model 3 | ||||
|---|---|---|---|---|---|---|
| Coefficient | t-stat | Coefficient | t-stat | Coefficient | t-stat | |
| β | –0.424*** | –39.323 | –0.446*** | –33.035 | ||
| P | 0.008 | 0.340 | 0.049*** | 2.995 | ||
| PD | 0.014** | 2.046 | 0.012* | 1.795 | ||
| AOB | 0.068*** | 7.262 | –0.136*** | –12.115 | ||
| AOC | 0.009 | 0.815 | 0.036*** | 3.271 | ||
| Y | 0.039*** | 8.748 | 0.000*** | 7.601 | ||
| C | 1.504*** | 40.354 | 0.719*** | 8.208 | 3.539*** | 59.057 |
| AR(1) | 0.613*** | 48.694 | ||||
| R2 | 0.407 | 0.357 | 0.832 | |||
| F-test | 5.465 | 4.891 | 43.770 | |||
| D-W stat | 2.006 | 2.466 | 2.096 | |||
Notes: Model 1 is the unconditional convergence test model, Model 2 is the conditional convergence test model, and Model 3 is the model for socioeconomic drivers analysis; the symbol *, ** and *** denote statistical significance at the 10%, 5% and 1% level.
© 2019 by the authors. Licensee MDPI, Basel, Switzerland. This article is an open access article distributed under the terms and conditions of the Creative Commons Attribution (CC BY) license (http://creativecommons.org/licenses/by/4.0/).
Share and Cite
MDPI and ACS Style
Wang, Y.; Chen, X.; Zhang, Z.; Xue, B.; Lu, C. Cross-City Convergence in Urban Green Space Coverage in China. Sustainability 2019, 11, 4707. https://doi.org/10.3390/su11174707
AMA Style
Wang Y, Chen X, Zhang Z, Xue B, Lu C. Cross-City Convergence in Urban Green Space Coverage in China. Sustainability. 2019; 11(17):4707. https://doi.org/10.3390/su11174707
Chicago/Turabian StyleWang, Yueju, Xingpeng Chen, Zilong Zhang, Bing Xue, and Chenyu Lu. 2019. "Cross-City Convergence in Urban Green Space Coverage in China" Sustainability 11, no. 17: 4707. https://doi.org/10.3390/su11174707
Note that from the first issue of 2016, this journal uses article numbers instead of page numbers. See further details here.