Methane Emissions From the Salt Marshes of Doñana Wetlands: Spatio-Temporal Variability and Controlling Factors
 I. Emma Huertas
 Mercedes de la Paz
 Fiz F. Perez3
  Gabriel Navarro
- 1Instituto de Ciencias Marinas de Andalucía, CSIC, Puerto Real, Spain
- 2Centro Oceanográfico de A Coruña, Instituto Español de Oceanografía (IEO), A Coruña, Spain
- 3Instituto de Investigaciones Marinas, CSIC, Vigo, Spain
- 4Instituto Mediterráneo de Estudios Avanzados, IMEDEA-CSIC, Esporles, Spain
Coastal wetlands are significant sources of methane in the atmosphere, but emissions in these ecosystems are still poorly quantified, as in situ data are limited. In this study, we present the first assessment of spatio-temporal changes in air-water CH4 fluxes in the salt marshes of the Doñana wetlands (SW Spain), one of the most emblematic protected areas in Europe, due to its high biotic diversity and unique importance for aquatic wildfowl. The marshes are flooded by estuarine waters from the adjacent Guadalquivir River by tidal intrusion, which influences aquatic CH4 dynamics by changing salinity and water chemistry which affects sedimentary methanogenesis. During sixteen samplings, conducted between March 2016 and March 2018, surface water CH4 concentrations were measured using static-head space equilibration gas chromatography in seven sites representing salt marshes located in the land strip close to the estuary. Because of meteorological conditions and tide variations, salinity markedly changed across the salt marshes, although sites located closer to the river mouth could be categorized as polyhaline marshes whereas upstream sites formed a group of mesohaline marshes. The CH4 saturation range was 252–36,735% (average 5,170%) and 374–620,007% (average 31,541%) in polyhaline and mesohaline marshes, respectively, suggesting the inhibitory effect of sulfate on methanogenesis, although a linear trend between dissolved CH4 concentration and salinity was not observed. In contrast, water temperature and chlorophyll a were significantly and positively correlated with methane, indicating sedimentary methanogenesis control by temperature, and organic matter availability boosted by primary productivity. This does not exclude the possibility that some CH4 might also come from estuarine inputs. Air-water CH4 fluxes ranged from 2.6 to 720 μmol m−2d−1 (average 104 μmol m−2 d−1) in the polyhaline marshes and from 5.6 to 12,715 μmol m−2d−1 (average 637 μmol m−2 d−1) in the mesohaline marshes, with higher emissions measured during the summer months in all sites. Even though the strongest environmental drivers of dissolved CH4 accumulation seemed to be temperature and productivity, the spatio-temporal patterns observed suggest that methane dynamics in the Doñana salt marshes are controlled by a mosaic of processes rather than by a single environmental force.
Introduction
Wetlands are the largest global source of the potent greenhouse gas methane, with an estimated annual emission to the atmosphere of 160–210 Tg (Kirschke et al., 2013). In fact, the increase in atmospheric methane concentration measured over the last decade is partially attributed to the rise in the emissions from tropical wetlands, in response to positive rainfall anomalies (Nisbet et al., 2016). If this type of biogenic source continues to grow, the expected rise in atmospheric methane concentration will be beyond the largest events recorded during the last millennium (Nisbet et al., 2016). Therefore, because of their relevant role in the global methane budget, wetlands, and inland waters are likely to drive the methane climate feedback from natural settings in the coming century (Dean et al., 2018). Measuring methane fluxes in these environments is therefore essential to accurately constrain the global methane budget and to understand feedback to the climate system (Kirschke et al., 2013; Dean et al., 2018).
In aquatic systems, methane is mainly generated microbially in anoxic sediments and escapes to the overlying water column where it can be oxidized, thereby reducing the amount of methane that eventually reaches the atmosphere (Dean et al., 2018 and references therein). In estuarine systems CH4 can also be oxidized in the sediment via anaerobic methane oxidation coupled with sulfate reduction (Barnes and Goldberg, 1976; Borges and Abril, 2011).
Particularly in wetlands, air-water CH4 fluxes are affected by several environmental variables, such as the water table level, temperature, and salinity. The water table directly influences methane release through its effect on vascular plant species (Sun et al., 2013) and the redox potential (Yang, 2013). Low temperature negatively affects methane emissions, as both organic matter oxidation and plant photosynthesis decrease in response to reduced temperature (Ding and Cai, 2007). Similarly, high salinity reduces methane generation, as sulfate reducing bacteria compit with methanogens for substrate (Bartlett et al., 1987; Poffenbarger et al., 2011). Therefore, CH4 emissions are routinely higher in freshwater wetlands and inland waters in comparison with coastal salt marshes and mangroves (Ding and Cai, 2007; Sun et al., 2013; Tong et al., 2013). Nevertheless, the influence of salinity on methane production is complicated by local conditions, and methane release in saline marshes still persists despite the inhibitory effects of sulfate (Weston et al., 2011). In addition, site-specific conditions are usually quite variable in coastal wetlands, especially in temperate regions, resulting in a large spatio-temporal heterogeneity of methane fluxes in these ecosystems (Poffenbarger et al., 2011). Therefore, because coastal wetland types vary in methane release and controlling processes, they need to be considered individually to yield reliable estimates of global wetland methane emissions (Turetsky et al., 2014) and to assess the potential evolution with the advent of environmental stressors.
As a contribution to the Frontiers Research Topic Structure, Functioning, and Conservation of Coastal Wetlands, we report a data set obtained in the salt marshes of the Doñana National Park (DNP, Figure 1) during a number of samplings conducted between March 2016 and March 2018, of biogeochemical variables related to CH4 production pathways in aquatic systems. Located at the mouth of the Guadalquivir River estuary (South Western Iberian Peninsula, Figure 1), the ecosystem complex jointly formed by the Doñana salt marshes and the estuary covers a surface of 3,560 km2, representing the largest coastal wetland in Southern Europe. In particular, DNP (Ramsar Site since 1982 and UNESCO World Heritage Site since 1995) is considered the most relevant sanctuary for migratory birds in Western Europe (Cížková et al., 2013), as it hosts more than 500,000 waterfowl each year during winter and also includes globally threatened water bird species.
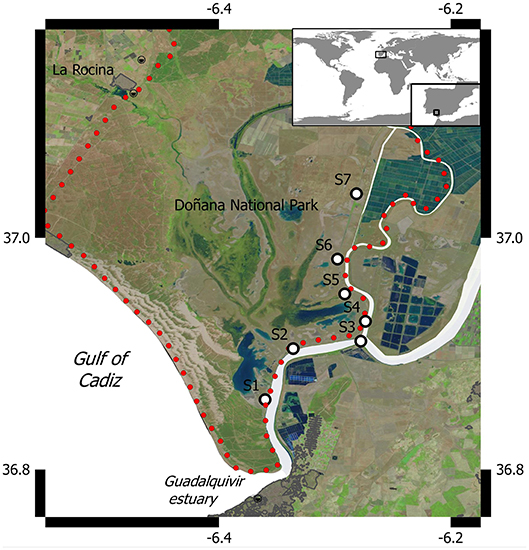
Figure 1. Location of the Doñana salt marshes and sampling sites.
Historically, the Doñana salt marshes were flooded by estuarine waters. However, in April 1998, a massive toxic spill from storage ponds at the Aznalcollar mine reached the Guadiamar River (the major tributary of the Guadalquivir) and 2,650 ha of land adjacent to DNP became contaminated (Taggart et al., 2006). The release of toxic sludge led to the construction of dykes and floodgates in order to protect the marshes against the advance of the contaminated tailings. These prevention actions completely isolated the marshland and impeded any connection with their main draining fluvial basin. Therefore, over almost two decades, hydrology in the Doñana wetlands mostly depended on the annual rainfall regime, small streams situated in the northern side of the Park (e.g., La Rocina, Figure 1) and to a lesser extent, groundwater from the Almonte-Marismas aquifer (Olías et al., 2008). As a result, inundation cycles in the marshland became highly variable (Díaz-Delgado et al., 2016; Huertas et al., 2017). The scientific community and policy-makers designed an ambitious restoration program, the so called Doñana 2005, aimed at restoring partial connectivity between the estuary and the marshes and since 2014, estuarine waters have inundated the Doñana salt marshes again.
Prior to connection, biogeochemistry in aquatic systems of the DNP was examined in relation to the patterns of the variable hydrological cycle occurring in the region (Morris et al., 2013; Huertas et al., 2017). Under wet cycles, prolonged flooding resulted in a marked heterotrophy and a significant CO2 outgassing (Morris et al., 2013) whereas during dry-normal hydrological cycles, air-water CO2 fluxes decreased, with permanent floodplains and ponds of the marshland even behaving as mild sinks for atmospheric CO2 for short periods (Huertas et al., 2017). Alternatively, aquaculture lagoons with man-managed water supply from the estuary continuously behaved as carbon sinks, which highlighted the importance of water management in the Doñana, not only for wetland conservation, but also for its role in the atmospheric CO2 exchange. Nevertheless, regardless of the hydroperiod, net primary production of the surrounding terrestrial vegetation largely offset aquatic CO2 effluxes and hence, considering the net ecosystem exchange, the Doñana wetlands were categorized as a large carbon sequestrator (Huertas et al., 2017).
In contrast, previous studies have identified the Guadalquivir estuary as a potent CO2 source in the atmosphere (de la Paz et al., 2007; Flecha et al., 2015). Higher CO2 emissions are mainly associated to the net heterotrophy occurring upstream of the estuary which is less influenced by the tidal intrusion (salinity <5 psu) and characterized by a considerable turbidity, which leads to a strong CO2 supersaturation (Flecha et al., 2015). Recent work has also shown that the estuary functions as a small CH4 emitter and as a moderate N2O source, with the trace gas dynamics being highly dependent on the tidal-fluvial interaction (Huertas et al., 2018).
To our knowledge, no previous assessment of methane dynamics in the Doñana marshland has been performed, neither during the period of isolation from the estuary, nor after restoring connectivity. The aim of our study was therefore to provide a general description of the current methane dynamics in the salt marshes. Our findings can be used as a base-line to evaluate future trends in response to changes in hydrology, related to direct human management interventions (control of estuarine inputs through dykes and floodgates), or those associated to climate change (draft, sea level rise).
Materials and Methods
Sampling Sites and Strategy
Samples were taken at seven sites (Figure 1) that represent salt marshes inundated by the Guadalquivir estuary during the 16 field campaigns conducted between March 2016 and March 2018. Sites were selected to account for the salinity gradient present in the estuary, which can range from 34 psu in the river mouth down to near 0 psu in the upper limit of the land strip adjacent to the riverside considered in our study (Huertas et al., 2018). Vegetation in the marshes is characterized by pioneer halophilous species like Sarcocornia fruticosa, Halimione portulacoides (Chenopodiaceae), and Limoniastrum monopetalum (Plumbaginaceae) (García-Murillo et al., 2014). During the monitoring period, we also identified Arthrocnemum macrostachyum, Plantago coronopus, Cotula coronopifolia, Taraxacum spp, Centaurium pulchellum, Polypogon maritimus, and Juncus sp., although plant biodiversity exhibited a marked spatio-temporal variability, which is higher during spring periods (Romagnoli, 2018).
All samplings were carried out when the estuary was under the influence of spring and rising tides. Some studies in marshes and other coastal wetlands, such as mangroves, have shown that there is a strong tidal signal in CH4 and water chemistry (Call et al., 2015). Our sampling design might therefore have affected gas dynamics, as sample collection occurred along with the net water flux into the system. However, those tidal conditions ensured overflow in the mudflat and the presence of a significant water level (a minimum water height of 0.1 m) allowing sampling, which was conducted on foot. This strategy may have also had implications for gas distribution due to sediment dynamics disturbance. Nonetheless, it was the only way to access the flooded marshes in certain sites. Considering this caveat, we tried to minimize sediment disturbance as much as possible.
The floodplain is highly variable depending on annual rainfall (Huertas et al., 2017), and is also presently affected by the estuarine intrusion, that in turn is controlled by the tide amplitude. In fact, water levels were too low for sampling during the summer months and early fall. Therefore, data are not available for all sites during the dry season, and temporal variability of aquatic parameters has been examined between periods in which measurements could be performed.
Even though surface water coverage in the marshland changes temporarily, the mudflat is a relatively shallow system. Considering past and current records of wind speed in the area and the average depth of the water column, the Richardson number was calculated, which indicated that at each site, the flooded area was a well-mixed water body (not shown). Due to mixing conditions, methane levels measured at each sampling station were assumed to be representative of each inundated zone.
In all sites, conductivity, temperature and pH (National Bureau of Standards, NBS scale) were obtained with a Yellow Spring (YSI Incorporate) portable multiparameter probe YS6820v2. The pH probe was calibrated before samplings using the United States National Bureau of Standards buffer solutions (4 and 7). Discrete surface water samples were taken to determine dissolved CH4 concentrations and the rest of the aquatic biogeochemical variables considered in our study such as chlorophyll (Chl a), dissolved oxygen (DO), total alkalinity (TA), inorganic nutrients (, , , , and ), dissolved organic carbon (DOC), total dissolved nitrogen (TDN), and suspended particulate matter (TSM).
Data
Meteorology
Hourly measurements of rainfall (mm), air temperature (°C), humidity and wind speed at height z (uz, m s−1) were obtained from a meteorological station located in Lebrija (36° 58′ 35″ N, 06° 07′ 34″ W) which is situated 20 Kms south east of S3 and belongs to the Junta de Andalucía network (www.juntadeandalucia.es/agriculturaypesca/ifapa/ria/servlet/FrontController).
Aquatic Biogeochemical Variables
Samples for CH4 measurements were collected in duplicate 120 mL serum vials, poisoned with HgCl2, sealed and stored upside down in the dark. Analysis was performed by static-head space equilibration gas chromatography (GC) using an Agilent 7890 GC, equipped with a Flame Ionization Detector (FID) for CH4 (de la Paz et al., 2015). Before analysis, 20 mL of N2 headspace were added to each sample, vigorously shaken and equilibrated for at least 12 h. The gas cromatographer was calibrated using three different standard gas mixtures, a certified NOAA primary standard with composition similar to the atmosphere (1863.4 ± 0.3 ppb of CH4), and two additional standard gas mixtures of CH4 in a N2 matrix, provided by Air Liquide (France) with certified concentrations (3,000 and 5,000 ppb of CH4). The precision of the method estimated from the coefficient of variation, based on replicate analysis, was 0.6%.
The response of the FID was very stable and highly lineal for CH4 concentrations within the calibration range. Using daily calibrations during the measurement period, a mean regression coefficient was calculated, yielding a value of 0.9997 ± 0.0002. For samples above the calibration range, linearity was assumed based on a perturbation test of the calibration equation that gave a relative error of 0.32%. In terms of concentration, the linearity assumption resulted in errors of 0.1 and 3 nmol l−1 for CH4 concentrations of 50 nmol and 1,000 nmol l−1, respectively, which allowed considering that the uncertainty associated with the measurements was not significant in the overall database.
Saturation values expressed as percentage (%) of CH4 were computed as the ratio between the gas concentration measured and the calculated equilibrium concentration for the gas. The equilibrium concentration of CH4 was calculated using the solubility expression proposed by (Wiesenburg and Guinasso, 1979) and the annual averaged atmospheric mixing ratio CH4 (×CH4atm) at the nearest station, provided by the World Data Center for Greenhouse Gases (http://ds.data.jma.go.jp/gmd/wdcgg). As CH4 data at the nearest station were not available for the entire study period, a constant value of 1,866 ppb was used, which corresponds to the last annual averaged value available for 2015.
Chl a analysis was performed by filtering known volumes of water through Whatman GF/F glass fiber filters, dipping in 90% acetone overnight in the dark, and measuring by fluorometry using a Turner Designs 10-AU Model fluorometer that was calibrated with a pure standard from Anacystis nidulans (Sigma Chemical Company). DO concentrations were determined by the Winkler method through potentiometric titration using a Metrohm 794 Titroprocessor. Saturation values of DO were calculated according to Benson and Krause (1984) and the Apparent Oxygen Utilization (AOU) was estimated as the difference between the oxygen concentration at saturation and that measured in the samples. Samples for TA determinations were collected in borosilicate bottles (500 ml) preserved with 100 μl of a HgCl2 saturated aqueous solution and stored until their analysis in the laboratory by titration according to Mintrop et al. (2000). Accuracy (±5 μmolkg−1) was regularly checked by measurements of Certificate Reference Material provided by Prof. Andrew Dickson, the Scripps Institution of Oceanography, La Jolla, CA, USA (Batch 147). Partial pressure of CO2 (pCO2) was calculated from TA and pHNBS applying the CO2SYS.xls program (Lewis et al., 1998), with the Cai and Wang (1998) and Dickson (1990) constants for carbon and sulfate, respectively. The propagated error for pCO2 data was ±3%, using an estimated error for pH measurements of ±0.01 pH units, ±2 μmolkg−1 for TA measurements and ±0.1°C for temperature.
Inorganic nutrients were obtained from filtered (Whatman GF/F glass fiber filters) and frozen (−20°C) water samples (5 mL) that were measured in a Continuous Flow Analyzer, following the protocols described by (Grasshoff et al., 1983). DOC and TDN concentrations were obtained with a Shimadzu TOC-VCPH analyzer, by catalytic oxidation, at high temperature (720°C) and chemiluminescence, respectively, according to Álvarez-Salgado and Miller (1998). TSM was obtained by the loss on ignition method on known volumes of water filtered through pre-weighed and pre-combusted 450°C Whatman GF/F glass fiber filters, which were subsequently desiccated at 60°C for 48 h and totally combusted at 450°C during 5 h.
Air-Water CH4 Fluxes
The air-water CH4 flux (FCH4, μmol m−2 d−1) was computed as:
Where Cw and Ca are the dissolved gas concentration and the equilibrium concentration in water, based on the molar atmospheric ratio, and k (cm h−1) is the gas transfer rate as a function of wind speed at 10 m height, that was calculated from k and normalized to a Schmidt number (Sc) of 600 (k600) according to:
Sc was obtained using the formulations given by Wanninkhof (1992) interpolated at the in-situ salinity from the freshwater and seawater equations and k600 was calculated from U10 according to Cole and Caraco (1998).
where U10 was calculated from uz measured at the meteorological station according to Smith (1988).
We acknowledge that the empirical relationship chosen to adjust k600 values may not be ideal for representing wind–enhancement effects in the flooded marshes (shallow water bodies with substantial variations in extent) but it was proven to be suitable to compute air-water CO2 fluxes in relation to other parameterizations (Morris et al., 2013). Nevertheless, to give an indication of the uncertainty this choice introduces, air-water CH4 fluxes were also predicted considering a 0.67 exponent for the Schmidt number. Despite minor differences obtained at high wind speeds (<10%), the mean flux remained unchanged when annual values were averaged.
Statistics
The program language MATLAB was used to perform statistics analysis. Probability distributions of variables were examined through a Shapiro-Wilk test. Pearson's product-moment correlation (PPMC) was used to test for significant correlations between variables. Significance levels were set at p < 0.05.
All data contained in this work are available for download from Digital.CSIC, the Institutional Repository of the Spanish National Research Council (CSIC), http://hdl.handle.net/10261/173204, http://dx.doi.org/10.20350/digitalCSIC/8588).
Results
Meteorological Conditions
Monthly averaged air temperature during the samplings ranged between a minimum of about 8 and a maximum of 24.5°C in January 2017 and July 2017, respectively (Figure 2A). Rainfall was quite variable during the study period (Figure 2B), typical of the Mediterranean climatic region that is characterized by a rainy season (usually extending from October to March) and a dry season (from June to September) when rainfall is almost absent. The inter-annual precipitation pattern in this geographical area also fluctuates often, which affects the flooding regime in the wetlands (Huertas et al., 2017). Particularly, between March 2016 and March 2018 which corresponds to 3 hydrological years (starting 1 September 2015), total annual rainfall was 493 mm from September 2015 to August 2016, 539 mm from September 2016 to August 2017 and 500 mm from September 2017 to March 2018. These values are very close to the mean annual precipitation in the region, equivalent to 550 mm (Serrano Martín et al., 2008), thereby representing normal hydrological cycles. Monthly averaged precipitations during the sampling period varied from a minimum of 0 mm, registered during the months of June and September 2017, to maximum of about 150 mm in spring of 2016 and 2018 and autumn 2016 (Figure 2B). The tidal coefficient at the mouth of the estuary during the sampling dates and defined as the amplitude of the tide forecast, oscillated between 41 and 111, as observed in January 2017 and November 2016, respectively (Figure 2B). Monthly averaged horizontal wind velocity at 10 m above the surface ranged between 1.8 in January 2017 and 4.5 m s−1 in March 2018 with a median value of 2.5 m s−1 (Figure 2C).
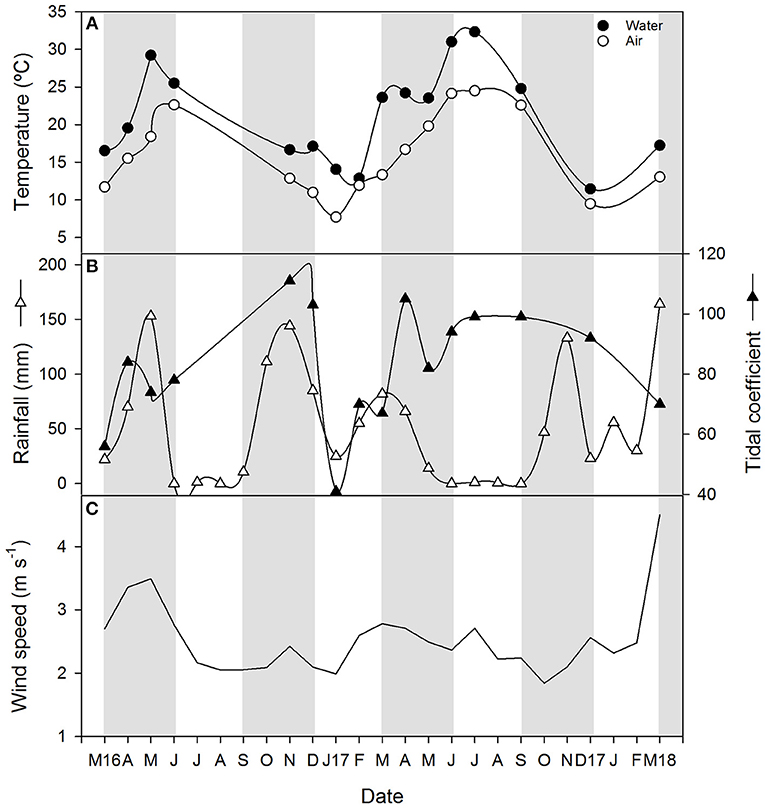
Figure 2. Time series plots of (A) air and water temperature, (B) monthly rainfall and tidal coefficient during the sampling date and (C) monthly mean wind velocity at a height of 10 m. Light and gray shading represent seasons.
Biogeochemical Conditions
Water temperature during samplings oscillated between 11.4 and 32.3°C (Figure 2A), with a clear seasonal pattern that was similar at all sites (not shown for sites individually). The range of variation of other aquatic biogeochemical variables is summarized in Table 1.
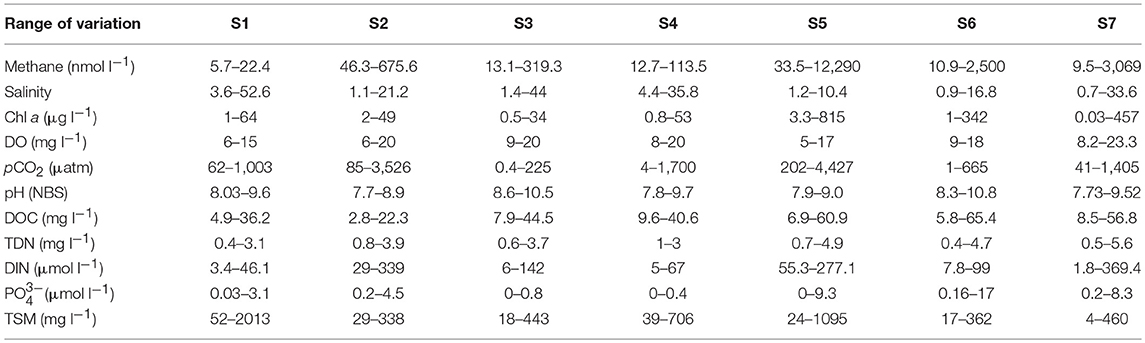
Table 1. Range of variation of biogeochemical variables measured in Doñana saltmarshes during the samples conducted between March 2016 and March 2018.
Because of meteorology and tide variations, salinity markedly changed across the marshes during the study period. It is worth noting that the Guadalquivir estuary is a mesotidal system, in which tidal influence can be noticeable up to 100 km upstream of the river mouth. Nevertheless, high freshwater discharges from an upstream dam during the rainy season interferes with the tidal effect and causes drastic changes in salinity (Díez-Minguito et al., 2013). Therefore, under heavy and prolonged rainfall events, salinity along the estuary experiences large decreases, although during the dry period (70% of the hydrological year) low discharges regularly occur to compensate for evaporation losses and the estuary is tidally dominated.
Consequently, salt marshes located closer to the river mouth (S1:S4) generally had higher salinities compared to those located on the land strip upstream of the estuary (S5:S7). With the exception of a single value of 33.6 psu in March 2016, salinity always remained below 5 psu in Site 7. Based on salinity, S1:S4 could be considered polyhaline tidal marshes whereas S5:S7 formed a group of oligo-mesohaline marshes. Clear variations for most other variables were also observed in all sites during the different samplings (Table 1).
According to Chl a, the salt marshes may be categorized as meso to eutrophic systems, with the higher pigment concentrations mostly found in the mesohaline sites (Table 1). This was also the case for DOC and nutrients ( and DIN), which appeared at higher levels in S5:S7. Possibly related to the presence of high phytoplankton biomass, the flooded marshes were always well-oxygenated, and hypoxia was not detected during the samplings, with DO levels keeping values above 5 mg l−1 (Table 1). Results of the Pearson correlations performed with the complete dataset of the variables measured (Table 2), confirmed that the chlorophyll concentration was negatively and significantly (p < 0.05) correlated with AOU and was therefore, directly related to the dissolved oxygen concentration.
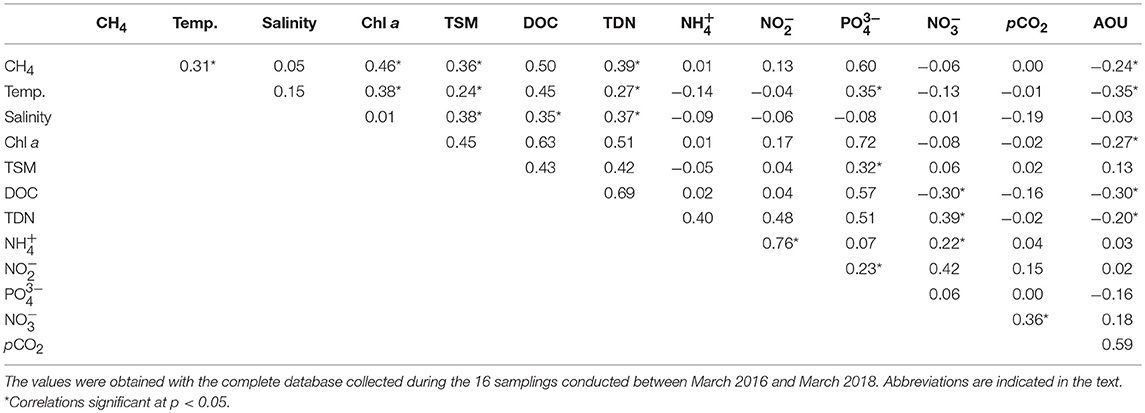
Table 2. Pearson correlation matrix for biogeochemical variables measured in Doñana salt marshes.
Besides direct precipitation, the only water source to the Doñana marshland is the adjacent estuary and thus, the increased salinity in the flooded marshes reflected the effective entry of estuarine waters through the tides. Salinity was significantly (p < 0.05) and positively correlated with TSM, DOC and TDN, indicating that the dissolved and suspended matter measured in the marshes could partially have a fluvial origin.
Spatio-Temporal Variation in Dissolved CH4
Dissolved methane ranged between 5.7 and 12,290 nmol l−1 and generally increased in the mesohaline marshes (S5:S7, Table 1). The spatio-temporal variability of CH4 in all sites is shown in Figure 3 where salinity has also been plotted. Methane values at site S1 were below 18 nmol l−1 during the entire sampling period, except for a single value of 22 nmol l−1 observed in March 2018, coinciding with a drop in salinity (~4 psu) due to heavy monthly precipitations and a moderate estuarine intrusion (marked by the tidal coefficient) during the sampling date (Figure 2B). The highest methane levels in this site were observed when salinity exhibited values below 15 psu, as it occurred in May and December of 2016, March 2017 and March 2018 (Figure 3).
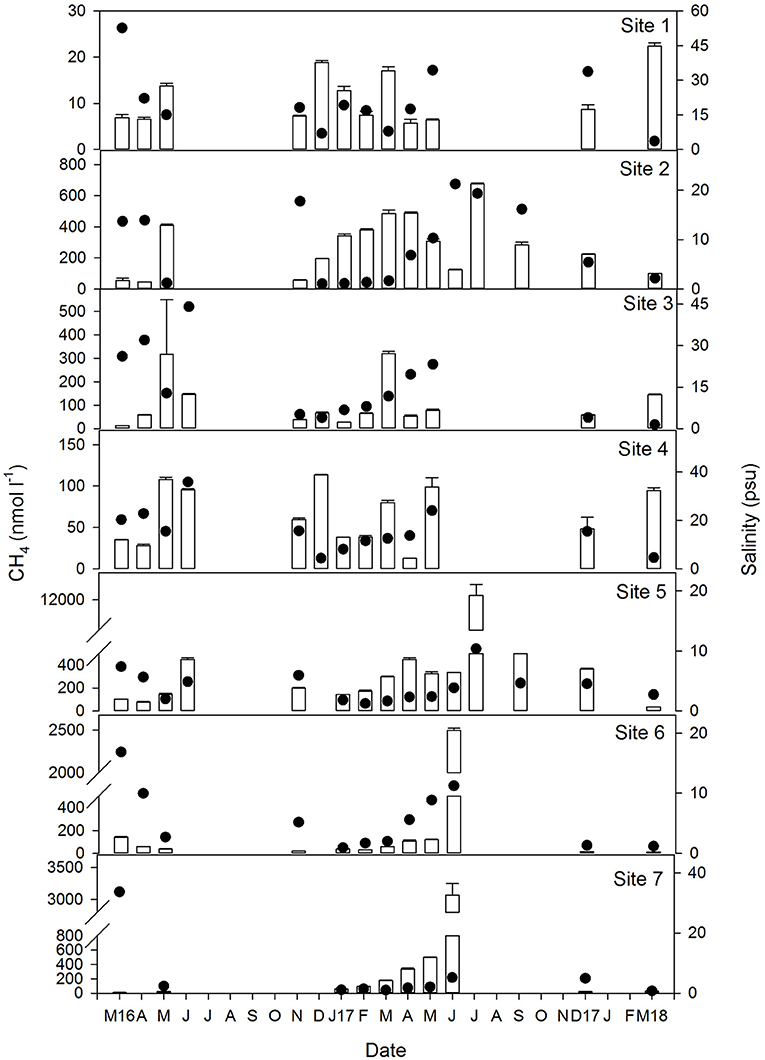
Figure 3. Temporal variation of concentration of dissolved CH4 (vertical bars) and salinity (black circles) at each of the sites between March 2016 and March 2018. Note the Y axis scale for both parameters varies between sites. Gaps in the data represent periods when water levels were too low (<0.1 m) for sampling and therefore, no measurements were taken.
In S2, CH4 was invariably higher than in S1 with a median value of 278 nmol l−1 (Table 1 and Figure 3). A minimum of around 50 nmol l−1 was measured in March, April and December 2016 when salinity was above 14 psu. A second minimum of 100 nmol l−1 was observed in March 2018 despite the low salinity present in the flooded marshes, which may be attributable to a dilution effect caused by the high monthly rainfall (Figure 2B). The maximum concentration of dissolved methane in this site (617 nmol l−1) was detected in the summer of 2017 at a salinity of 19 psu. Therefore, even though salinity was likely to affect methane production, other processes were involved in CH4 dynamics in this particular sector of the marshes.
The range of variation of dissolved methane in S3 decreased with respect to that in S2, oscillating between 13.1 and 319.3 nmol l−1 (Table 1) and with an average concentration of 104 nmol l−1. Apparent relationship with salinity was not evidenced in this site, as maximum levels of methane were not associated with decreased salinity and vice versa (Figure 3).
In S4, the average concentration of methane during the sampling period was 65 nmol l−1, with a maximum value of 114 nmol l−1 found in December 2016 at a salinity of 4 psu (Figure 3). A second maximum was also observed in March 2018 at a similar salinity. However, high CH4 concentrations (~90) were still measured under significant estuarine intrusions, such as those occurring in June 2016 and May 2017 which can be evidenced by the salinity rises (~35 and ~24 psu, respectively, Figure 3).
In the mesohaline marshes (S5:S7) that were characterized by salinities below 10, except in March 2016, methane concentration clearly increased in relation to the polyhaline sites (Table 1 and Figure 3). Average concentrations of CH4 were 338.5, 261.2, and 431.3 nmol l−1 in S5, S6, and S7, respectively. However, it must be noted that an exceptionally high methane level, equivalent to nearly 12,300 nmol l−1, was found in S5 during July 2017, which has been excluded of the average local computation. As a general trend, methane concentration rose in these marshes during the summer of 2017 when water temperatures reached 32°C (Figure 2A).
Overall, the influence of temperature on dissolved CH4 was observed in all sites, as the gas levels increased during the spring and summer months, compared to the levels measured over the winters (Figure 3). The temperature dependence was confirmed by the significant (p < 0.05) and positive correlation obtained between this variable and CH4 (Table 2). When methane concentration was plotted against temperature (Figure 4A), the thermal effect on CH4 levels was especially obvious in the mesohaline marshes, where sulfate inhibition is likely to be suppressed.
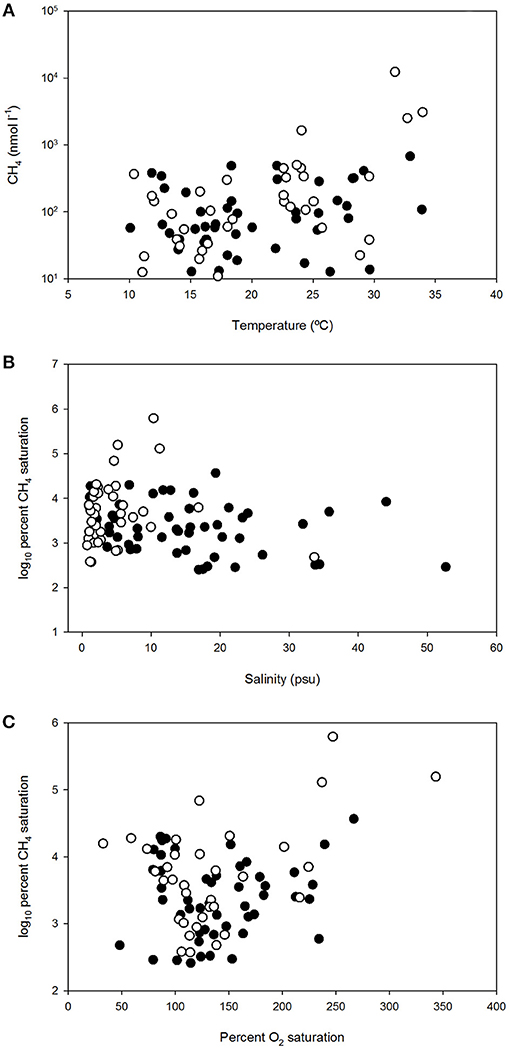
Figure 4. Dissolved methane concentration vs. temperature (A), log10 percent dissolved methane saturation vs. salinity (B) and log10 percent dissolved methane saturation vs. percent dissolved O2 saturation (C) in polyhaline marshes (black symbols) and mesohaline marshes (open symbols) of Doñana National Park.
In contrast, no statistical correlation between methane and salinity was found (Table 2). Nonetheless, when the relationship between the gas saturation levels in the salt marshes and salinity was more closely examined, separately considering the polyhaline (S1:S4) and mesohaline sites (S5:S7), two different behaviors of CH4 dynamics and their relation to this variable were distinguished (Figure 4B). Polyhaline marshes were characterized by a CH4 saturation range of 252–36,735% (average 5,170%) and a scattered distribution with salinity (Figure 4B). On the contrary, mesohaline marshes exhibited a larger CH4 saturation range (374–620,007%, average 31,541%) and a positive relationship with salinity was noticeable (Figure 4B).
In order to better elucidate the effect of ecosystem metabolism on the dynamics of CH4 in the salt marshes, the relationship between CH4 saturation and the oxygen availability was also considered. As shown in Figure 4C, log10%CH4 vs. %O2 displayed a scattered distribution but a positive relationship, indicating that high levels of CH4 were present in well-oxygenated inundated marshes.
Moreover, dissolved CH4 concentration was shown to be strong and significantly (p < 0.05) correlated with Chl a (Table 2). The increase of methane with the phytoplankton biomass was evident in both the polyhaline and mesotrophic sites (Figure 5A) and in the mesohaline and eutrophic sites (Figure 5B). The trend found between DOC and Chl a in the salt marshes (Figures 5C,D) suggests that (Figures 5C,D) organic matter in the water column may have originated partially from phytoplankton productivity. Nonetheless, the fact that high values of DOC (>10 mg l−1) were still present under a low Chl a concentration (<1.5 μg l−1) in the two groups of sites, indicate the contribution of external sources to the organic matter content in the marshes. Increases in organic and suspended matter were accompanied by rises in dissolved CH4 (Figures 5E–H). Significant and positive correlations with salinity were found for both variables (Table 2) and between salinity and TDN, supporting the hypothesis that estuarine inputs also contribute to organic matter accumulation and suspended matter entry in salt marshes.
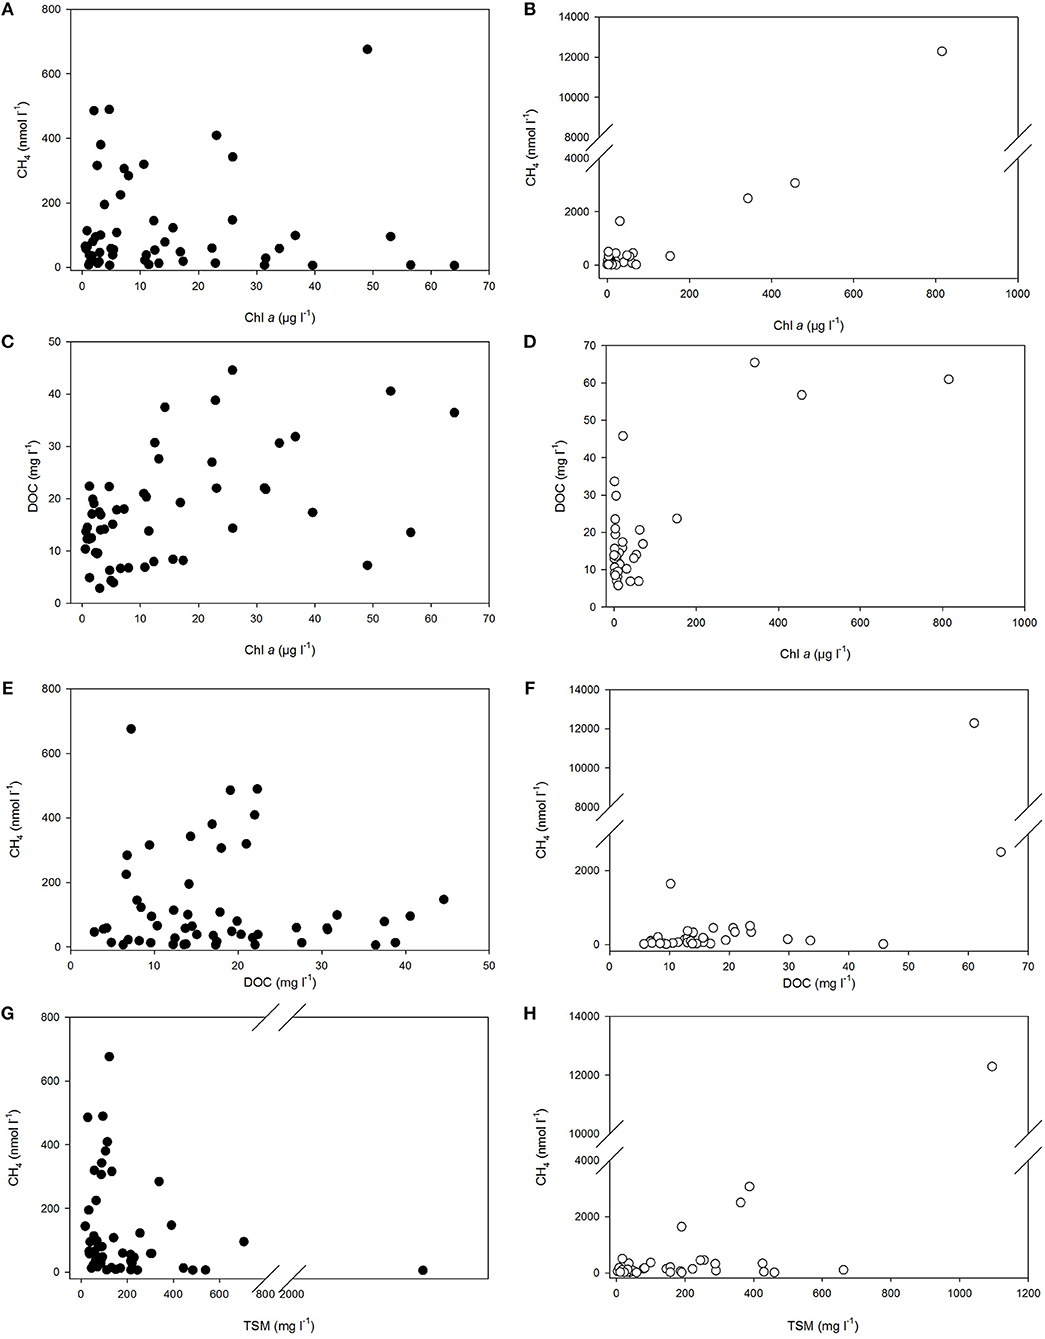
Figure 5. Dissolved methane concentration vs. Chl a (A,B), DOC (E,F), and TSM (G,H) in polyhaline marshes (black symbols) and mesohaline marshes (open symbols) of the Doñana National Park. The relationship between Chl a and DOC in the marshes is also shown in panels (C,D). Abbreviations are indicated in the text.
The pCO2 levels in the marshes were also well-correlated to the log of %CH4 and to %O2 (Figures 6A,B). pCO2 values spanned three orders of magnitude, ranging between 0.5 and 4,427 μatm in S3 and S5, respectively (Table 1). Extremely low pCO2 levels, could be attributed to the high pH values measured in the marshes (~10). The inundated mudflat remained undersaturated with respect to atmospheric CO2 (average concentration of ~405.4 μatm during the sampling period estimated with the Mauna Loa trends, https://www.esrl.noaa.gov/gmd/ccgg/trends/) half of the time. In particular, S3 always behaved as a sink for atmospheric CO2 (Table 2).
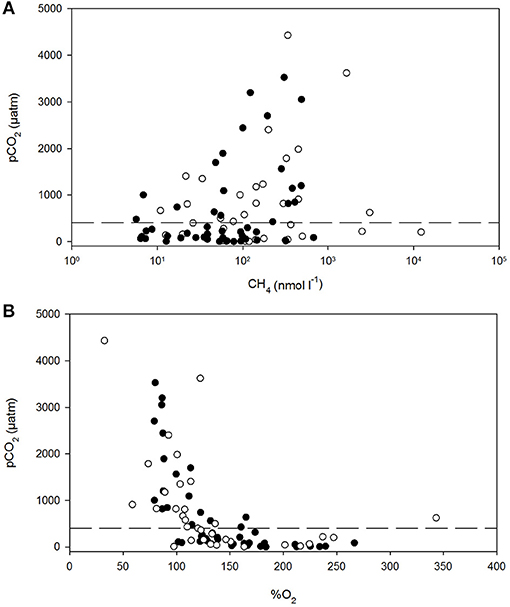
Figure 6. Dissolved carbon dioxide (pCO2) vs. dissolved methane (A) and percent dissolved O2 saturation (B) in polyhaline marshes (black symbols) and mesohaline marshes (open symbols) of the Doñana National Park. The dash line is the average atmospheric pCO2 during the sampling period.
CH4 Emission Fluxes
CH4 emissions exhibited a marked variability during the sampling period in all sites, varying from ~3 μmol m−2 d−1 in site 1 in March 2016, to a maximum of ~12,700 μmol m−2 d−1 in site 5 in July 2017 (Figure 7). Overall, a tendency of higher methane effluxes was observed during the summer months, although emissions increased in the mesohaline marshes (from 5.6 to 12,715 μmol m−2d−1 ,average 637 μmol m−2 d−1) in relation to the polyhaline marshes (from 2.6 to 720 μmol m−2d−1, average 104 μmol m−2 d−1).
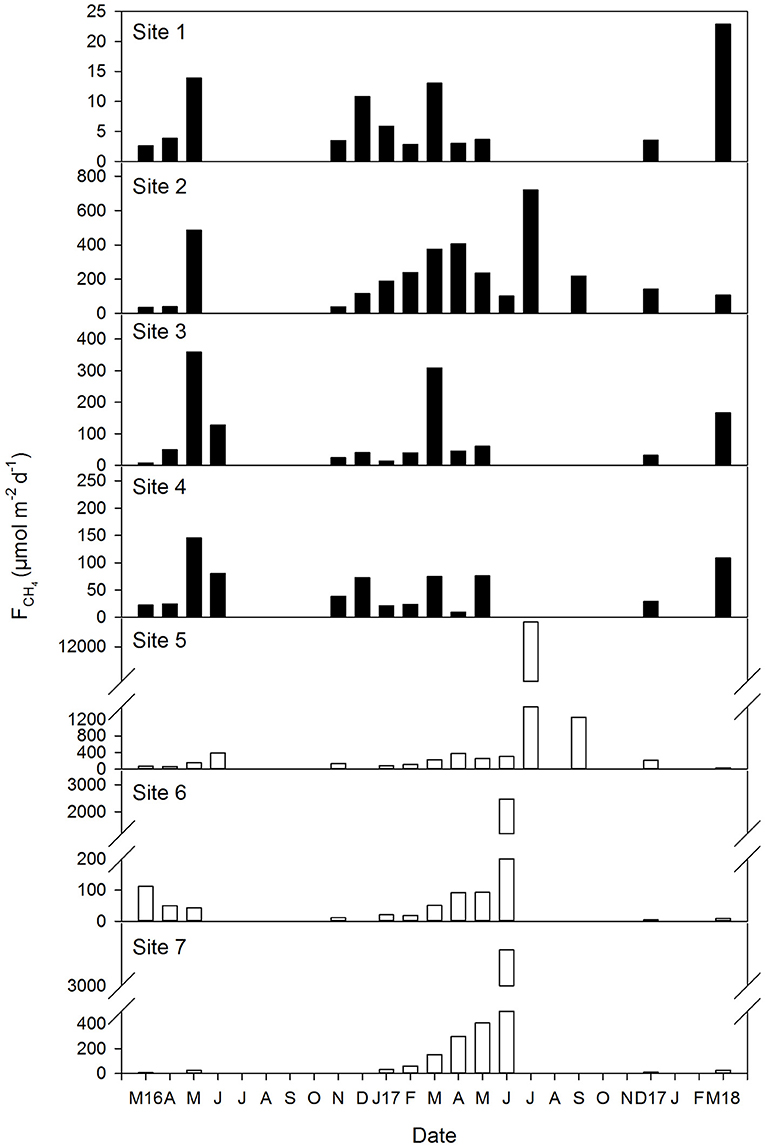
Figure 7. Temporal variation of the air-water CH4 fluxes in the polyhaline marshes (black bars) and mesohaline marshes (open bars) of the Doñana National Park during the sixteen samplings conducted between March 2016 and March 2018. Note that Y axis scale varies between sites. Gaps in the data represent periods when water levels were too low (<0.1 m) for sampling and therefore, no measurements were taken.
Discussion
Sources of CH4 in Doñana Salt Marshes
Coastal wetlands, and particularly estuarine systems are intense sources of CH4 to the atmosphere (Borges and Abril, 2011; Upstill-Goddard and Barnes, 2016) where emissions are sustained by fluvial inputs and sedimentary methanogenesis, fueled by a high organic matter deposition (Borges et al., 2017; Rosentreter et al., 2018a).
We recently reported a data set of dissolved CH4 concentrations in the Guadalquivir estuary transect that flooded the Doñana salt marshes from March 2016 to March 2017 (Huertas et al., 2018). For this period, that partially encompasses the one used in this study, the CH4 concentration ranged from 14 nmol l−1 in the river mouth (average salinity during the study >25) to 750 nmol l−1 upstream to the limit of site 5 (average salinity ~5). These levels of dissolved methane corresponded to a saturation range of 520–30,800% (average 2,285%) (Huertas et al., 2018), which is comparable to that measured in the Doñana polyhaline marshes (S1:S4) corresponding to 252–36,735% (average 5,170%) but much lower than that observed in the mesohaline marshes (374–620,007%, average 31,541%). This indicates that even though estuarine inputs of CH4 in the salt marshes may occur by lateral transport, through riverine overflow, a local additional source of CH4 must contribute to the observed high CH4 values. The methane over-saturations and concentrations measured in Doñana fall within the range reported in temperate estuarine systems characterized by a salinity gradient (Upstill-Goddard and Barnes, 2016; Borges et al., 2018b) and in mangroves (Rosentreter et al., 2018b and references therein).
The most likely additional source of CH4 to the Doñana tidal flat would be sedimentary methanogenesis. Warm and waterlogged soils provide ideal conditions for methanogenesis (Roehm, 2005). Deep standing water enriched in dissolved organic matter and covered by plant litter creates an anaerobic environment that triggers CH4 production (Ding and Cai, 2007), with this process being favored by temperature increases. Our data show a direct and strong relationship between the levels of dissolved methane, organic matter content and water temperature, as it has been observed in other brackish coastal wetlands (Welti et al., 2017). Methanogenesis is substantially driven by temperature (Martin and Moseman-Valtierra, 2017) and it is therefore the most dominant environmental driver of CH4 emissions in wetlands (Yvon-Durocher et al., 2014) specifically in coastal salt marshes (Abdul-Aziz et al., 2018). The overall pattern found here therefore suggests a methanogenesis control by temperature in the sediment, which has been described as muddy with numerous stems and roots and scarce micro-fauna (Ruiz et al., 2004). In addition, vegetation in the marshes may have supported a methanogens population that could contribiute to an increase of CH4 concentrations during warmer conditions, which has been found in Spartina dominated wetlands (Burke et al., 2002; Abdul-Aziz et al., 2018). The organic-matter rich sediment in conjunction with the organic inputs from the heterotrophic Guadalquivir estuary (Flecha et al., 2015) and those generated in situ by the phytoplankton productivity, as indicated by the association found between Chl a and DOC, provide optimal conditions for sedimentary methanogenesis to proceed, with temperature acting as a major regulating driver. The higher temperatures during the late spring and summer months possibly resulted in increased microbial activity and greater primary productivity (Chl a and temperature were significantly and positively correlated), leading to high organic inputs, sediment carbon contents, and subsequently higher substrate availability. Large suspended matter loads that are characteristic in the turbid Guadalquivir River (Flecha et al., 2015) would also provide higher silt deposition and enhance methane generation, in agreement with what has been observed in shallow coastal areas (Borges et al., 2017). The pattern between TSM and dissolved CH4 in the salt marshes supports this hypothesis, particularly in the mesohaline marshes where very high levels of dissolved methane were measured at a high Chl a concentration, DOC content and TSM.
The couplings between pCO2, CH4, DOC, and %O2 also indicate that the dynamics of dissolved gases in the tidal flat were driven by the oxidation of the organic matter produced by either phytoplankton, as described elsewhere (Borges et al., 2017; Welti et al., 2017) or from allochthonous sources (Upstill-Goddard et al., 2017). Here, the relationship observed between pCO2 and CH4 is quite frequent (Borges et al., 2015, 2018a; Rosentreter et al., 2018b) and denotes a common source and similar production dynamics, as both gases are produced through organic matter respiration.
In the polyhaline marshes, large CH4 concentrations were measured when DOC levels were high, but this association was not as clear as in the mesohaline sites. This was probably due to the general inhibitory effects of abundant sulfate electron acceptors and reducing bacteria generally found in saline environments (Alongi et al., 2001; vanDijk et al., 2015). In fact, even though we did not observe a linear relationship between salinity and CH4 levels, coinciding with the trend described in other brackish systems (Chuang et al., 2017; Welti et al., 2017), the lower CH4 levels in the Doñana salt marshes were mainly associated to high salinity values, consistent with existing literature on coastal wetlands (Bartlett et al., 1987; Poffenbarger et al., 2011). Nevertheless, large CH4 levels can still occur in wetlands even when sulfate reduction is relevant (Lee et al., 2008; Alongi and Brinkman, 2011).
Similarly, distinct associations between methane and oxygen have been reported in aquatic systems. It is certain that methanogens are obligate anaerobes, and thus a negative relationship %CH4 vs. %O2 would be expected, as previously shown in other coastal wetlands (Livesley and Andrusiak, 2012), including the Guadalquivir estuary (Huertas et al., 2018). But alternatively, positive associations have been described in Amazon floodplain lakes (Devol et al., 1990), in freshwater lakes (Bogard et al., 2014), African savannah rivers (Upstill-Goddard et al., 2017) and shallow coastal zones (Borges et al., 2017). This feature has been attributed to several causes. First, the diffusion of CH4 produced in the underlying sediment into the aerated water column under low levels of turbulence since the CH4 diffusion term in these conditions, exceeds combined CH4 losses via oxidation, and water-to-air exchange (Upstill-Goddard et al., 2017). The contribution of high macrophyte-related productivity has also been suggested as a cause for positive relationships with dissolved oxygen due to direct CH4 production (Stanley et al., 2016). Additionally, methanogens have a higher sensitivity to temperature than methanotrophs do (Dunfield et al., 1993), which leads to higher rates of CH4 production in relation to consumption at elevated temperatures within a certain range of salinity values. Furthermore, methanogenesis in aerobic conditions by methanogen archaea fixed at the surface of phytoplankton cells has also been reported (Grossart et al., 2011). Therefore, peaks of dissolved CH4 that correlate positively with oxygen, phytoplankton biomass, and productivity are a recurrent feature in aquatic ecosystems (Bogard et al., 2014 and references therein).
Considering the shallowness of the tidal flat in the Doñana, it is plausible to assume that benthic productivity could have been decoupled from CH4 production (Borges et al., 2015). Moreover, methane could also have been transported from the creek onto the marshes during the flood tide as it occurs in estuarine systems (Rosentreter et al., 2018b), whereas the DO signal would be related to the primary productivity occurring in the mudflat. Unfortunately, tidal pumping cannot be evaluated due to the lack of measurements in the creek, but it could be an important mechanism for CH4 import to the marshes (Rosentreter et al., 2018b). The correlation of methane with a Chl a concentration may support a strong benthic CH4 source, fueled by sinking phytoplankton material (Borges et al., 2017) rather than an aerobic CH4 production.
Therefore, according to the patterns found in our study, temperature, and phytoplankton activity seem to be the main drivers of CH4 formation when salinity does not exceed 17 psu (see for instance temporal changes in methane levels in site 5 and the overall relationship %sat CH4 vs. salinity). Above this salinity threshold, sulfate inhibition would constrain methane formation in the marshes.
Nevertheless, our findings also indicate that besides sedimentary methanogenesis, inflowing estuarine inputs would provide an additional source of methane to the salt marshes. Offsetting these sources, losses by microbial oxidation, lateral advection towards the estuary and dilution by heavy rain events, must also be incorporated as mechanisms affecting temporal variability of methane in the system. Unfortunately, the relative importance of all sources and sinks of dissolved methane cannot presently be estimated.
CH4 Emissions From the Doñana Salt Marshes
The mean air-water CH4 flux during the sampling period was 324 μmol m−2 d−1, although a high variation in the emissions was observed (±1,394 μmol m−2 d−1). This was a consequence of the different ranges of emissions found between the polyhaline and mesohaline marshes, as the methane fluxes were generally lower in the former compared to the latter, in agreement with what has been observed in systems characterized by marked salinity gradients (Poffenbarger et al., 2011; Welti et al., 2017). Nevertheless, the mean flux provided here falls within the ranges of CH4 emissions reported in European estuarine zones (Upstill-Goddard and Barnes, 2016), in temperate fluvial catchments (Upstill-Goddard et al., 2017) and in mid-latitude mangroves (Rosentreter et al., 2018a). Few studies have quantified and investigated air-water CH4 exchange and dynamics in tidal flats (Dean et al., 2018). The fluxes measured in our study are slightly lower than those observed in subtropical tidal wetlands (Tong et al., 2013; Welti et al., 2017), coherent with a temperature control on methanogenesis (Abdul-Aziz et al., 2018). Lower emissions can therefore be expected from temperate coastal wetlands compared to tropical and subtropical coastal wetlands. In fact, the higher methane fluxes in the Doñana were found during the summer months in all sites, as increasing temperature increases microbial activity. Nevertheless, methane emissions from the Doñana salt marshes are still of the same order of magnitude than those measured in Indian and Australian mangroves (Linto et al., 2014; Call et al., 2015; Rosentreter et al., 2018b).
The average air-water CH4 flux estimated here is almost 5-fold higher than the mean value computed in the Guadalquivir estuary transect that floods Doñana and equivalent to 66.2 μmol m−2d−1 (Huertas et al., 2018). The biogeochemistry in the estuary is totally different than that in the marshes where large loads of inorganic suspended particulate matter cause a considerable turbidity that limits phytoplankton growth (Ruiz et al., 2013). The low primary productivity in the estuarine waters would constrain labile organic matter supply for sedimentary methanogenesis, whereas in the shallow and lower turbulent salt marshes organic inputs from in situ photosynthesis, or from external sources, would fuel the process. This hypothesis however, remains to be tested.
The Doñana salt marshes behaved as a moderate CH4 emitter under the environmental conditions present during the sampling period, which corresponds to a normal hydrological cycle for this geographical area. Cycles characterized by heavy precipitations, which are not so uncommon (Díaz-Delgado et al., 2016; Huertas et al., 2017), are expected to affect methane dynamics and increase the emissions due to the overall reduction in salinity over the inundated marshes. This effect has been observed in tropical mangrove-dominated estuaries (Rosentreter et al., 2018b). Moreover, it is important to acknowledge that the approach used here to compute methane fluxes, does not quantify CH4 ebullition fluxes, whose contribution to total CH4 emissions may be significant (Baulch et al., 2011), particularly during low water periods. Furthermore, our sampling regime did not account for the potential importance of lateral tidal pumping as a source of CH4 and higher concentrations (and fluxes) during low tide, as it has been reported in other intertidal systems (Call et al., 2015; Maher et al., 2015). In fact, tidal differences may account 5-fold in the estimated CH4 diffusive water to air fluxes (Maher et al., 2015). CH4 may also be transferred directly from sediments to the atmosphere (Borges and Abril, 2011). At low tide, this can take place through diffusion or ebullition and in vegetated tidal flats, such as Doñana, plants may act as both active and passive conduits of the CH4 (Foster-Martinez and Variano, 2016). All these pathways were not determined in our study and total CH4 emissions must be seen as a lower limit.
Our study is, however, foundational because it underlines the drivers controlling CH4 dynamics in the Doñana marshes. These wetlands are threatened by climate change and many local stressors associated to anthropogenic activities (Green et al., 2017). In the Mediterranean climatic region, higher minimum temperatures, more extreme high temperature events in summer and less precipitation are projected to occur by the end of the 21st century (Giorgi and Lionello, 2008). How the expected warming will affect methane dynamics in the ecosystem complex formed by the estuary and the marshes cannot be anticipated. Increased temperatures can cause methane to be produced at a faster rate but a rise in the saline intrusion associated to the projected sea level rise may offset methane release. Sustained observations would then be required to constrain the gas budget in this iconic coastal wetland.
Author Contributions
IEH conceived the study, contributed to data analysis and interpretation, and drafted the manuscript. GN and FFP contributed to data analysis and interpretation, and critical discussion. SF and MdP contributed to the analytical design, data calculation and discussion.
Funding
This research was funded by the Spanish Ministry for Agriculture, Food and Environment, project 1539/2015. Mercedes de la Paz would like to acknowledge the support of the Spanish Ministry of Economy and Competitiveness (CTM2015-74510-JIN).
Conflict of Interest Statement
The authors declare that the research was conducted in the absence of any commercial or financial relationships that could be construed as a potential conflict of interest.
Acknowledgments
The authors are indebted to María Ferrer-Marco, Marta Riera and Antonio Moreno for their support in the field work and samples analysis and Manuel Arjonilla for nutrient analysis.
References
Abdul-Aziz, O. I., Ishtiaq, K. S., Tang, J., Moseman-Valtierra, S., Kroeger, K. D., Gonneea, M. E., et al. (2018).Environmental controls, emergent scaling, and predictions of greenhouse gas (GHG) fluxes in coastal salt marshes. J. Geophys. Res. 123, 2234–2256. doi: 10.1029/2018JG004556
Alongi, D. M., and Brinkman, R. (2011). “Hydrology and Biogeochemistry of Mangrove Forests,”in Forest Hydrology and Biogeochemistry, eds D. F. Levia, D. Carlyle-Moses, and T. Tanaka (Dordrecht, Springer), 203–219. doi: 10.1007/978-94-007-1363-5_10
Alongi, D. M., Wattayakorn, G., Pfitzner, J., Tirendi, F., Zagorskis, I., Brunskill, J., et al. (2001).Organic carbon accumulation and metabolic pathways in sediments of mangrove forests in southern Thailand. Mar. Geol. 179, 85–103. doi: 10.1016/S0025-3227(01)00195-5
Álvarez-Salgado, X. A., and Miller, A. E. J. (1998). Simultaneous determination of dissolved organic carbon and total dissolved nitrogen in seawater by high temperature catalytic oxidation: conditions for precise shipboard measurements. Mar. Chem. 62, 325–333. doi: 10.1016/S0304-4203(98)00037-1
Barnes, R. O., and Goldberg, E. D. (1976). Methane production and consumption in anoxic marine sediments. Geology 4, 297–300. doi: 10.1130/0091-7613(1976)4<297:MPACIA>2.0.CO;2
Bartlett, K. B., Bartlett, D. S., Harriss, R. C., and Sebacher, D. I. (1987). Methane emissions along a salt-marsh salinity gradient. Biogeochem 4,183–202. doi: 10.1007/BF02187365
Baulch, H. M. S. L., Schiff, R., Maranger, P. J., and Dillon (2011), Nitrogen enrichment the emission of nitrous oxide from streams. Glob. Biogeochem. Cycle, 25. doi: 10.1029/2011JG001656
Benson, B. B., and Krause, D. (1984). The concentration and isotopic fractionation of oxygen dissolved in freshwater and seawater in equilibrium with the atmosphere1. Limnol. Oceanogr. 29, 620–632. doi: 10.4319/lo.1984.29.3.0620
Bogard, M. J., del Giorgio, P. A., Boutet, L., Chaves, M. C., Merante, A., Prairie, Y. T., et al. (2014). Oxic water column methanogenesis as a major component of aquatic CH4 fluxes. Nat. Commun. 5:5350. doi: 10.1038/ncomms6350
Borges, A., and Abril, G. (2011). “Carbon Dioxide and Methane Dynamics in Estuaries,” in Treatise on Estuarine and Coastal Science, Vol. 5, eds E. Wolanski and D. S. McLusky (Waltham, MA: Academic Press), 119–161. doi: 10.1016/B978-0-12-374711-2.00504-0
Borges, A., Darchambeau, F., Teodoru, C. R., Marwick, T. R., Tamooh, F., Geeraert, N., et al. (2015) Globally significant greenhouse-gas emissions from African inland waters. Nat. Geosci. 8. doi: 10.1038/NGEO2486.
Borges, A. V., Abril, G., and Bouillon, S. (2018b). Carbon dynamics and CO2 and CH4 outgassing in the Mekong delta. Biogeochem. 15, 1093–1114. doi: 10.5194/bg-15-1093-2018
Borges, A. V., Darchambeau, F., Lambert, T., Bouillon, S., Morana, C., Brouyère, S., et al. (2018a). Effects of agricultural land use on fluvial carbon dioxide, methane and nitrous oxide concentrations in a large European river, the Meuse (Belgium). Sci. Total Environ. 610–611, 342–355. doi: 10.1016/j.scitotenv.2017.08.047
Borges, A. V., Speeckaert, G., Champenois, W., Scranton, M. I., and Gypens, N. (2017). Productivity and temperature as drivers of seasonal and spatial variations of dissolved methane in the southern bight of the North Sea. Ecosystems 21, 583–599. doi: 10.1007/s10021-017-0171-7
Burke, D. J., Hamerlynck, E. P., and Hahn, D. (2002). Interactions among plant species and microorganisms in salt marsh sediments. App. Environ. Microbiol. 68, 1157–1164. doi: 10.1128/AEM.68.3.1157-1164.2002
Cai, W. J., and Wang, Y. (1998). The chemistry, fluxes, and sources of carbon dioxide in the estuarine waters of the satilla and altamaha rivers, Georgia. Limn. Oceanog. 43, 657–668. doi: 10.4319/lo.1998.43.4.0657
Call, M., Maher, D. T., Santos, I. R., Ruiz-Halpern, S., Mangion, P., Sanders, C. J., et al. (2015). Spatial and temporal variability of carbon dioxide and methane fluxes over semi-diurnal and spring–neap–spring timescales in a mangrove creek. Geochim Cosmochim Acta. 150, 211–225. doi: 10.1016/j.gca.2014.11.023
Chuang, P. C., Young, M. B., Dale, A. W., Miller, L. G., Herrera-Silveira, J. A., and Paytan, A. (2017). Methane ?uxes from tropical coastal lagoons surrounded by mangroves, Yucatán, Mexico. J. Geophys. Res. Biogeosci. 122, 1156–1174. doi: 10.1002/2017JG003761
Cížková, H., Květ, J., Comín, F. A., Laiho, R., Pokorný, J., and Pithart, D. (2013). Actual state of European wetlands and their possible future in the context of global climate change. Aqu. Sci. 75, 3–26. doi: 10.1007/s00027-011-0233-4
Cole, J. J., and Caraco, N. F. (1998). Atmospheric exchange of carbon dioxide in a low wind oligotrophic lake measured by the addition of SF6. Limnol. Oceanog. 43, 647–656. doi: 10.4319/lo.1998.43.4.0647
de la Paz, M., Gomez-Parra, A., and Forja, J. (2007). Inorganic carbon dynamic and air–water CO2 exchange in the guadalquivir estuary (SW Iberian Peninsula). J. Mar. Sys. 68, 265–277. doi: 10.1016/j.jmarsys.2006.11.011
de la Paz, M., Huertas, I. E., Flecha, S., Ríos, A. F., and Pérez, F. F. (2015). Nitrous oxide and methane in atlantic and mediterranean waters in the strait of gibraltar: air-sea fluxes and inter-basin exchange. Prog. Oceanog. 138, 18–31. doi: 10.1016/j.pocean.2015.09.009
Dean, J. F., Middelburg, J. J., Röckmann, T., Aerts, R., Blauw, L. G., Egger, M., et al. (2018). Methane feedbacks to the global climate system in a warmer world. Rev. Geophys. 56, 207–250. doi: 10.1002/2017RG000559
Devol, A. H., Richey, J. E., Forsberg, B. R., and Martinelli, L. A. (1990) Seasonal dynamics in methane emissions from the Amazon River floodplain to the troposphere. J. Geophys. Res. 95, 16417–16426. doi: 10.1029/JD095iD10p16417
Díaz-Delgado, R., Aragonés, D., Afán, I., and Bustamante, J. (2016). Long-term monitoring of the flooding regime and hydroperiod of Doñana marshes with landsat time series (1974-2014). Remote Sens. 8, 1–19. doi: 10.3390/rs8090775
Dickson, A. G. (1990). Standard potential of the reaction: AgCl(s) + 12H2(g) = Ag(s) + HCl(aq), and the standard acidity constant of the ion HSO4– in synthetic sea water from 273.15 to 318.15 K. J. Chem. Therm. 22, 113–127. doi: 10.1016/0021-9614(90)90074-Z
Díez-Minguito, M., Contreras, E., Polo, M. J., and Losada, M. A. (2013). Spatio-temporal distribution, along-channel transport, and post-riverflood recovery of salinity in the Guadalquivir estuary (SW Spain). J. Geophys. Res. 118, 2267–2278. doi: 10.1002/jgrc.20172
Ding, W. X., and Cai, Z. C. (2007). Methane emission from natural wetlands in China: summary of years 1995–2004 studies. Pedosphere 17, 475–486. doi: 10.1016/S1002-0160(07)60057-5
Dunfield, P., Dumont, R., and Moore, T. R. (1993). Methane production and consumption in temperate and subarctic peat soils: response to temperature and pH. Soil Biol. Biochem. 25, 321–326. doi: 10.1016/0038-0717(93)90130-4
Flecha, S., Huertas, I. E., Navarro, G., Morris, E., and Ruiz, J. (2015).Air–Water CO2 fluxes in a highly heterotrophic estuary. Est Coasts. 38, 2295–2309. doi: 10.1007/s12237-014-9923-1
Foster-Martinez, M. R., and Variano, E. A. (2016). Air-water gas exchange by waving vegetation stems. J. Geophys. Res. 121, 1916–1923. doi: 10.1002/2016JG003366
García-Murillo, P., Bazo, E., and Fernández-Zamudio, R. (2014). The plants of doñana national park's marisma (Spain): a key element for conservation of an emblematic European wetland. Cienc UAT 9, 60–75. doi: 10.29059/cienciauat.v9i1.620
Giorgi, F., and Lionello, P. (2008). Climate change projections for the mediterranean region. Glob. Plan Change 63, 90–104. doi: 10.1016/j.gloplacha.2007.09.005
Grasshoff, K., Erhardt, M., and Kremling, K. (1983). Methods of seawater analysis. 2. Acta Hydrochim Hydrobiol. 14, 79–80. doi: 10.1002/aheh.19860140112
Green, A. J., Alcorlo, P., Peeters, E. T. H. M., Morris, E. P., Bravo-Utrera, M. A, Bustamante, J., et al. (2017). Creating a safe operating space for wetlands in a changing climate. Front. Ecol. Environ. 15, 99–107. doi: 10.1002/fee.1459
Grossart, H. P., Frindte, K., Dziallas, C., Eckert, W., and Tang, K. W. (2011). Microbial methane production in oxygenated water column of an oligotrophic lake. PNAS 108, 19657–19661. doi: 10.1073/pnas.1110716108
Huertas, I. E., Flecha, S., Figuerola, J., Costas, E., and Morris, E. P. (2017). Effect of hydroperiod on CO2 fluxes at the air-water interface in the Mediterranean coastal wetlands of Doñana. J. Geophys. Res. 122, 1615–1631. doi: 10.1002/2017JG003793
Huertas, I. E., Flecha, S., Navarro, G., Pérez, F. F., and de la Paz, M. (2018). Spatio-temporal variability and controls on methane and nitrous oxide in the Guadalquivir Estuary, Southwestern Europe. Aqu. Sci. 80:29. doi: 10.1007/s00027-018-0580-5
Kirschke, S., Bousquet, P., Ciais, P., Saunois, M., Canadell, J. G., Dlugokencky, E. J., et al. (2013). Three decades of global methane sources and sinks. Nat. Geos. 6, 813–823. doi: 10.1038/ngeo1955
Lee, R. Y., Porubsky, W. P., Feller, I. C., McKee, K. L., and Joye, S. B. (2008). Porewater biogeochemistry and soil metabolism in dwarf red mangrove habitats (Twin Cays, Belize). Biogeochem 87, 181–198. doi: 10.1007/s10533-008-9176-9
Lewis, E., Wallace, D., and Allison, L. J. (1998). Program Developed for CO2 System Calculations. Carbon Dioxide Information Analysis Center managed by Lockheed Martin Energy Research Corporation for the US Department of Energy.
Linto, N., Barnes, J., Ramachandran, R., Divia, J., Ramachandran, P., and Upstill-Goddard, R. C. (2014). Carbon dioxide and methane emissions from mangrove-associated waters of the Andaman Islands, Bay of Bengal. Est. Coasts 37, 381–398. doi: 10.1007/s12237-013-9674-4
Livesley, S. J., and Andrusiak, S. M. (2012). Temperate mangrove and salt marsh sediments are a small methane and nitrous oxide source but important carbon store. Est. Coast Shelf. Sci. 97, 19–27.doi: 10.1016/j.ecss.2011.11.002.
Maher, D. T., Cowley, K., Santos, I. R., Macklin, P., and Eyre, B. D. (2015) Methane carbon dioxide dynamics in a subtropical estuary over a diel cycle: insights from automated in situ radioactive stable isotope measurements. Mar. Chem. 168, 69–79. doi: 10.1016/j.marchem.2014.10.017
Martin, R. M., and Moseman-Valtierra, S. (2017). Different short-term responses of greenhouse gas fluxes from salt marsh mesocosms to simulated global change drivers. Hydrobiology 802, 71–83. doi: 10.1007/s10750-017-3240-1
Mintrop, L., Pérez, F. F., González-Dávila, M., Santana-Casiano, J. M., and Körtzinger, A (2000).Alkalinity determination by potentiometry: intercalibration using three different methods. Cienc Mar. 26, 23–27. doi: 10.7773/cm.v26i1.573
Morris, E. P., Flecha, S., Figuerola, J., Costas, E., Navarro, G., Ruiz, J., et al. (2013). Contribution of Doñana wetlands to carbon sequestration. PLoS ONE 8:e71456. doi: 10.1371/journal.pone.0071456.
Nisbet, E., Dlugokencky, E., Manning, M., Lowry, D., Fisher, R., France, J., et al. (2016). Rising atmospheric methane: 2007–2014 growth and isotopic shift. Glob. Biogeochem Cycles 30, 1356–1370. doi: 10.1002/2016GB005406
Olías, M., González, F., Cerón, J. C., Bolívar, J. P., González-Labajo, J., and García-López, S. (2008).Water quality and distribution of trace elements in the Doñana aquifer (SW Spain). Environ. Geol. 55, 1555–1568. doi: 10.1007/s00254-007-1106-y
Poffenbarger, H. J., Needelman, B. A., and Megonigal, J. P. (2011).Salinity influence on methane emissions from tidal marshes. Wetlands 31, 831–842.doi: 10.1007/s13157-011-0197-0
Roehm, C. (2005). “Respiration in wetland ecosystems,” in Respiration in Aquatic Ecosystems, ed P. del Giorgio and P. le B Williams (Oxford: Oxford University Press), 83–102. doi: 10.1093/acprof:oso/9780198527084.003.0006
Romagnoli, B. (2018).Influence of Guadalquivir Estuary on Aquatic Biogeochemistry and Isotopic Signature of the Saltmarshes of Doñana National Park (SW Spain). [dissertation/master's thesis]: University of Bologna.
Rosentreter, J. A., Maher, D. T., Erler, D. V., Murray, R., and Eyre, B. D. (2018b) Factors controlling seasonal CO2 CH4 emissions in three tropical mangrove-dominated estuaries in Australia. Est. Coast Shelf. Sci. 215, 69–82. doi: 10.1016/j.ecss.2018.10.003
Rosentreter, J. A., Maher, D. T., Erler, D. V., Murray, R. H., and Eyre, B. D. (2018a). Methane emissions partially offset “blue carbon” burial in mangroves. Sci. Adv. 4:eaao4985. doi: 10.1126/sciadv.aao4985
Ruiz, F., Rodriguez-Ramirez, A., Caceres, L. M., Rodriguez-Vidal, J., Carretero, M. I., Clemente, L., et al. (2004).Late Holocene evolution of the southwestern Doñana National Park (Guadalquivir Estuary, SW Spain): a multivariate approach. Palaeogeog. Palaeoclim. Palaeoecol. 204, 47–64. doi: 10.1016/S0031-0182(03)00721-1
Ruiz, J., Macias, D., Losada, M. A., Diez-Minguito, M., and Prieto, L. (2013). A simple biogeochemical model for estuaries with high sediment loads: application to the Guadalquivir River (SW Iberia). Ecol. Model. 265, 194–206. doi: 10.1016/j.ecolmodel.2013.06.012
Serrano Martín, L., Esquivias Segura, M. P., and Zunzunegui, M. (2008). Long–term hydrological changes over a seventeen-year period in temporary ponds of the Doñana NP (SW Spain). Limnetica 27, 65–77.
Smith, S. D. (1988). Coefficients for sea surface wind stress, heat flux, and wind profiles as a function of wind speed and temperature. J. Geophys. Res. 93, 15467–15472. doi: 10.1029/JC093iC12p15467
Stanley, E. H., Casson, N. J., Christel, S. T., Crawford, J. T., Loken, L. C., and Oliver, S. K. (2016). The ecology of methane in streams and rivers: patterns, controls and global significance. Ecol. Monograph. 86, 146–171 doi: 10.1890/15-1027
Sun, L., Song, C., Miao, Y., Qiao, T., and Gong, C. (2013).Temporal and spatial variability of methane emissions in a northern temperate marsh. Atmos. Environ.81, 356–363. doi: 10.1016/j.atmosenv.2013.09.033
Taggart, M. A., Figuerola, J., Green, A. J., Mateo, R., Deacon, C., Osborn, D., et al. (2006). After the Aznalcollar mine spill: arsenic, zinc, selenium, lead and copper levels in the livers and bones of five waterfowl species. Environ. Res. 100, 349–361. doi: 10.1016/j.envres.2005.07.009
Tong, C., Huang, F. J., Hu, Z. Q., and Jin, Y. F. (2013).Diurnal variations of carbon dioxide, methane, and nitrous oxide vertical fluxes in a subtropical estuarine marsh on neap and spring tide days. Est. Coast. 36, 633–642. doi: 10.1007/s12237-013-9596-1
Turetsky, M. R., Kotowska, A., Bubier, J., Dise, N. B., Crill, P., Hornibrook, E. R., et al. (2014). A synthesis of methane emissions from 71 northern, temperate, and subtropical wetlands. Glob. Change Biol. 20, 2183–2197. doi: 10.1111/gcb.12580
Upstill-Goddard, R. C., and Barnes, J. (2016). Methane emissions from UK estuaries: re-evaluating the estuarine source of tropospheric methane from Europe. Mar Chem. 180, 14–23. doi: 10.1016/j.marchem.2016.01.010
Upstill-Goddard, R. C., Salter, M. E., Mann, P. J., Barnes, J., Poulsen, J., Dinga, B., et al. (2017). The riverine source of CH 4 and N 2 O from the Republic of Congo, western Congo Basin. Biogeoscience 14, 2267–2281. doi: 10.5194/bg-14-2267-2017
vanDijk, G., Smolders, A. J. P., Loeb, R., Bout, A., Roelofs, J. G. M., and Lamers, L. P. M. (2015). Salinization of coastal freshwater wetlands; effects of constant versus fluctuating salinity on sediment biogeochemistry. Biogeochem 126, 71–84. doi: 10.1007/s10533-015-0140-1
Wanninkhof, R. (1992). Relationship between wind speed and gas exchange. J. Geophys. Res. 97, 7373–7382. doi: 10.1029/92JC00188
Welti, N., Hayes, M., and Lockington, D. (2017). Seasonal nitrous oxide and methane emissions across a subtropical estuarine salinity gradient. Biogeochem 132, 55–69. doi: 10.1007/s10533-016-0287-4
Weston, N. B., Vile, M. A., Neubauer, S. C., and Velinsky, D. J. (2011). Accelerated microbial organic matter mineralization following salt-water intrusion into tidal freshwater marsh soils. Biogeochem 102, 135–151. doi: 10.1007/s10533-010-9427-4
Wiesenburg, D. A., and Guinasso, N. L. Jr. (1979). Equilibrium solubilities of methane, carbon monoxide, and hydrogen in water and sea water. J. Chem. Eng. Data 24, 356–360. doi: 10.1021/je60083a006
Yang (2013). Methane emissions from rice fields under continuous straw return in the middle-lower reaches of the Yangtze River. J. Environ. Sci. 25, 1874–1881. doi: 10.1016/S1001-0742(12)60273-3
Keywords: Doñana, methane, saltmarshes, emissions, Guadalquivir estuary
Citation: Huertas IE, de la Paz M, Perez FF, Navarro G and Flecha S (2019) Methane Emissions From the Salt Marshes of Doñana Wetlands: Spatio-Temporal Variability and Controlling Factors. Front. Ecol. Evol. 7:32. doi: 10.3389/fevo.2019.00032
Received: 01 October 2018; Accepted: 28 January 2019;
Published: 19 February 2019.
Edited by:
Alberto Vieira Borges, University of Liège, BelgiumReviewed by:
Luis Zambrano, National Autonomous University of Mexico, MexicoDamien Troy Maher, Southern Cross University, Australia
Copyright © 2019 Huertas, de la Paz, Perez, Navarro and Flecha. This is an open-access article distributed under the terms of the Creative Commons Attribution License (CC BY). The use, distribution or reproduction in other forums is permitted, provided the original author(s) and the copyright owner(s) are credited and that the original publication in this journal is cited, in accordance with accepted academic practice. No use, distribution or reproduction is permitted which does not comply with these terms.
*Correspondence: I. Emma Huertas, emma.huertas@icman.csic.es