

Abstract
We report a magnetically-focusing biochip structure enabling a single layered magnetic trap-and-release cycle for biosensors with an improved detection speed and selectivity. Here, magnetic beads functionalized with specific receptor molecules were utilized to trap target molecules in a solution and transport actively to and away from the sensor surfaces to enhance the detection speed and reduce the non-specific bindings, respectively. Using our method, we demonstrated the high speed detection of IL-13 antigens with the improved detection speed by more than an order of magnitude. Furthermore, the release step in our method was found to reduce the non-specific bindings and improve the selectivity and sensitivity of biosensors. This method is a simple but powerful strategy and should open up various applications such as ultra-fast biosensors for point-of-care services.
Export citation and abstract BibTeX RIS
1. Introduction
In biosensors, the binding of target molecules onto the specific receptor molecules fixed on sensor surfaces is detected by the transducer of the sensors [1–6]. Such a simple biosensor strategy has been extensively utilized for versatile bio- and medical applications. In most of conventional biosensors, a detection speed usually depends on the diffusion of target molecules in a solution. Thus, at a low concentration solution of target molecules, it may take a very long time for an enough number of target molecules to diffuse toward the sensor surfaces and to give a sensing signal [7]. For example, a reaction time between antibody and antigen proteins is about 2 h in commercial enzyme-linked immunosorbent assay (ELISA) [8–10]. However, for many practical applications such as point-of-care and emergency situations, it is highly important to reduce the detection time of biosensors [11]. There have been some previous efforts to actively drive target molecules to sensor surfaces using electric or magnetic methods instead of waiting for target molecular diffusion. For instance, target molecules such as nucleic acid and proteins can be guided toward a sensor element through the utilization of electrostatic fields from electrodes [12]. Additionally, magnetic field-assisted aggregation method was utilized for the trapping of target antigens [13–16]. Also, optomagnetic immunoassay technologies using magnetic beads and external magnetic fields were developed for the rapid detection of target molecules [17–20]. In these methods, magnetic beads captured target in a solution and they were trapped and released repeatedly on a sensor surface by external magnetic fields, which increased the collision frequency between the target molecules and receptors on the sensor and enhanced the sensing speed. However, these methods often suffered from some limitations. For instance, electric fields to transport the biomolecules in solution may damage the target molecules. Magnetic field-assisted aggregation method was mainly utilized to concentrate the target solution, while it may increase the non-specific bindings and reduce the selectivity of the sensors. The repeated trap-and-release cycles via external magnetic fields may result in the aggregation of magnetic particles and limit the number of possible cycles.
Herein, we report a magnetically-focusing biochip structure for high-speed active biosensing with an improved selectivity. In this method, target molecules trapped by functionalized magnetic beads were driven repeatedly to (trapping) and away from (releasing) a functionalized ferromagnetic patterns on a biochip surface via magnetic field cycles, which increased the collision frequency between target molecules and sensor surfaces and enhanced its detection speed. Importantly, since magnetic field gradients occurred only near nickel patterns, the trapped magnetic beads formed a single layer on the sensor surface without forming a large aggregation, which minimized the degradation of the magnetic bead solution. Furthermore, the bindings of magnetic beads were highly focused only on the ferromagnetic patterns on the sensor surface, which allows us to concentrate target molecules only on the sensor surfaces while avoiding non-specific binding on other surface area. Using this method, we demonstrated ∼100 times faster detection speed compared with a conventional sandwich assay. Furthermore, the release step removed molecules bound to sensor surfaces non-specifically with weak binding forces, reducing the non-specific bindings by more than 50%. This strategy allows us to overcome the fundamental speed limitation of conventional passive sensors relying on target molecular diffusion. Furthermore, it minimizes the formation of magnetic bead aggregations and non-specific adsorption which often have been problems in magnetically-driven sensors. Since the sensing speed and selectivity of biochips are often critical in achieving high performance biosensors, our structures can be utilized for versatile bio- and medical applications.
2. Experimental methods
2.1. Fabrication of nickel patterns on silicon substrate
Ferromagnetic nickel patterns (5 μm × 10 μm) were fabricated on a SiO2 substrate (100 nm thick SiO2 film on a Si wafer) through conventional microfabrication processes. At first, a photoresist (AZ5214) layer was coated on the SiO2 substrate using a spin coater (DONG AH TRADE CORP, ACE-200) and patterned via photolithography. Afterwards, a nickel film was thermally evaporated on the substrate, and the photoresist layer was rinsed with acetone. Under ambient conditions, we can expect the surface of nickel was oxidized [21]. To reduce non-specific bindings on the nickel patterns, the additional layer of silicon oxide (50 nm) was chemically deposited to the surface of the substrate.
2.2. Experimental procedure for the magnetic trap-and-release cycles of superparamagnetic nanobeads on nickel patterned substrate
Nanobeads (Nano-screenMAG-Streptavidin, hydrodynamic diameter of 100 nm) were purchased from Chemicell GmbH, Germany [22]. A nickel-patterned substrate was immersed in the 1% solution of bovine serum albumin (BSA) in a phosphate buffered saline (PBS) solution for 2 h for the passivation of the substrate. For repeated magnetic trap-and-release cycle experiments, a flow cell was constructed by covering the substrate with a sheet of a cover glass using 3 M double-sided tapes as a spacer. Then, it was placed on an inverted fluorescence microscope (TE2000U, Nikon, Japan) at a rhodamin channel. A solenoid (NS Magnet, Korea) which comprised 7500 turned electric wires and a 1.5 cm × 6.3 cm cylindrical iron core was purchased and placed on the stage of the microscope for generating external magnetic fields. Here, we generated magnetic fields following these four steps: an upward magnetic field (150 mT), a downward magnetic field (35 mT), a downward magnetic field (150 mT), and an upward magnetic field (35 mT) for the 1st trap, 1st release, 2nd trap, and 2nd release of magnetic nanobeads. The strengths of applied magnetic fields were determined to achieve an efficient trapping and a clean release during the repeated cycles [23]. The movement and distribution of magnetic beads were recorded by the fluorescence microscope.
2.3. Sensing operation of IL-13 antigen using magnetic trap-and-release cycle
Ready-set-go IL-13 ELISA Kit was purchased from eBioscience (USA). This kit is composed of IL-13 capture antibody (used as 2nd antibody), biotinylated IL-13 detection antibody (used as 1st antibody), and IL-13 antigen (used as target molecule). For the functionalization of a substrate with 2nd antibodies, a nickel patterned substrate was subjected to a commonly used silanization technique [24]. First, the substrate was incubated in the 2% solution of 3-mercaptpropyltrimethoxysilane (MTS) in anhydrous toluene for 2 h. Then, the substrate was thoroughly washed with anhydrous toluene and allowed to dry at a room temperature. To functionalize the silanized substrate with heterobifunctional linker molecules, organic hetrobifunctional crosslinker molecules (N-γ-maleimido-butyryloxy succinimide ester (GMBS)) were dissolved in 100 μl of dimethylformamide (DMF) and then diluted with ethanol to the final concentration of 2 mM. The silanized substrate was immersed in a cross-linker solution for 1 h and washed three times with a PBS buffer. Afterward, 0.15 mg ml−1 solution of 2nd IL-13 antibody in a PBS buffer was placed on the substrate and allowed to react for 2 h at a room temperature. Residual unreacted antibodies were washed with a PBS buffer. Finally, the substrate was immersed in the 1% solution of BSA in PBS for 2 h to passivate antibody–free regions [25]. Afterwards, the substrate was placed on a microscope. The solution of biotin-labelled IL-13 antibodies from the ELISA kit was utilized for the conjugation of 1st antibodies and magnetic nanobeads. 100 μl solution of the magnetic nanobeads (0.1 mg ml−1 in PBS solution) was mixed with the 20 μl solution of the 1st antibody (1 mg ml−1 in PBS solution), and the mixed solution was incubated at a room temperature for 1 h. 50 μl solution of IL-13 1st antibody functionalized magnetic nanobeads and IL-13 antigen mixture was injected to the flow cell. The concentrations of used IL-13 solution were 0.1, 1, 10, 100 and 200 ng ml−1. The concentration of magnetic nanobeads for optimal results was determined by the control experiments (figure S1 in supplementary data is available online at stacks.iop.org/NANO/29/265501/mmedia). Note that the high concentration of magnetic nanobeads increased sensor signals, while it also increased non-specific binding due to the aggregation of the nanobeads. Afterwards, external magnetic fields were applied to perform the trap-and-release cycle for the detection of the antigen molecules. The movement and distribution of magnetic beads were recorded by the fluorescence microscope.
2.4. Conventional ELISA test procedure on the nickel patterned substrate
We prepared 2nd antibody-functionalized substrate through the same process as mentioned in the previous section. Then, the substrate was divided into small pieces (3 mm × 3 mm) to place into commonly used 96 well microplate. The wells with divided substrates were passivated by 1% solution of BSA for 2 h and washed by wash buffer (TWEEN-20, 0.5% in PBS) three times. After that, we placed 100 μl solutions of antigen on the nickel patterned substrate with different concentrations and incubated for given time intervals (0, 5, 10, 20, 30, 65 and 95 min). After the incubation, the substrate was rinsed with the wash buffer three times. Then, each substrate was incubated with 100 μl solution of secondary antibody for 1 h and washed with the wash buffer three times. Subsequently, the substrate was incubated in streptavidin labelled horse radish peroxidase solution for 30 min and washed with the wash buffer for seven times. Afterward, the substrate was incubated in 3,3',5,5'-tetramethylbenzidine solution of 100 μl and let to react for 15 min. Finally, the stop solution composed of 1 M phosphoric acid (50 μl) was added to stop the reaction, and the absorbance of the assay solution was obtained using a microplate reader.
3. Results and discussion
Figure 1 shows a schematic diagram depicting our active trapping strategy based on magnetically-focusing biochip structures. Detailed processes are presented in the experimental section. Briefly, ferromagnetic nickel patterns were fabricated on a sensor surface by a photolithography and a thermal evaporation process. The nickel patterns and substrate were covered with a SiO2 layer through a chemical vapour deposition process [26]. Afterwards, 2nd antibodies were immobilized on the sensor surface by a commonly used silanization technique. For the detection of target molecules, the solutions of target molecules and superparamagnetic nanobeads coated with a 1st antibody were introduced on the sensor surface. Here, due to the rather high concentration of magnetic beads, the target molecules were expected to bind to the 1st antibody on the bead surface rather quickly [7]. Then, the magnetic nanobeads were trapped onto the ferromagnetic pattern surfaces by applying a rather strong magnetic field (H-field, 150 mT) in a perpendicular direction to the sensor surface (figure 1(A)). In this step, the external magnetic field magnetized the nickel patterns with the same direction as the magnetic field, and total magnetic fields (B-field) just above the patterns became stronger than those of other regions. Thus, the magnetic nanobeads were transported to and trapped on the nickel patterns due to magnetic field gradients, and the antigens attached on the magnetic beads might formed specific bindings with 2nd antibodies on the nickel patterns [27, 28]. Significantly, since such strong magnetic field gradients existed only near the nickel patterns, we could control the thickness of the trapped magnetic particles down to a single layer by adjusting the thickness of the patterns. In the following release step to remove non-specific bindings, a rather weak magnetic field (35 mT) was applied in an opposite direction to the previous applied magnetic field (figure 1(B)). Here, the weak external magnetic field could not change the magnetization direction of the nickel patterns due to the ferromagnetism of nickel, and total magnetic fields just above the patterns became weaker than those of other regions. Thus, the magnetic beads which did not form specific bindings on the ferromagnetic bindings were driven away from the nickel patterns. These trap-and-release cycles were repeated until we achieve a significant sensor signal (figures 1(C) and (D)). As a proof of concepts, we measured the fluorescence intensity of magnetic bead accumulated on the nickel patterns during the release cycle as a sensor signal and used the signal to compare the detection speed of our strategy with that of conventional sensors. Note that the trapping step actively transported target molecules onto the sensor surface to enhance the detection speed, while the releasing step removed weakly-bound molecules from the sensor surface to reduce the non-specific bindings. Thus, this strategy can allow us to improve both detection speed and sensor selectivity. Furthermore, using a proper thickness of nickel patterns, we could trap a single layer of magnetic particles only onto specific sensor regions, which should have reduced the aggregation of magnetic particles.
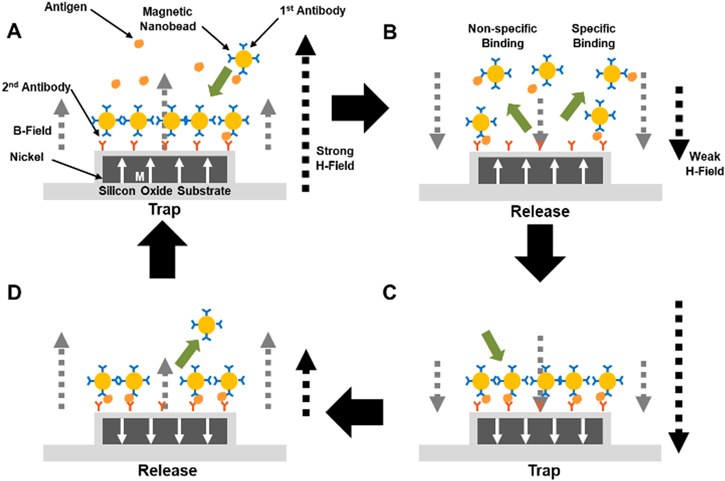
Figure 1. Schematic diagram depicting the magnetically-focusing biochip structures and the trap-and-release cycles using the structures for high speed biosensing. (A) 1st trapping step of magnetic nanobeads. An applied magnetic field in perpendicular direction to the substrate magnetized the nickel patterns, and thus total magnetic field above the nickel pattern became stronger than on other regions. Then the magnetic nanobeads were trapped on the nickel patterns and formed a single-layered structure. (B) 1st release step of magnetic nanobeads. A rather weak magnetic field in an opposite direction to previous magnetic fields was applied so that it did not change the magnetization direction of the patterns. Total magnetic fields above the nickel patterns became weaker than on other regions. Magnetic nanobeads which did not form a specific binding were released from the nickel patterns, while magnetic nanobeads which formed a specific binding remained on the patterns. (C) 2nd trapping step of magnetic nanobeads. A rather strong magnetic field was applied and changed the magnetization direction of the patterns, and thus total magnetic field above the nickel patterns became stronger than on other regions. The magnetic nanobeads were trapped on the nickel patterns as a single layer. (D) 2nd release step of magnetic nanobeads. A rather weak magnetic field in the opposite direction to the previous magnetic field was applied and did not change the magnetization direction of the patterns. Total magnetic fields above the nickel patterns became weaker than on the other region. Magnetic nanobeads which did not form a specific binding released on the nickel patterns, while magnetic nanobeads which formed a specific binding remained on the patterns.
Download figure:
Standard image High-resolution imageFigure 2(A) depicts simulation results showing magnetic field intensities around a nickel structure when external magnetic fields were applied during trap-and-release cycles. The simulations were performed using COMSOL Multiphysics software at four different external magnetic field conditions which correspond to steps in figure 1. When a strong external magnetic field was applied with an upward direction, the nickel structure was magnetized in the same direction to an external magnetic field (figure 2(A)(i)). In this case, the magnetized nickel structure made magnetic fields just above the structure much stronger than in other regions (brighter region in figure 2(A)(i)). Thus, we could expect that superparamagnetic nanobeads can be attracted toward the nickel structure because magnetic dipoles are driven to the regions with a stronger magnetic field (trapping step in figure 1(A)) [27, 28]. On the other hand, when a rather weak external magnetic field was applied with a downward direction which is opposite to the magnetization direction of the nickel structure, the magnetization direction of a nickel structure did not change because of the hysteresis of nickel (release step in figure 2(A)(ii)). As a result, the magnetic field just above the structure became weaker than in other region. Thus, it is expected that the magnetic nanobeads can be released from the magnetized nickel structure, which corresponds to the 1st release in figure 1. Figures 2(A)(iii) and (iv) show similar results which also correspond to the 2nd trap and 2nd release steps in figure 1, respectively. These results show that the cycles of externals magnetic fields and hysteresis of nickel patterns can create proper magnetic field distribution for our trap-and-release cycle.
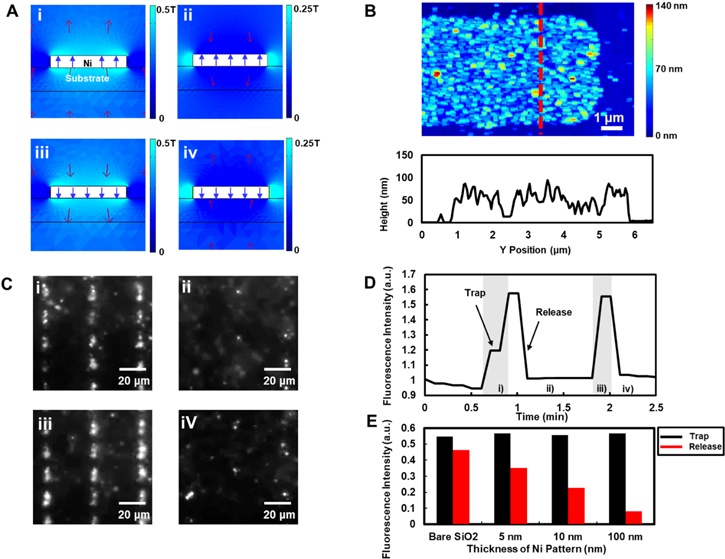
Figure 2. Trapping and releasing of a single layer of magnetic nanobeads on bare magnetically-focusing biochip structures. (A) Simulation results showing the total magnetic fields around a nickel pattern. Red arrows depict the direction and intensity of magnetic fields. Brighter blue regions represent the regions with stronger magnetic fields. (i)–(iv) Represent 1st trapping, 1st release, 2nd trapping, 2nd release cycles, respectively. (B) AFM image of single-layered magnetic nanobeads on a nickel pattern and cross section. A red-dotted line indicates the position of the cross section. (C) Fluorescence images of trap-and-release cycles on nickel patterns. (i)–(iv) Represent 1st trapping, 1st release, 2nd trapping, 2nd release cycles, respectively. The trapping times for (i) and (iii) were about 15 s and 10 s, respectively. The release times for (ii) and (iv) were about 45 s and 30 s, respectively. Brighter regions represent the distribution of fluorescence-dye-functionalized magnetic nanobeads. (D) Graph showing the fluorescence intensity change of microscope images during trap-and-release cycles of figure 2(B). Grey and white regions indicate the trapping and release steps, respectively. (E) Bar graph showing the dependence of the trap-and-release efficiency on the nickel pattern thickness. Black and red bars indicate the fluorescence intensities of microscope images when the magnetic nanobeads were trapped and released, respectively.
Download figure:
Standard image High-resolution imageFigure 2(B) shows the AFM topography image and its cross section of a magnetically-focusing biochip structure after trapping process. A magnetic field of 150 mT was applied to a nickel patterned substrate and a magnetic nanobeads solution on the substrate. Afterwards, the surface of the dried substrate was measured by AFM. The image shows that most of nanobeads were trapped on the nickel pattern due to the ferromagnetism of nickel. A cross section of red dotted line of the AFM image shows that the height of nanobeads was nearly uniform. These results indicate that the magnetic nanobeads formed a single layered structure on the nickel pattern without aggregations, which should have allowed the repeated trap-and-release without a minimal aggregation of magnetic beads.
Figure 2(C) shows the fluorescence microscopic images of fluorescence-labelled magnetic nanobeads (without antibody) trapped on nickel patterns of a magnetically-focusing biochip structure during trap-and-release cycles. Brightness represents the fluorescence intensity of fluorescence-labelled magnetic nanobeads on the substrate. It is showed that magnetic beads were concentrated to nickel patterns during 1st and 2nd trapping (figures 2(C)(i) and (iii)). When a strong external magnetic field was applied in one direction that is perpendicular to the plane of the substrate, the magnetic nanobeads were drawn towards the nickel patterns on the substrate. On the other hand, it is shown that the magnetic nanobeads were dispersed in the solution during 1st and 2nd release steps (figures 2(C)(ii) and (iv)). When a rather weak external magnetic field was applied in an opposite direction, most of the magnetic nanobeads were pushed away from the nickel patterns, which decreased the fluorescence intensity. For the quantified analysis, the fluorescence intensity of each frame was measured and plotted in figure 2(D). In the trapping step, the fluorescence intensity increased quickly. In the release step, the fluorescence intensity was recovered quickly back to its original values. These result indicates we can repeat the trap-and-release cycle without causing degradations or damages of our sensors.
Figure 2(E) shows fluorescence intensity changes of the magnetic nanobeads on the nickel patterns during the trap-and-release cycles using a bare SiO2 substrate or nickel patterns with different thickness of 5, 10, and 100 nm. In bare substrate without ferromagnetic patterns, trapped magnetic nanobeads were not much released from the substrate during the release step. On the other hand, as nickel thicknesses increased, the amounts of released magnetic nanobeads increased, providing a clear contrast. These results shows that the nickel patterns play an important role in releasing magnetic nanobeads from the sensor surface, which can be critical in removing non-specifically-bound nanobeads from the sensor surface.
Figure 3(A) shows schematic diagrams depicting three different antigen detection experiments performed to demonstrate the improved detection speed of our sensing strategy. Figure 3(A)(i) shows our detection process with trap-and-release cycles on a magnetically-focusing biochip structure explained in the figure 1. Here, we utilized 1st and 2nd antibodies of IL-13 to functionalize magnetic nanobeads and nickel patterns, respectively. We repeated trap-and-release cycles while recording the fluorescence intensity of the fluorescence-labelled magnetic nanobeads on the nickel patterns by the CCD camera in the fluorescence microscope. Figure 3(A)(ii) shows a sandwich type detection method using the same materials without trap-and-release cycles. In this case, both target molecules and magnetic beads should diffuse randomly until they bind to the sensor surface just like conventional sandwich assays. We also measure the binding speed when only antigens bind with antibody without magnetic beads (figure 3(A)(iii)). In this case, the antigens diffuse randomly to be trapped on the antibodies of the sensor surfaces, and the amount of bound antigens was estimated using the conventional ELISA method [29–31].
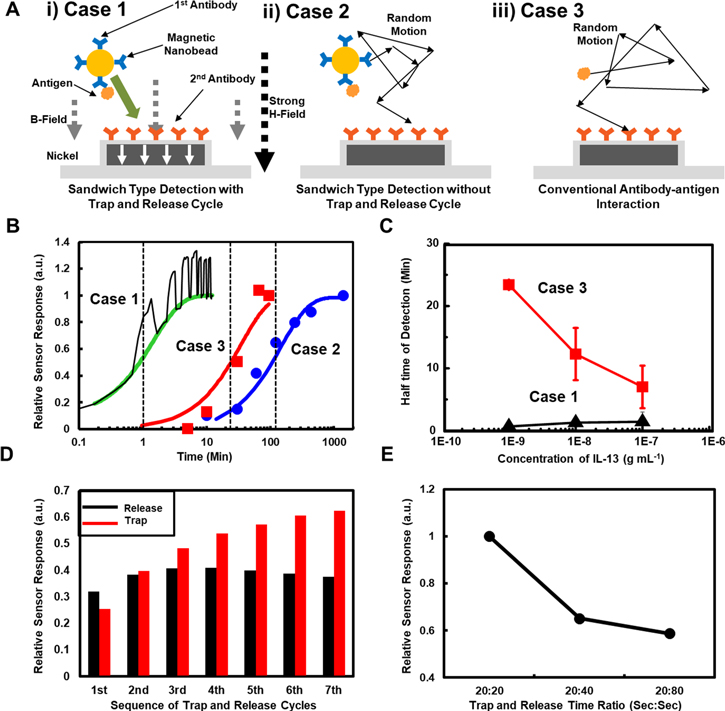
Figure 3. High-speed detection using functionalized magnetically-focusing biochip structures. (A) Three different schemes of antigen detections: (i) sandwich type detection with trap-and-release cycle, (ii) sandwich type detection without trap-and-release cycle, and (iii) conventional antibody-antigen interactions. (B) Normalized reaction graph from the detection experiments using the methods of (A)(i)–(iii). (C) Half-time of detection using different concentration solutions of IL-13 antigens. Black and red dots indicate the data with or without the trap-and-release cycles, respectively. (D) Accumulated differences of the fluorescence intensities during the trap (red bars) and release periods. The 100 ng ml−1 of IL-13 antigen solution was used as a target solution. (E) Relative sensor responses by the sandwich assay with trap-and-release cycles with a different ratio of trap-and-release times.
Download figure:
Standard image High-resolution imageFigure 3(B) shows a normalized reaction graph during three different experiments of IL-13 antigen detection as shown in figure 3(A). The black line depicts normalized fluorescence intensities during the sandwich type detection with trap-and-release cycles (case 1). Trapping and release times were 50 s and 50 s, respectively. Note that the intensities were rapidly increased and decreased over the time, which were caused by the trapping and release of magnetic nanobeads by the nickel patterns, respectively. When rather strong magnetic fields were applied, magnetic nanobeads were attracted to a nickel pattern so that fluorescence intensity increased. On the other hands, fluorescence intensity decreased in the release step because of the release of magnetic nanobeads which were not bound to 2nd antibodies on the sensor surface. As the trap and release steps were repeated, the overall fluorescence levels increased, indicating the selective binding of target molecules and magnetic beads on the sensor surfaces. Here, we utilized the fluorescence intensity values at release steps as a sensor signal because magnetic beads can remain on the sensor surface non-specifically by magnetic fields in trapping steps. Blue and red dots represent the experimental results of the sandwich detection without trap-and-release cycles (case 2) and target detection via ELISA (case 3), respectively. We utilized 1 ng ml−1, 100 ng ml−1, and 1 ng ml−1 solutions of IL-13 antigen as a target solution for the case 1, 2, and 3, respectively. The reaction graph can be fitted using the exponential decay model like [32],


where, N0, N(t), τ, and t1/2 indicate the quantity of saturated response, a sensor response, a time constant, and half-time which is relevant to a saturation time, respectively. The green, blue, and red lines in figure 3(B) are fitting curves for case 1, case 2, and case 3, respectively. The half-time represents the time when the level of sensor response is a half of the saturated response. The estimated half-time for the sandwich assays with (case 1) or without (case 2) the trap-and-release cycles were ∼1.2 min and ∼107 min, respectively. Also, it should be mentioned that the concentration of the target solution for case 2 (without trap-and-release cycles) was 100 times higher than that of case 1 (with the cycles). It clearly shows that the trap-and-release cycles can enhance the detection speed by more an order of magnitude even in a very low concentration target solution. The case 3 represents the reaction graph only for target antigen bindings, and its half time was estimated as ∼23.5 min. However, to achieve the detection signals, it required additional processes such as the binding of 2nd antibody and enzyme, and enzymatic reactions, which takes about 100 min. Thus, the effective half-time including entire process can be ∼120 min, which is much longer than that of the trap-and-release cycle-based detection in case 1. It indicates that the entire detection time for our method can be even shorter than the time only for the binding of only target antigens with a much higher concentration.
Figure 3(C) shows the half-time values for the reactions with various concentrations of IL-13 antigen in the sandwich detection experiments with (case 1, black triangles) or without (case 2, red squares) trap-and release cycles. Note that the half-time values for the detection experiments without trap-and-release cycles (case 3) decreased as the target concentration increased. Previous works show that the detection time for conventional passive sensors can be very long in a rather low concentration target solution [30]. It is because in low concentration solution, only a small number of target molecules diffuse randomly, and it takes a rather long time for the sensor surface to capture enough number of diffusion target molecules for sensing signals. On the other hand, the detection time with our trap-and-release cycles does not change much at different concentration solutions. Presumably, it is because our method uses a number of magnetic beads to capture target molecules and bring them actively to the sensor surfaces, which does not rely on the random diffusion of target molecules. And, thus, the detection speed of our detection method is not limited by the fundamental limitations of conventional passive sensors relying on molecular diffusion.
Figure 3(D) shows the accumulated differences of sensor signals after each trap (red bars) and release (black bars) step. Here, we first measured the differences before and after each trap or release step, and they were accumulated up to a specific step to calculate the accumulated difference value for the step. The 100 ng ml−1 of IL-13 antigen solution was used as a target solution. Since the magnetic forces tend to move magnetic beads away from the sensor surface in the release step, the accumulated difference data of the release step represent the target binding mainly by random diffusion of target molecules. On the other hand, since magnetic beads with captured target molecules were driven to the sensor surface by magnetic fields in the trapping steps, the data of the trapping step represents the detection by active trapping. Note that the diffusion driven binding has a rather large portion in the first cycle, presumably because the biochemical reaction speed is commonly fastest when the reaction is started. However, as the cycles were repeated, the target binding by random molecular diffusion was slowed down and saturated (black bars), while more target antigens were captured on the sensor surface by active trapping via magnetic forces (red bars). These results imply that the active transport process of antigens in our strategy can, in effect, accelerate antibody-antigen reaction speed and allow us to overcome the fundamental speed limitations of conventional bio-sensors based on molecular diffusion.
We performed the detection experiments with different time periods of trapping or release steps (figure 3(E)). Here, we measured the response of our sensor by changing the release times as 20, 40, and 80 s with a trap time of 20 s. Then, the sensor responses were measured after repeated trap-and-release cycles for 12 min. The concentration of IL-13 target antigen solution was 10 ng ml−1. Note that the sensor response with a relatively shorter release time has larger sensor signals even with the same total reaction time. This result indicates that the active trapping during the trapping step gives a major contribution for the sensor responses in our method, which is also consistent with the result in figure 3(D).
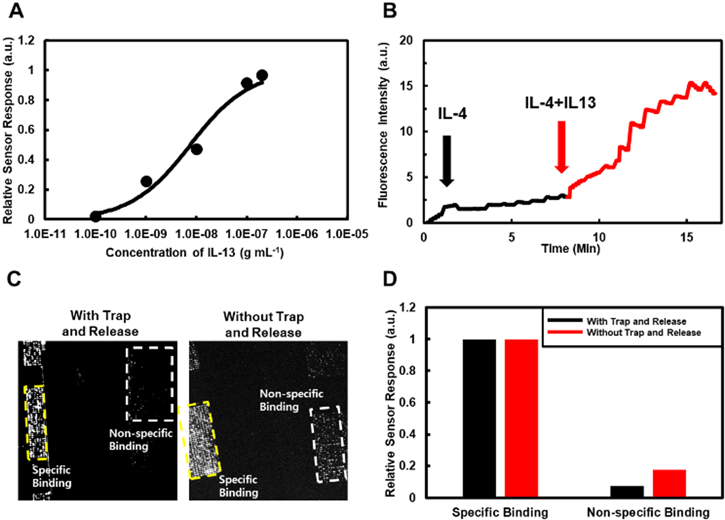
Figure 4(A) shows a graph depicting the normalized response curves of our detection experiments with different target concentrations ranging from 0.1 to 200 ng ml−1. Here, we performed the detection experiments using our trap-and-release cycles on magnetically-focusing biochip structures and normalized the sensor response data by saturated values. The result was fitted by the Langmuir isotherm model (black line) to estimate the binding constant Kd [33, 34]. The Kd value estimated from the fitting curve was 8.9 ±2.08 ng ml−1, which is consistent with the results reported previously [35]. Also, note that the standard deviation of the measured Kd value was about ∼23%, which is similar to those measured by conventional fluorescence assay or SPR methods based on the static equilibrium of molecular bindings [35, 36]. Previous works also show versatile advanced measurement methods relying on dynamic processes. For example, AFM or optical tweezer methods using the dynamic motions of nanoprobes or beads have been utilized to measure Kd values with different distributions. In this case, such distributions of the measured data were attributed to various factors such as the multivalency of used probes and the probe velocity at the release step [37, 38]. Previously, it was reported that the multivalancy of antibody-antigen interactions on the probe surfaces affects the dissociation rate and causes a rather large distribution of Kd [39]. The standard deviation of Kd values measured by some previous AFM methods using a rather high-density molecular layer on the probe was about 50%–100% [37, 40]. However, in our case, the estimated number of attached antibodies on the beads was only 15–20 and, thus, the surface coverage of antibodies on our magnetic beads was just 2%. Considering that previous optical tweezer experiments with a similar small surface coverage resulted in a rather small distribution of the measured data close to our results, we can expect the multivalency effect in our experiment did not significantly increase the distribution of our data [23, 41]. Furthermore, in AFM or optical tweezer measurements, the unbinding force rate during the Kd measurement can significantly affect the measured data, often resulting in a rather large distribution in the measured data [42]. However, the force applied to the bead during the release step in our experiments was estimated as only ∼1 pN which was much smaller that the common unbinding forces of about 50–100 pN between ab-ag and should not break the specific bindings between the beads and sensor surfaces [37, 43]. Since our process does not unbind the molecules, the effect of bead speeds on the distribution of measured data should be small, and we can analyse our measurement data like conventional sandwich assay processes. In a common sandwich assay, the 1st and 2nd antibodies can have different Kd values. In this case, the dose-dependent reaction curves are mainly determined by the first reaction (figure S2, and table S1 in supplementary data). In our detection experiment, the target antigens should first bind to the 1st antibody on the magnetic beads in solution, and they were driven to the sensor surface for the binding to the 2nd antibody. Thus, the responses curves in our method should be determined mainly by the 1st antibody reactions on the magnetic beads. Previous works and our control experiments using SPR methods showed a trend that the Kd value of the 1st antibody for IL-13 was approximately ∼10 times larger than that of 2nd antibody at given reaction conditions (figure S3 in supplementary data) [44]. Interestingly, in case 3 where target antigens bound first to the 2nd antibody, the estimated Kd value of ∼1 ng ml−1 was 10 times smaller than that of case 1 (figure S4 in supplementary data). This trend is also consistent with the results reported previously and those obtained in our SPR control.
Figure 4. Improved selectivity via magnetically-focusing biochip structures. (A) Normalized sensor response curves with different concentrations of IL-13 antigens by sandwich assay with trap-and- release cycles. (B) Real time response curves in mixed samples. Black line depicts the injection of IL-4 which is for a negative control, and red line depicts the injection of IL-13 which is a specific target. (C) Fluorescence images after the sandwich assay of IL-13 with or without trap-and-release cycles on the substrates including the regions of different molecular layers. The regions marked by 'specific binding' was coated with 1st antibody of IL-13. The regions marked by 'Non-specific binding' was coated with BSA. (D) Normalized fluorescence intensities measured from the regions marked by yellow and white squares in figure 4(C). The measured intensity was normalized by that of the specific binding regions.
Download figure:
Standard image High-resolution image
Figure 4(B) shows normalized fluorescence intensity changes in the detection experiment using mixed antigen solution. Detailed processes are in the experimental section. Briefly, the solution of IL-4 antigen (10 ng ml−1) was first injected to the IL-13 antibody-functionalized sensor surface for a negative control, and the detection processes were performed using the trap-and-release cycle with IL-13 antibody functionalized magnetic beads (black line). Then, the solution of IL-13 antigen (10 ng ml−1) was introduced to the substrate for the positive control, and we performed sensing experiments using the trap-and-release cycle for 9 min (red line). Note that the IL-13 reaction was performed in the mixed solution of IL-13 and IL-4 antigens. The sensor signals did not change much when the non-specific IL-4 was injected. However, the injection of specific IL-13 target antigen rapidly increased the sensor signals even in the mixed solution of IL-13 and IL-4. It shows that our sensor can selectively detect specific target molecules even in a mixed solution.
We prepared a substrate including the regions functionalized with two different molecular layers and performed the detection experiments with (left image in figure 4(C)) or without (right image in figure 4(C)) the trap-and-release cycles on the magnetically-focusing biochip structures. Detailed procedures are presented in the experimental section. In brief, one substrate was functionalized with IL-13 and passivated with BSA, and another one was only passivated with BSA. The two substrates were attached close on the clean silicon substrate by double sided tape. IL-13 antigens (100 ng ml−1) and magnetic bead with IL-13 antibody were utilized for the detection experiments. The trap and release times for the trap-and-release cycles were 10 s and 50 s, respectively. Note that in both cases, we observed a large fluorescence intensity on the regions functionalized with IL-13 antibodies (marked by 'specific binding'), indicating specific bindings. However, we could observe a much smaller fluorescence intensity on the regions with BSA (marked by 'non-specific binding') when the detection experiment was performed with a trap-and-release cycle (left image in figure 4(C)) than those without it (right image in figure 4(C)). Figure 4(D) shows the normalized fluorescence intensities in the squares of 4C, which allows us to compare the portion of non-specific binding (white squares) with respect to the specific bindings (yellow squares). Black bars represent the results of detection with trap-and-release, and red bars represent the results of detection without trap-and-release. Note that the relative intensity by non-specific binding decreased by ∼60% when the trap-and-release cycles were performed. Presumably, since the non-specific binding forces were usually much weaker than specific binding forces, and magnetic beads were on the nickel patterns as a single layer, the magnetic fields in the release cycles removed only non-specifically bound magnetic beads from the sensor surfaces while leaving specifically bound beads. Note that, for developing a highly-sensitive biosensing method, it is critical to increase its signal-to-noise ratio by reducing noises such as non-specific bindings as well as signal noises [45, 46]. Our method exhibited reduced non-specific bindings while maintaining a similar Kd value for selective bindings. This result indicates that our sensing method can operate at a lower target concentration than conventional methods and thus has, in effect, an improved sensitivity for practical applications.
4. Conclusions
In conclusion, we developed a magnetically-focusing biochip structure to actively drive target molecules onto the specific regions of sensor surfaces for the high speed biosensing with an improved selectivity. As a proof of concept, we performed the sandwich assay of the IL-13 antigens with trap-and-release cycles and showed that the trap-and-release cycles in our method can enhance its detection speed by more than orders of magnitude. Furthermore, we also demonstrated that the release of single layered magnetic beads in our method could reduce non-specific bindings and the aggregation of magnetic beads, improving the selectivity of biosensors. Considering that our method allowed us to overcome the fundamental limitations of conventional biosensors in terms of its speed and selectivity, it should open up versatile biomedical applications such as highly-sensitive and ultra-fast point-of-care systems.
Acknowledgments
This work was supported by the National Research Foundation of Korea (NRF) grant funded by the Ministry of Science, ICT & Future Planning (MSIP) of Korea (No. 2013M3A6B2078961, 2014M3A7B4051591 and 2017R1A2B2006808). This work also has received funding from the European Research Council (ERC) under the European Union's Horizon 2020 Research and Innovation Programme (grant agreement no. 682286).