
Possibilities of Graphitization of Unburned Carbon from Coal Fly Ash
by

Zdzisław Adamczyk
1, 
Joanna Komorek
1,
Barbara Białecka
2,
Joanna Całus-Moszko
2 and
Agnieszka Klupa
2,* 1
Department of Applied Geology, Silesian University of Technology, 44-100 Gliwice, Poland
2
Department of Environmental Monitoring, Central Mining Institute, 40-166 Katowice, Poland
*
Author to whom correspondence should be addressed.
Minerals 2021, 11(9), 1027; https://doi.org/10.3390/min11091027
Submission received: 26 July 2021
/
Revised: 2 September 2021
/
Accepted: 17 September 2021
/
Published: 21 September 2021
(This article belongs to the Special Issue Geochemistry and Mineralogy of Coal-Bearing Rocks)
Abstract
:The paper presents the characteristics of products annealing at the temperatures of 2400 and 3000 °C of unburned carbon from coal fly ash in terms of its possible use as a starting material in the graphitization process. An amorphous substance (organic substance) with an admixture of some minerals has been found in samples subjected to graphitization. However, the graphite phase is dominant in products subjected to graphitization. Studies have also shown a diverse grain morphology in individual samples. The presence of plate-shaped and tube-shaped grains was found. As the graphitization temperature of the starting material increases (2400 and 3000 °C), the specific surface area in the graphitization products decreases. The total pore volume in the samples after the graphitization process was significantly lower than the pore volume of active carbons produced from other unburned carbon. Average pore diameter is similar to the pore diameter in active carbons. The reflectance value of the matrix for the sample graphitized at 3000 °C is characteristic for graphite. Unburned carbon from Polish fly ash can be used as the starting material for graphitization.
1. Introduction
Graphite is a crystalline, polymorphic form of the element carbon C. It is formed as the end product of the transformation of organic matter rich in carbon. Fully ordered, pure graphite is considered to be the final product of the graphitization process.
Natural graphitization appears to be a continuous process. The transformation of carbonaceous matter includes both structural transformations and changes in its composition. In the graphitization process, leading ultimately to graphite formation, transitional phases characterised by different degrees of graphitization can be distinguished: semigraphite, meta anthracite and anthracite.
These phases are distinguished on the basis of the content of C and H elements and the degree of ordering of the internal structure. One of the methods to determine the degree of ordering of the internal structure is the study of optical properties [1]. Until recently, graphite and diamond were the only known allotropic varieties of carbon. However, it turned out that there are two other allotropic forms of carbon: fullerenes and carbon nanotubes (CNTs) [2,3].
Natural graphite is one of the 27 raw materials identified by the EU as critical raw materials of strategic importance for the development of modern, highly advanced technologies [4]. Therefore, the search for alternative sources of critical raw materials, including graphite, is one of the priority actions of the European Union.
Graphite has many unique physical and chemical properties. One of these properties is its high characteristic electrical conductivity, which makes it widely used in electrical and electronic equipment. Graphite is a refractory material with high thermal conductivity and resistance, highly lubricant, chemically inert and corrosion resistant and easily soluble in iron. These special properties enable its diverse applications [5,6,7,8].
Welding rods, casting linings, brake linings, lubricants, refractories, high-temperature seals, brushes in electric motors, and rods in nuclear reactors are produced from graphite or graphite additives. It is used in electrical products and as a filler in rubber products, desulphurising agent, anode material in batteries, and conductive coating as well as in bearings, crucibles, electrodes, steel production, and even in the manufacture of cluster bombs and paints. In the era of automotive development, especially hybrid and electric drives, the use of graphite in batteries is of particular importance [6,8,9,10,11,12,13,14,15,16]. Graphite is also expected to find applications in conductive inks, ultra-thin lighting systems, selectively permeable membranes, and other applications [16].
Natural graphite results from the alteration of sedimentary rocks containing:
- -
- concentrated organic matter: coal seams, bitumen, etc,
- -
- dispersed organic matter: claystones, mudstones, bituminous shales, etc.
Graphite ores are classified as “amorphous” (microcrystalline) and ”crystalline” (“flake” or “lump or chip”) based on ore crystallinity, grain size and morphology [6,7,17]. These forms vary in physical properties, appearance, chemical composition, and impurities. This is due to the type of starting material from which the natural graphite was formed (oil, coal, or other carbon deposits) and the course of the natural graphite formation process [6,17].
In simplified terms, it can be stated that there are three different processes leading to the formation of economic graphite deposits [1]:
- -
- epigenetic graphite deposits, formed from the precipitation of solid carbon from carbon-saturated C-O-H fluids,
- -
- syngenetic graphite deposits formed by metamorphism of carbon,
- -
- carbon matter in sediments,
- -
- contact metamorphism of coal deposits.
Some researchers furthermore point to the occurrence of graphite ores in skarns and high-temperature hydrothermal formations [18,19]. Thus, graphite ores occur in metamorphic rocks such as gneisses, metamorphic schists, quartzites, and marbles [6], as well as transformed coal seams [7]. The degree of metamorphism determines the crystallinity of graphite, allowing its classification into the three forms of occurrence mentioned above. Amorphous graphite (the lowest ore quality) is formed in low metamorphism, while higher metamorphism gives rise to crystalline vein graphites (lumps or chips) and flake crystalline graphites [20].
The genesis of graphite ores indicates that they usually contain silicate and carbonate minerals, varying in type and quantity depending on the deposit, which is why extracting graphite from the ores requires appropriate enrichment. The enrichment process is preceded by the crushing of the ore, followed by a stage of hydrometallurgical or pyrometallurgical purification. Some of these methods generate significant environmental pollution. A common method of ore purification is flotation [8].
In 2019, natural graphite resources were estimated to be approximately 547 million tonnes worldwide, of which 300 million tonnes are located in China [8,21,22,23].
Synthetic graphite is produced by heating structureless carbon at temperatures above 2500 °C. This heat treatment orders the internal structure of the carbon towards a layered graphite structure. The production of synthetic graphite requires a starting material—a carbon source. This usually comes from the oil or coal industry. However, research is ongoing into the use of other carbon sources for the graphitization process, using as precursors coal combustion by-products, various wood species, human hair, mushrooms, apple waste, coffee husks, rice hulls, banana peels, cherry stones, and potato starch, etc. [24,25].
Depending on the raw material used and the heat treatment process, the characteristics of synthetic graphite vary.
Synthetic graphite-based materials can be divided into “primary” and “secondary” types. Primary synthetic graphite is produced in powder form by high-temperature processes under strictly controlled conditions to obtain a product with characteristic, predictable properties. Therefore, it has well-defined properties and a high quality, suitable for specific applications. Secondary graphite is a by-product of electrode manufacture for the steel or aluminium industry [18,25]. Such graphite represents a raw material that varies greatly in terms of purity, density, and crystallite size.
The production process of graphite materials consists, similarly to the processing of natural graphite, of three main steps: pre-treatment of starting materials, graphitization, and refinement of graphite particles [25].
Graphite materials are very valuable products with many industrial applications [17,26]. Global demand for mobile energy storage systems such as lithium-ion batteries is expected to increase due to the production of electric vehicles, thus affecting the graphite market both in terms of production and price [27]. In addition to the petroleum coke currently used for the production of synthetic graphite, efforts are being made to search for new precursors of graphite materials that are easily graphitised [27]. As raw materials for the preparation of graphite, most researchers use a high-quality carbon such as anthracite. Work is also being carried out to use low-carbon coal such as lignite as a raw material for the production of porous graphite materials [28].
Studies have also been carried out to analyse the suitability of unburned carbon (UC) from the power plant ash for graphite production [27,29,30]. Graphite-like materials with very stable electrical properties have been obtained from them by high-temperature processing, allowing them to be used, for example, in lithium-ion batteries [27,29,31].
The disposal of fly ash causes a number of economic and environmental problems around the world since its reuse in concrete and cement production (the main use of fly ash) is limited by the proportion of unburned carbon [32,33,34,35]. The separation and further use of this carbonaceous material, as a precursor for products such as graphite, would help to compensate for the above-mentioned problems. Unburned carbon from fly ash can indicate an inefficient fuel combustion process [36], at the same time it can be a source of activated carbon [37,38,39].
The various methods that are used for unburned carbon recovery from carbon fly ash. Methods such as wet separation methods—froth flotation, oil agglomeration, and density separation (Sink-Float technique)—and dry separation methods—separation by size classification, electrostatic separation, incipient fluidization, and tribo-electrostatic separation, described above deserve particular attention [40]. Separating unburned carbon (UC) from coal fly ash (CFA) via froth flotation is described by Wu et al. [41]. Recovery of unburned carbon from CFA using magnetic separation and flotation methods has been described by Valeev at al. [42]. The mentioned methods are characterized by different efficiency of UC recovery. The study uses the separation in the rising water stream with additional purification by magnetic separation method [43].
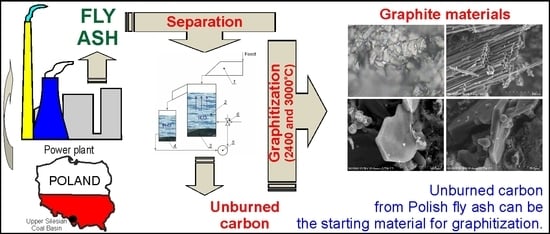
The aim of the work was to characterize the products of annealing at the temperatures of 2400 and 3000 °C of unburned carbon from coal fly ash in terms of its possible use as a starting material in the graphitization process. Carboniferous coal from the Upper Silesian Coal Basin (Poland) was burned in the power plant.
2. Materials and Methods
The unburned carbon recovery studies were conducted using a fly ash sample collected from the Siersza power plant deslagging system. This material was obtained in the combustion of hard coal in the pulverized coal boilers (300 and 250 MW).
Loss on ignition (LOI) was determined according to the procedure described in [44] at a temperature of 900 °C. The average content of unburned carbon in the ash, measured by roasting losses, was 15.8% and the yield of carbon recovery form fly ash was 73.4%. The carbonizate with 85% LOI content was obtained as a result of the separation of narrow ash grades in a rising stream of water and additional purification using the magnetic separation method. The research methodology for separation in the rising water stream [43] is presented in Figure 1. The water flow intensity was within a range of 1–3 dm3/min.
The material was obtained in the following way: a sample of Carbonizate 85 was dried, and the roasting losses were determined. Carbonizate 85 sample was the starting material for graphitization.
Carbonizate 85_2400 was obtained by heating a sample of carbon material (Carbonizate 85) in a graphite crucible placed in an induction graphitizing furnace in a reducing atmosphere. The annealing temperature was about 2400 °C. Uniform temperature increased from 20 to 2400 °C within 5 h. The cooling time of the crucible from the temperature of 2400 to 120 °C was about 145 h.
Carbonizate 85_3000 was obtained by heating a sample of carbon material (Carbonizate 85_2400) in a graphite crucible placed in an induction graphitizing furnace in a reducing atmosphere. The annealing temperature was about 3000 °C. Uniform temperature increased from 20 to 3000 °C within 7 h. The cooling time of the crucible from the temperature of 3000 to 120 °C was about 192 h.
Phase identification, the morphology of the grains included in them, the specific surface, parameters characterizing the pore size and the reflectance were determined.
For comparative purposes, the results obtained from graphitized samples (Carbonizate 85, Carbonizate 85_2400 and Carbonizate 85_3000) were compared to the results obtained for natural (GN sample) and artificial (GS sample) graphite. Natural crystalline graphite was obtained from JAK Sp. z o.o. (Poland, Warsaw), while artificial graphite was obtained from SGL Graphite Solutions Polska sp.z o.o.
Identification of mineral components in the samples was carried out by means of X-ray diffraction, using an AERIS 1 diffractometer from PANalytical, in the following conditions: CuKα radiation, 2theta angle range 7–70°, step size 0.02°, measurement time 1 s. The HighScore plus programme with database was used for identification.
The structural and morphological characterization of the selected samples was performed using a scanning electron microscope (SEM). The SEM analysis was carried out using a Hitachi SU3500 scanning microscope with variable pressure (SEM) operating.
As part of the reflectance tests, the random reflectance Rr [45] was measured. The random reflectance value depends on the arrangement of the grains in the briquette and can take values closer to the true maximum or minimum reflectance. Under polarized light, each anisotropic component exhibits some apparent maximum Rmax’ and minimum Rmin’ value of light reflection capability during full rotation of the microscope stage. At each measuring point, random values of Rmax’ and Rmin’ reflectance were recorded. In individual samples from 50 to 150, such measurements were made. Based on these results, the values of mean maximum, Rsmax, and minimum, Rsmin, reflectance were determined, and then, using the Kilby method [46], the true values were determined: maximum Rmax and minimum Rmin reflectance. The magnitude of reflective anisotropy was expressed by means of bireflectance Rbi = Rmax − Rmin.
For microscopic examination, a Zeiss reflected light microscope with a microphotometer was used. An immersion liquid with a refractive index no = 1.5176 was used at a temperature of 23 °C with a wavelength of λ = 546 nm.
Microscopic examinations were supplemented by observations in transmitted light using the Zeiss Axioskop microscope.
The porous structure characterization was performed with the application of the Autosorb iQ gas sorption analyzer (Quantachrome Instruments, Boynton Beach, FL, USA). The determination of the specific surface area was based on the nitrogen sorption isotherm at 77 K and the multipoint Brunauer-Emmett-Teller (BET) method. The pore size distribution was examined using nitrogen sorption data at 77 K and the Density Functional Theory (DFT) method. The total pore volume was determined as the volume adsorbed at the relative pressure of 0.99. The micropore area and volume was also determined with the use of carbon dioxide sorption data at 273 K and Monte Carlo (MC) method 9 [47,48].
3. Results and Discussion
3.1. Phase Identification by X-ray Diffraction (XRD)
As a result of X-ray diffraction tests, a significant amount of amorphous substance was found in the Carbonizate 85 sample, an organic substance, which was unburnt fuel. The presence of the amorphous substance is manifested by a significant increase in the background on the diffractogram in the range from low 2 theta angles to about 30° (Figure 2). The diffractogram also shows characteristic reflections which came from several minerals. These are typical admixtures in hard coal seams, which originate from the Upper Silesian Coal Basin. These minerals were quartz-SiO2, kaolinite-Al2SiO5(OH)4, and calcite-CaCO3.
Diffraction patterns of the Carbonizate 85_2400 and Carbonizate 85_3000 samples are very close to each other and their convergence with the diffractograms of artificial and natural graphite is visible. They contain charismatic reflections derived from graphite, demonstrating the presence and dominance of this phase in the samples tested (Figure 2).
3.2. Grain Morphology of Graphitization Products
Particles of the samples tested were observed under a scanning microscope at various magnifications. The tests have shown different grain morphology in individual samples (Figure 3). The presence of plate-shaped and tube-shaped grains was found. Plate forms are characteristic of GS, GN (Figure 3a–d), and they were present in the sample Carbonizate 85_3000 (Figure 3i,j). Grains in the form of tubes were found only in the sample Carbonizate 85_2400 (Figure 3g,h).
The tests have revealed that the size of the natural graphite plates is about 100 µm, and that of artificial graphite about 150 µm, and their thickness is on the order of several micrometers. In the Carbonizate 85_3000 sample, the plates are much smaller in size compared to natural and artificial graphite and reach a size of up to 20 µm, while the thickness is comparable to natural and artificial graphite.
A clearly ordered texture of the tubes is visible, manifested in parallel arrangement in the direction of elongation. Geometric parameters were measured for the tubes present in the Carbonizate 85_2400 sample, on the basis of which their elongation was calculated, which ranged from 0.89 to 0.93.
Observations of grain morphology in individual samples revealed significant porosity in the samples of Carbonizate 85 and Carbonizate 85_2400 compared to natural and artificial graphite. It was practically difficult to see the presence of pores in natural and artificial graphite. Meanwhile, the average diameter of pores in the grains of product samples after graphitization is varied. Their size in the Carbonizate 85 sample is 9.89 μm, while in the Carbonizate 85_2400 sample it is 12.22 µm. In turn, the average wall thickness of the pores for both compared samples is very similar and amounts to 4.21 and 4.43 µm, respectively. The average diameter of the tubes in the Carbonizate 85_2400 sample is maximum 8.55 µm, and the average tube wall thickness 1.04 µm (maximum 3 μm).
3.3. Reflectance of Graphitization Products
Natural graphite (GN) has an average random reflectance of Rr = 6.80% with a standard deviation of 2.98% (Table 1). The mean values of the maximum and minimum reflectance are Rsmax = 8.16% and Rsmin = 5.06%, respectively. Graphite in the analysed sample was in the form of very fine grains, which, in addition to strong reflective anisotropy, affects relatively large values of the standard deviation of the mean maximum and minimum reflectance values. The real values of maximum and minimum reflectance determined by the Kilby method are Rmax = 13.5% and Rmin = 0.70%, respectively. The magnitude of reflective anisotropy expressed by means of bireflectance Rbi is 12.8%.
The artificial graphite (GS) sample has a random reflectance of Rr = 7.18%, with a standard deviation of 2.70%. The average maximum and minimum reflectance values are Rsmax = 9.67% and Rsmin = 2.29%, respectively. The true maximum and minimum reflectance values are Rmax = 13.1% and Rmin = 0.70%, respectively. The bireflectance Rbi value is 12.4%. Artificial graphite grains are larger than natural graphite grains.
Grains with morphology indicative of temperature effects were found in the sample of Carbonizate 85. Part of the grains—the first ingredient for which reflectance was measured—is probably the remains of vitrinite. These grains are porous and have a smooth surface with a light grey colour. The tests have shown that this component has a random reflectance of Rr = 5.70%, with a standard deviation of 0.70%.
A large value of the standard deviation may indicate thermal changes in vitrinite structure. The average maximum and minimum reflectance values are Rsmax = 6.07% and Rsmin = 5.21%, respectively. This component is optically anisotropic. The values of the true maximum and minimum reflectance are Rmax = 7.30% and Rmin = 3.85%, respectively. Bireflectance adopts the value of Rbi = 3.45%.
The second component probably has a lower hardness than the other components of the sample. Therefore, it was not possible to obtain a microscopic preparation of a quality that allows correct measurement of the reflectance of this component (which is one of the difficulties in obtaining a polished surface). Based on microscopic observations, it can be concluded that this component is probably mesophase or even a graphite grain. However, the measured reflectance values are not characteristic of graphite. The average matrix reflectance is Rr = 3.67%, with a standard deviation of 1.02%. The average maximum and minimum reflectance values are Rsmax = 4.20% and Rsmin = 3.04%, respectively. The values of the true maximum and minimum reflectance are Rmax = 6.25% and Rmin = 1.75%, respectively. Bireflectance takes the value of Rbi = 4.50%. The data presented in Table 1 show that the value of the true maximum reflectance of the vitrinite residue is greater than the values of matrix reflectance. Laboratory experiments on the impact of temperature on the vitrinite structure show that the matrix of coke obtained from the vitrinite concentrate is characterized by higher maximum reflectance and optical anisotropy than vitrinite [49,50].
In the sample Carbonizate 85_2400, some of the grains—the first component for which reflectance was measured—are probably the remains of the vitrine. Studies have shown that this component has a random reflectance of Rr = 5.36%, with a standard deviation of 0.67%.
The average maximum and minimum reflectance values are Rsmax = 5.83% and Rsmin = 4.61%, respectively. This component is optically anisotropic. The values of the true maximum and minimum reflectance are Rmax = 7.30% and Rmin = 2.90%, respectively. Double reflection takes the value of Rbi = 4.40%.
The second component, similarly to the Carbonizate 85 sample, probably has a lower hardness than the rest of the sample components. Microscopic observations show that this component is probably mesophase or even a graphite grain. However, the measured reflectance values are not characteristic of graphite. The average matrix reflectance is Rr = 4.31%, with a standard deviation of 1.09%. The average maximum and minimum reflectance values are Rsmax = 4.95% and Rsmin = 3.62%, respectively. The values of the true maximum and minimum reflectance are Rmax = 7.05% and Rmin = 1.90%, respectively. Bireflectance takes the value of Rbi = 5.15%. The data presented in Table 1 show that the value of the true maximum reflectance of the vitrinite residue is similar to that of the matrix.
Based on the results presented, it can be stated that the value of true maximum reflectance Rmax > 9% determined for the tested samples of natural and artificial graphite is characteristic for graphite [1].
The beginning of initial graphitization, based on measurements of the maximum actual value of the light reflection coefficient, is determined by the Rmax value in the range from 6 to 6.5%. The semigraphite stage is achieved at Rmax in the range from 6.5% to 9% [1,51,52]. In the case of samples Carbonizate 85 and Carbonizate 85_2400, the determined Rmax values of the base mass may indicate the stage of initial graphitization [1].
The Carbonizate 85_3000 sample has a random reflectance of Rr = 11.88%, with a standard deviation of 2.17%. The average maximum and minimum reflectance values are Rsmax = 12.20% and Rsmin = 9.47%, respectively. The true values of maximum and minimum reflectance determined by the Kilby method are Rmax = 16.60% and Rmin = 4.90%, respectively. The bireflactance Rbi value is 11.70%. The value of maximum reflectance determined for sample Carbonizate 85_3000 is characteristic for graphite. The Carbonizate 85_3000 sample, however, was characterized by very high fragmentation, and reflectance measurements were only possible on larger, relatively homogeneous grains.
The highest values of reflectance were probably recorded on graphite grains. However, no surfaces with extreme bireflectance were observed. Grains with a shape similar to regular hexagons were often visible (Figure 4a). Most likely, these were cross-sections that were also planes (001) of graphite. Planes (001) are optically isotropic, yet anisotropy was observed on the measured surfaces. These measurements were probably carried out on planes inclined to the base of the pinacoid, sometimes forming packets (Figure 4b), hence the measured values of maximum and minimum reflectance.
In the case of the Carbonizate 85_3000 sample, the determined Rmax value of the matrix was 16.6%, which indicates the presence of graphite structures [1].
3.4. Textural Characteristics of Graphitization Products
The textural characteristics of the tested samples are given in Table 2, which clearly shows that the specific surface area of the initial sample (Carbonizate 85) is high and that it is close to 250 m2/g. However, it is much lower than the value characterizing active carbons, which may show values of this parameter in the range of 500–3000 m2/g [53,54]. In a one-step process for the production of active carbon from unburned carbon from various fly ashes, a material with a specific surface area of 157–1273 m2/g was obtained [55]. Pedersen et al. [56] report that the specific surface area of unburned carbon from coal fly ashes ranges from 45–400 m2 /g. It can therefore be concluded that the obtained value for the sample Carbonizate 85 is rather typical for this type of material.
As the temperature of graphitization increases, the specific surface area decreases to 44.13 and 23.52 m2/g for the samples of Carbonizate 85_2400 and Carbonizate 85_3000, respectively. This indicates a poorly developed porous structure responsible for the sorption capacity of materials. At the same time, attention should be drawn to the results of specific surface studies of natural (GN) and artificial (GS) graphite, which are higher (66.12 and 66.01 m2/g, respectively) compared to materials obtained as a result of graphitization.
The results of the total pore volume in the tested samples after graphitization are similar to each other and are in the range from 0.131–0.143 cm3/g. A similar value was found for natural graphite (GN) −0.137 cm3/g, although artificial graphite (GS) had a lower total pore volume of 0.095 cm3/g. The tested samples show a much lower pore volume compared to active carbons produced from unburned carbon from various fly ashes. The latter showed a pore volume in the range from 0.153–0.647 cm3/g [55].
The average pore diameter in the initial sample was 2.26 nm, and as the temperature of graphitization increased, the value of this parameter increased to 11.87 nm in the sample Carbonizate 85_2400 and 24.30 nm in the sample Carbonizate 85_3000. The value of this parameter for the initial sample is similar to the value of active carbons produced from unburned coal from various fly ashes, which have an average pore diameter in the range of 2.56–4.12 nm [55].
At the same time, attention should also be drawn to results of tests on the average pore diameter of natural (GN) and artificial (GS) graphite, which are lower (8.28 and 5.74 m2/g, respectively) compared to materials obtained as a result of graphitization.
Determined by the carbon dioxide isotherm method, the volume of micropores and the area in the range of 0.4–1.5 nm for the initial sample Carbonizate 85 were 0.149 cm3/g and 467.00 m2/g, respectively. In the case of graphitization of the starting material at 2400 °C, both these textural parameters reached values of 0.021 cm3/g and 54.62 m2/g, respectively. The above clearly indicates a seven-fold decrease in volume and an over eight-fold decrease in the area of micropores. At 3000 °C, the volume and area of the micropores further decreased and amounted to 0.011 cm3/g and 29.65 m2/g, respectively. This indicates a decrease by several times compared to the original sample (13- and 16-fold, respectively). It should be noted, however, that both the volume and the pore area of products after graphitization are higher compared to natural (GN) and artificial (GS) graphite.
4. Conclusions
As a result of the tests, an amorphous substance (organic substance) with an admixture of quartz, kaolinite and calcite was found in the sample subjected to graphitization. The graphite phase dominates in products subjected to graphitization at 2400 °C and 3000 °C.
The tests have shown different grains’ morphology in individual samples after graphitization at different temperatures: plate-shaped (3000 °C) and tube-shaped (2400 °C).
The grains’ morphology in the original sample and after graphitization at 2400 °C revealed their porosity. The average macropores diameter for these samples was 9.89 μm and 12.22 μm, respectively. The average wall thickness between the pores was comparable, and it was about 4 μm. The average diameter of the tubes in the sample after graphitization at 2400 °C was maximum 8.55 µm, and the average tube wall thickness 1.04 µm (maximum 3 µm).
The values of the true maximum reflectance Rmax of the starting material (6.25–7.30%) and its graphitization products at 2400 °C (7.05–7.30%) indicate the stage of initial graphitization, while the determined Rmax value of the matrix for the sample graphitized in at 3000 °C is characteristic for graphite (16.60%).
The textural parameters indicate that with the increase of the graphitization temperature of the starting material, the specific surface area in the graphitization products decreases from 248.72 m2/g to 23.52 m2/g (temperature 3000 °C), indicating a poorly developed porous structure responsible for the sorption capacity of materials.
The total pore volume, determined by the means of BET method, in samples after graphitization, regardless of temperature, was characterized by similar values (0.131–0.143 cm3/g). They were significantly lower than the pore volume of active carbon produced from unburned carbon from various coal fly ash (0.153–0.647 cm3/g).
As the temperature of graphitization increases, the average mesopores’ diameter increases (11.87 nm at 2400 °C and 24.30 nm at 3000 °C) compared to the original sample (2.56 nm), whose average pore diameter is similar to the pore diameter in active carbons (2.56–4.12 nm).
Micropore volume and area values in the diameter range from 0.4–1.5 nm, with increasing graphitization temperature decreasing several times both at 2400 °C and 3000 °C compared to the values specified for the original sample.
The results of these studies indicate the possibility of using unburned carbon from Polish power plant coal fly ash as a raw material in the graphitization process. It seems advisable to conduct further research on the quality of the products of this process.
Research is underway on the use of the obtained UC carbonation products for the production of graphite products such as carbon electrodes, composite sliding pads for traction machines, and brush materials. The possibilities of using these products in the production of modern batteries for electric vehicles are also analyzed.
Author Contributions
Data curation, Z.A., J.C.-M. and J.K.; Investigation, Z.A., J.C.-M., A.K. and J.K.; Methodology, B.B. and A.K.; writing—original draft preparation B.B., Z.A., J.C.-M., J.K. and A.K.; writing—review and editing Z.A., J.C.-M., B.B., J.K. and A.K.; Project administration, B.B. All authors have read and agreed to the published version of the manuscript.
Funding
This research was funded by the National Centre for Research and Development under the ERA-NET ERA-MIN Programme, grant number DZP/ERA-MIN-III/129/2016 “Coal char as a substituting material of natural graphite in green energy technologies” (CHARPHITE1).
Data Availability Statement
Not applicable.
Conflicts of Interest
The authors declare no conflict of interest.
References
- Kwiecińska, B.; Petersen, H.I. Graphite, semi-graphite, natural coke, and natural char classification—ICCP system. Int. J. Coal Geol. 2004, 57, 99–116. [Google Scholar] [CrossRef]
- Świdwińska-Gajewska, A.M.; Czerczak, S. Fullerenes: Characteristics of the substance, biological effects and occupational exposure levels. Med. Pr. 2016, 67, 397–410. [Google Scholar] [CrossRef] [PubMed] [Green Version]
- Nimibofa, A.; Newton, E.A.; Cyprain, A.Y.; Donbebe, W. Fullerenes: Synthesis and applications. J. Mater. Sci. Res. 2018, 7, 22–36. [Google Scholar] [CrossRef]
- EUR-Lex. Access to European Union law. European Commission, Communication from the Commission to the European Parliament, the Council, the European Economic and Social Committee and the Committee of the Regions. Critical Raw Materials Resilience: Charting a Path towards Greater Security and Sustainability COM. 2020, 474 Final. Available online: https://eur-lex.europa.eu/legal-content/EN/TXT/?uri=CELEX%3A52020DC0474 (accessed on 20 September 2021).
- Schabel, M.C.; Martins, J.L. Energetics of interplanar binding in graphite. Phys. Rev. 1992, 46, 7185–7188. [Google Scholar] [CrossRef] [PubMed]
- Chehreh Chelgani, S.; Rudolph, M.; Kratzsch, R.; Sandmann, D.; Gutzmer, J. A review of graphite beneficiation techniques. Miner. Process. Extr. Metall. Rev. 2016, 37, 58–68. [Google Scholar] [CrossRef]
- Jara, A.D.; Betemariam, A.; Woldetinsae, G.; Kim, J.Y. Purification, application and current market trend of natural graphite: A review. Int. J. Min. Sci. Technol. 2019, 29, 671–689. [Google Scholar] [CrossRef]
- Damm, S.; Qizhong, Z. Supply and Demand of Natural Graphite—DERA; Rohstoffinformationen 43: Berlin, Germany, 2020; p. 36. [Google Scholar]
- Wakamatsu, T.; Numata, Y. Flotation of graphite. Miner. Eng. 1991, 4, 975–982. [Google Scholar] [CrossRef]
- Mitchell, C.J. Industrial Minerals Laboratory Manual: Flake Graphite; Technical report WG/92/30; Mineralogy and Petrology Series; British Geological Survey: Nottingham, UK, 1993. [Google Scholar]
- Didolkar, V.K.; Kumar, V.A.; Pathak, S.U.; Tupkaray, R.H. Beneficiation of low grade graphite ore from Multai area, Betul district, M.P. In Proceedings of the Processing of Fines, Jamshedpur, India, 9–10 January 1997; pp. 177–188. [Google Scholar]
- Crossley, P. Graphite: Hight-tech supply sharpensyp. Ind. Miner. 2000, 398, 31–47. [Google Scholar]
- Kalyoncu, R.S.; Taylor, H.A. Natural graphite. In A Kirk-Othmer Encyclopedia of Chemical Technology Online; Othmer, K., Ed.; John Wiley & Sons: New Jersey, NJ, USA, 2002; pp. 1–21. [Google Scholar]
- Gredelj, S.; Zani, M.; Grano, S.R. Selective flotation of carbon in the Pb-Zn carbonaceous sulphide ores of Century Mine, Zinifex. Miner. Eng. 2009, 22, 279–288. [Google Scholar] [CrossRef]
- Kaya, Ö.; Canbazoğlu, M. Chemical demineralization of three different graphite ores from Turkey. Miner. Metall. Proc. 2009, 26, 158–162. [Google Scholar] [CrossRef]
- Elsner, H. Graphit und Schwefel; Bundesanstalt für Geowissenschaften und Rohstoffe: Hannover, Germany, 2020. [Google Scholar]
- Pierson, H.O. Handbook of Carbon, Graphite, Diamond and Fullerenes Properties; Processing and Applications, Noyes Publications: New Jersey, NJ, USA, 1993. [Google Scholar]
- Wissler, M. Graphite and carbon powders for electrochemical applications. J. Power Sources 2006, 156, 142–150. [Google Scholar] [CrossRef]
- Kuzvart, M. Industrial Minerals and Rocks in the 21st Century. In Utilización de Rocas y Minerales Industrials; del Cura, M.A.G., Cañaveras, J.C., Eds.; Universidad de Alicante, Sociedad Española de Mineralogía: Alicante, Spain, 2006; pp. 287–303. [Google Scholar]
- Simandl, G.J.; Paradis, S.; Akam, C. Graphite deposit types, their origin, and economic significance, Br. Columbia. Geol. Surv. Pap. 2015, 3, 163–171. [Google Scholar]
- Sun, L.; Xu, C.-P.; Xiao, K.; Zhu, Y.; Yan, L. Geological characteristics, metallogenic regularities and the exploration of graphite deposits in China. China Geol. 2018, 1, 425–434. [Google Scholar] [CrossRef]
- Olson, D.W. Graphite (Natural). In Mineral Commodity Summaries; U.S. Geological Survey: Reston, VA, USA, 2020; pp. 72–73. [Google Scholar]
- CUIP—Central Ukrainian Investment Portal. 2021. Available online: http://invest.kr-admin.gov.ua/index.php/en/pro-oblast-en/ekonomika-oblasti/mineralno-syrovynna-baza (accessed on 8 June 2021).
- Tang, J.; Pol, V.G. From allergens to battery anodes: Nature-inspired, pollen derived carbon architectures for room-and elevated-temperature li-ion storage. Sci. Rep. 2016, 6, 20290. [Google Scholar] [CrossRef]
- Dühnen, S.; Betz, J.; Kolek, M.; Schmuch, R.; Winter, M.; Placke, T. Toward green battery cells: Perspective on materials and technologies. Small Methods 2020, 4, 2000039. [Google Scholar] [CrossRef]
- Rodrigues, S.; Suárez-Ruiz, I.; Marques, M.; Camean, I.; Flores, D. Microstructural evolution of high temperature treated anthracites of different rank. Int. J. Coal Geol. 2011, 87, 204–211. [Google Scholar] [CrossRef]
- Cameán, I.; Garcia, A.B. Graphite materials prepared by HTT of unburned carbon from coal combustion fly ashes: Performance as anodes in lithium-ion batteries. J. Power Sources 2011, 196, 4816–4820. [Google Scholar] [CrossRef]
- Qiu, T.; Yang, J.-G.; Bai, X.-J.; Wang, Y.-L. The preparation of synthetic graphite materials with hierarchical pores from lignite by one-step impregnation and their characterization as dye absorbents. RSC Adv. 2019, 9, 12737–12746. [Google Scholar] [CrossRef] [Green Version]
- Hower, J.C.; Groppo, J.G.; Graham, U.M.; Ward, C.R.; Kostova, I.J.; Maroto-Valer, M.M.; Dai, S. Coal-derived unburned carbons in fly ash: A review. Int. J. Coal Geol. 2017, 179, 11–27. [Google Scholar] [CrossRef]
- Badenhorst, C.J.; Wagner, N.J.; Valentim, B.R.V.; Viljoen, K.S.; Santos, A.C.; Guedes, A. Separation of unburned carbon from coal conversion ash: Development and assessment of a dry method. CCGP J. 2019, 11, 89–96. [Google Scholar] [CrossRef]
- Blissett, R.S.; Rowson, N.A. A review of the multi-component utilisation of coal fly ash. Fuel 2012, 97, 1–23. [Google Scholar] [CrossRef]
- Emeka, A.E.; Chukwuemeka, A.J.; Okwudili, M.B. Deformation behaviour of erodible soil stabilized with cement and quarry dust. Emerg. Sci. J. 2018, 2, 383–387. [Google Scholar] [CrossRef] [Green Version]
- Çınar, M.; Karpuzcu, M.; Çanakcı, H. Effect of waste marble powder and fly ash on the rheological characteristics of cement based grou. Civ. Eng. J. 2019, 5, 777–788. [Google Scholar] [CrossRef] [Green Version]
- Kumar, B.; Sinha, S.; Chakravarty, H. Effect of nano iron oxide on strength and durability characteristics of high volume fly ash concrete for pavement construction. Int. J. Recent Technol. Eng. 2019, 8, 4365–4373. [Google Scholar] [CrossRef]
- Sam, J. Compressive strength of concrete using fly ash and rice husk ash: A review. Civ. Eng. J. 2020, 6, 1400–1410. [Google Scholar] [CrossRef]
- Styszko-Grochowiak, K.; Gołaś, J.; Jankowski, H.; Kozinski, S. Characterization of the coal fly ash for the purpose of improvement of industrial on-line measurement of unburned carbon content. Fuel 2004, 83, 1847–1853. [Google Scholar] [CrossRef]
- Batra, V.S.; Varghese, A.R.; Vashisht, P.; Balakrishnan, M. Value-added products from unburned carbon in bagasse fly ash. Asia Pac. J. Chem. Eng. 2011, 6, 787–793. [Google Scholar] [CrossRef]
- Bartoňová, L.; Juchelková, D.; Klika, Z.; Cech, B. On unburned carbon in coal ash from various combustion units. Int. J. Mater. Metall. Eng. 2011, 5, 280–283. [Google Scholar]
- Maroto-Valer, M.M.; Zhang, Y.; Lu, Z.; Andrésen, J.M.; Schobert, H.H. Development of value-added products from fly ash carbons. In Environmental Challenges and Greenhouse Gas Control for Fossil Fuel Utilization in the 21st Century; Maroto-Valer, M.M., Song, C., Soong, Y., Eds.; Springer: Boston, MA, USA, 2002; pp. 431–444. [Google Scholar]
- Alam, J.; Yadav, V.K.; Yadav, K.K.; Cabral-Pinto, M.M.; Tavker, N.; Choudhary, N.; Shukla, A.K.; Ahmed Ali, F.A.; Alhoshan, M.; Hamid, A.A. Recent advances in methods for the recovery of carbon nanominerals and polyaromatic hydrocarbons from coal fly ash and their emerging applications. Crystals 2021, 11, 88. [Google Scholar] [CrossRef]
- Wu, J.; Chen, L.; Zheng, J.; Sun, Z. Experimental investigation of the attachment of unburned carbon in coal fly ash to a stationary air bubble in aqueous solutions. Fuel 2021, 285, 119080. [Google Scholar] [CrossRef]
- Valeev, D.; Kunilova, I.; Alpatov, A.; Varnavskaya, A.; Ju, D. Magnetite and carbon extraction from coal fly ash using magnetic separation and flotation methods. Minerals 2019, 9, 320. [Google Scholar] [CrossRef] [Green Version]
- Wierzchowski, K.; Białecka, B.; Calus Moszko, J.; Klupa, A. Characterization of unburned carbon separated from power plant slag. Int. J. Environ. Sci.Technol. 2020, 17, 2499–2510. [Google Scholar] [CrossRef] [Green Version]
- EN Standard 196-2, Methods of Testing Cement—Part 2: Chemical Analysis of Cement; European Committee for Standarization: Brussels, Belgium, 2013.
- Kilby, W.E. Vitrinite reflectance measurement—Some technique enhancements and relationships. Int. J. Coal Geol. 1991, 9, 201–218. [Google Scholar] [CrossRef]
- Rouquerol, J.; Avnir, D.; Fairbridge, C.W.; Everett, D.H.; Haynes, J.H.; Pernicone, N.; Ramsay, J.D.F.; Sing, K.S.W.; Unger, K.K. Recommendations for the characterization of porous solids. Pure Appl. Chem. 1994, 66, 1739–1758. [Google Scholar] [CrossRef]
- Lowell, S.; Shields, J.E.; Thomas, M.A.; Thommes, M. Characterization of Porous Solids and Powders: Surface Area, Pore Size and Density; Kluwer Academic Publishers: Dordrecht, The Netherlands, 2004. [Google Scholar]
- Komorek, J.; Morga, R. Vitrinite reflectance property change during heating under inert conditions. Int. J. Coal Geol. 2003, 54, 125–136. [Google Scholar] [CrossRef]
- Komorek, J.; Morga, R. Evolution of optical properties of vitrinite, sporinite and semifusinite in response to heating under inert condition. Int. J. Coal Geol. 2007, 71, 389–404. [Google Scholar] [CrossRef]
- Komorek, J. Zmiany Struktury Wewnętrznej Witrynitu i Liptynitu Poddanych Oddziaływaniu Temperatury w Zakresie 400–1200 °C; Wydawnictwo Politechniki Śląskiej: Gliwice, Poland, 2013. [Google Scholar]
- Kwiecińska, B. Mineralogia grafitów naturalnych. Pr. Mineral. 1980, 67, 1–87. [Google Scholar]
- Taylor, G.H.; Teichmüller, M.; Davis, A.; Diessel, C.F.K.; Littke, R.; Robert, P. Organic Petrology; Gebrüder Borntraeger: Berlin-Stuttgart, Germany, 1998. [Google Scholar]
- Wang, J.N.; Zhang, L.; Niu, J.J.; Sheng, F.; Yu, Z.M.; Zhao, Y.Z.; Chang, H.; Pak, C. Synthesis of high surface area, water-dispersible graphitic carbon nanocages by an in situ template approach. Chem. Mater. 2007, 19, 453–459. [Google Scholar] [CrossRef]
- Xia, B.Y.; Wang, J.N.; Wang, X.X.; Niu, J.J.; Sheng, Z.M.; Hu, M.R.; Yu, Q.C. Synthesis and application of graphitic carbon with high surface area. Adv. Funct. Mater. 2008, 18, 1790–1798. [Google Scholar] [CrossRef]
- Zhang, E.Y.; Granite, J.; Maroto-Valer, M.M.; Tang, Z. Activated carbons produced from unburned carbon in fly ash and their application for mercury capture. Fuel Chem. Div. Prepr. 2003, 48, 32–33. [Google Scholar]
- Pedersen, K.H.; Jensen, A.D.; Skjøth-Rasmussen, M.S.; Dam-Johansen, K. A review of the interference of carbon containing fly ash with air entrainment in concrete. Prog. Energy Combust. Sci. 2008, 34, 135–154. [Google Scholar] [CrossRef]
Figure 1.
The research methodology for separation in the rising water stream (1—Feeder; 2—Separator; 3—Sediment (bottom product); 4—Overflow (top product); 5—Pump; 6—three-part valve).
Figure 1.
The research methodology for separation in the rising water stream (1—Feeder; 2—Separator; 3—Sediment (bottom product); 4—Overflow (top product); 5—Pump; 6—three-part valve).

Figure 2.
X-ray diffraction patterns of the tested samples.

Figure 3.
The morphology of particles in SEM images: (a,b)—plate form of graphite in sample GN; (c,d)—plate form of graphite in sample GS; (e,f)—unburned carbon before graphitization in sample Carbonizate 85; (g,h)—tubes form unburned carbon after graphitization in sample Carbonizate 85_2400; (i,j)—plate form similar to hexagonal shape after graphitization in sample Carbonizate 85_3000; the arrow points to the morphological form being described.

Figure 4.
Microscopic images of unburned carbon after graphitization in temperature 3000 °C: (a) in the centre, a regular graphite hexagon, transmitted light, parallel polarizers, magn. 400×; (b) graphite packages, reflected light, parallel polarizers, magn. 400×; the arrow points to the morphological form being described.


Table 1.
Results of reflectance measurements.
| Sample | Rr | sr | Rsmax | ssmax | Rsmin | ssmin | Rmax | Rmin | Rbi |
|---|---|---|---|---|---|---|---|---|---|
| (%) | |||||||||
| GN | 6.80 | 2.98 | 8.16 | 5.51 | 5.06 | 3.30 | 13.50 | 0.70 | 12.80 |
| GS | 7.18 | 2.70 | 9.67 | 1.27 | 2.29 | 1.45 | 13.10 | 0.70 | 12.40 |
| Carbonizate 85–vitrinite | 5.70 | 0.70 | 6.07 | 0.57 | 5.21 | 0.67 | 7.30 | 3.85 | 3.45 |
| Carbonizate 85–matrix | 3.67 | 1.02 | 4.20 | 1.08 | 3.04 | 0.66 | 6.25 | 1.75 | 4.5 |
| Carbonizate 85_2400–vitrinite | 5.36 | 0.67 | 5.83 | 0.6 | 4.61 | 0.81 | 7.30 | 2.90 | 4.40 |
| Carbonizate 85_2400–matrix | 4.31 | 1.09 | 4.95 | 1.00 | 3.62 | 0.94 | 7.05 | 1.90 | 5.15 |
| Carbonizate 85_3000 | 11.88 | 2.17 | 12.20 | 2.20 | 9.47 | 2.30 | 16.60 | 4.90 | 11.70 |
Explanations: Rr: random reflectance, sr: standard deviation of random reflectance Rr, Rsmax: mean maximum reflectance, ssmax: standard deviation of average maximum reflectance, Rsmin: average minimum reflectance, ssmin: standard deviation of average minimum reflectance, Rmax: true maximum reflectance, Rmax: true minimum reflectance, Rbi: bireflectance (Rbi = Rmax − Rmin).
Table 2.
Parameters of porous structure of samples determined on the basis of nitrogen sorption isotherm at 77 K and carbon dioxide sorption isotherm at 273 K (MC: Monte Carlo).
Table 2.
Parameters of porous structure of samples determined on the basis of nitrogen sorption isotherm at 77 K and carbon dioxide sorption isotherm at 273 K (MC: Monte Carlo).
| Sample Name | Specific Surface Area—Multipoint BET (m2/g) | Total Pore Volume (cm3/g) | Average Pore Diameter (nm) | MC Area (m2/g) | MC Volume (cm3/g) | MC Mode (nm) |
|---|---|---|---|---|---|---|
| GN | 66.12 | 0.137 | 8.28 | 83.87 | 0.032 | 0.69 |
| GS | 66.01 | 0.095 | 5.74 | 88.27 | 0.033 | 0.72 |
| Carbonizate 85 | 248.72 | 0.140 | 2.26 | 467.00 | 0.149 | 0.42 |
| Carbonizate 85_2400 | 44.13 | 0.131 | 11.87 | 54.62 | 0.021 | 0.82 |
| Carbonizate 85_3000 | 23.52 | 0.143 | 24.30 | 29.65 | 0.011 | 0.69 |
Publisher’s Note: MDPI stays neutral with regard to jurisdictional claims in published maps and institutional affiliations. |
© 2021 by the authors. Licensee MDPI, Basel, Switzerland. This article is an open access article distributed under the terms and conditions of the Creative Commons Attribution (CC BY) license (https://creativecommons.org/licenses/by/4.0/).
Share and Cite
MDPI and ACS Style
Adamczyk, Z.; Komorek, J.; Białecka, B.; Całus-Moszko, J.; Klupa, A. Possibilities of Graphitization of Unburned Carbon from Coal Fly Ash. Minerals 2021, 11, 1027. https://doi.org/10.3390/min11091027
AMA Style
Adamczyk Z, Komorek J, Białecka B, Całus-Moszko J, Klupa A. Possibilities of Graphitization of Unburned Carbon from Coal Fly Ash. Minerals. 2021; 11(9):1027. https://doi.org/10.3390/min11091027
Chicago/Turabian StyleAdamczyk, Zdzisław, Joanna Komorek, Barbara Białecka, Joanna Całus-Moszko, and Agnieszka Klupa. 2021. "Possibilities of Graphitization of Unburned Carbon from Coal Fly Ash" Minerals 11, no. 9: 1027. https://doi.org/10.3390/min11091027
Note that from the first issue of 2016, this journal uses article numbers instead of page numbers. See further details here.